Hart County lies in northeastern Georgia with Hartwell near the center, Bowersville and Canon toward the west, and a broad reservoir-and-river shoreline shaping the north and east. The four maps on this page separate those features so they remain easy to read. The general county view shows Hartwell, Bowersville, Canon, Reed Creek, Eagle Grove, major roads, streams, and the boundary. The city map highlights Hartwell and Bowersville, the water map labels the Tugaloo and Savannah rivers with numerous tributaries and small lakes, and the elevation map reports an actual range of about 141 to 296 meters with a mean of 229 meters. High-resolution A3 JPG originals of all four maps are available together in the downloadable ZIP.
Hartwell is the best place to begin because it is the county seat and the strongest road and settlement reference. Bowersville and Canon lie west of the city, Reed Creek is northeast near the large water edge, and Eagle Grove appears southwest. Interstate 85 is visible near the northwestern corner rather than running through Hartwell itself. The eastern side has a very different character: broad connected water follows the county boundary, and the supplied water map labels the Tugaloo River and Savannah River within that system. Comparing the roads, water, and relief makes it clear that Hart County is organized by both an inland Hartwell-centered network and a large eastern lake-and-river landscape.
Table of Contents
Hartwell, I-85, and the County Road Pattern
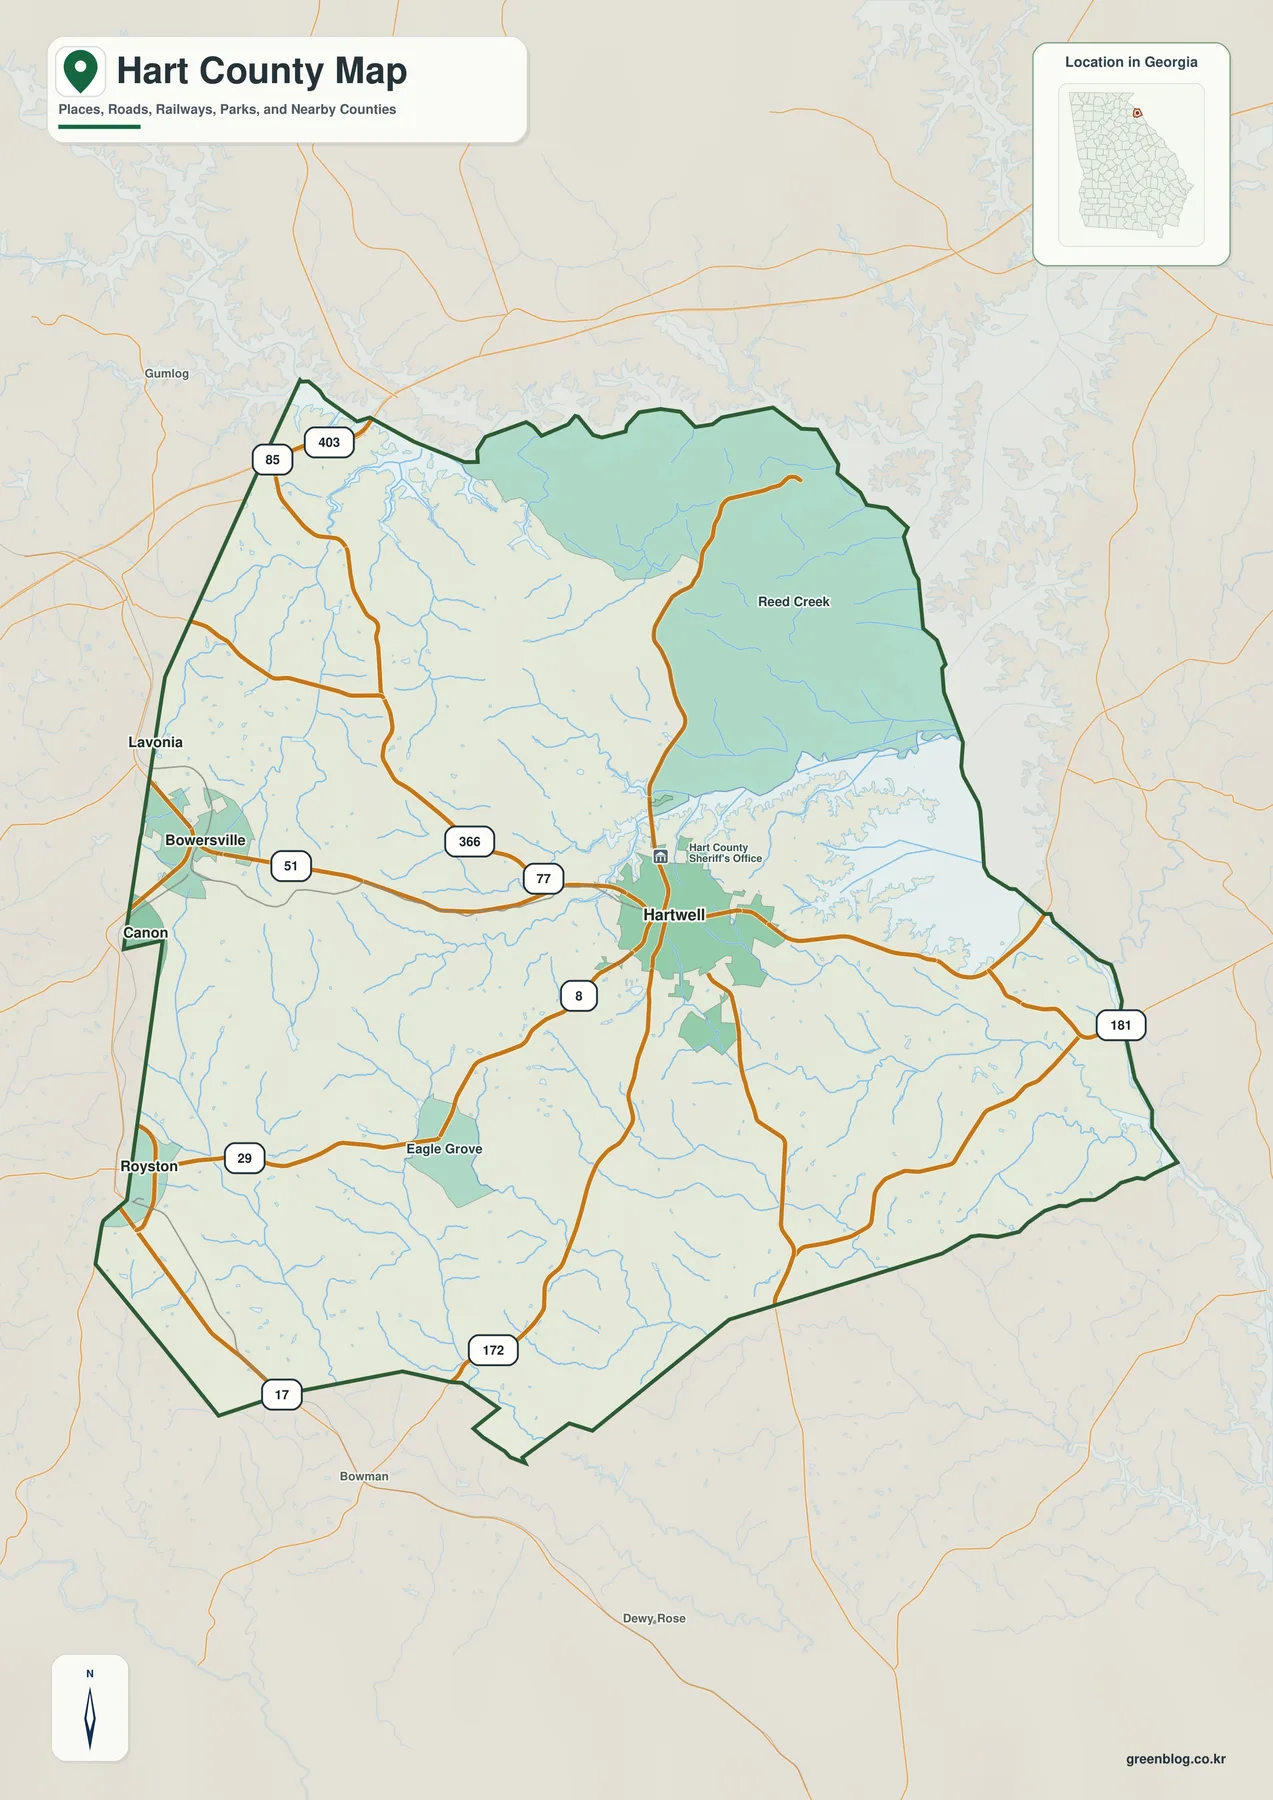
Hartwell appears near the center of the county and forms the strongest developed area on the general map. The Hart County Sheriff’s Office is labeled just north of the city. Route 51 approaches from the Bowersville and Canon side, Route 77 descends through the central county, Route 8 reaches southwest from Hartwell, and Route 181 extends toward the eastern boundary. Route 366 provides another northwestern connection, while Routes 29, 17, and 172 help locate the southern and southwestern areas. These roads are most useful as county-scale directional references rather than street-level navigation.
Interstate 85 and the 403 designation are shown close to the northwestern edge. That placement adds important context to the older article’s emphasis on an I-85 corridor, but it also prevents a misleading impression: Hartwell is not drawn directly on the interstate. The highway is an outer regional connection, while Hartwell’s local role depends more on the roads that converge within the county. Readers looking at transportation should therefore separate long-distance access at the northwest corner from the internal Hartwell-centered network.
Several labels outside the county provide orientation, including Lavonia, Royston, Bowman, and Gumlog. Within the boundary, Reed Creek lies much closer to the northeastern water than the western communities, while Eagle Grove provides a smaller southwestern reference. Numerous blue tributaries cross the open areas between roads. Their density shows that the county interior is divided by many small valleys even where the general map looks mostly rural and lightly developed.
Hartwell and Bowersville on the Ranked City Map
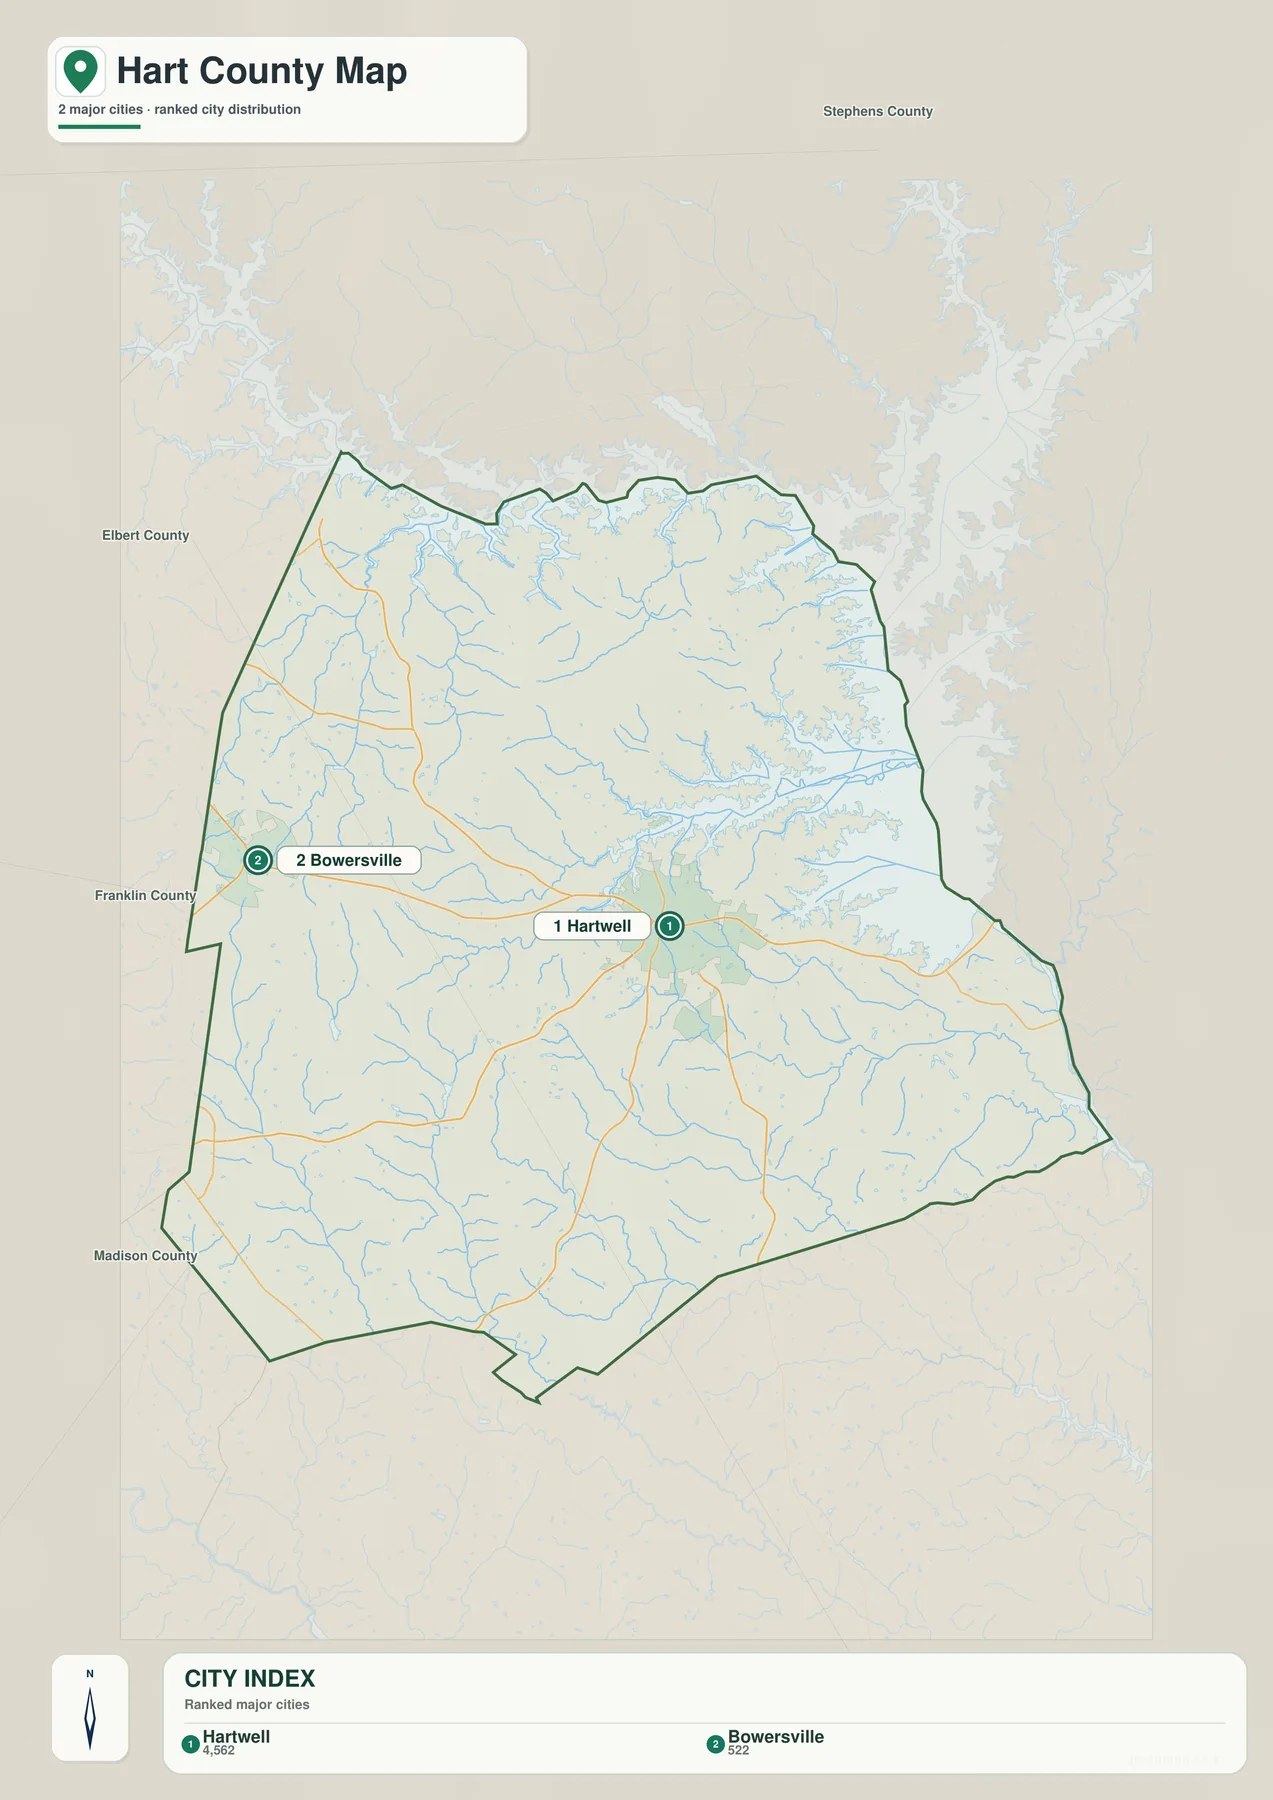
The city view removes most road and facility detail and highlights only two places. Its CITY INDEX lists Hartwell at 4,562 and Bowersville at 522. Those figures are the values printed on the supplied map and are included here to explain the graphic’s ranking; they are not newly calculated population estimates for this article. Readers who need current official figures should use the Census QuickFacts source in the reference section.
The map does not draw a distance connector between Hartwell and Bowersville, so no mileage is inferred here. What it shows clearly is relative position. Hartwell occupies the central urban reference, while Bowersville is placed near the western county side. The general county map adds Canon, Reed Creek, and Eagle Grove, which means the two-city graphic should be understood as a simplified ranked view rather than a complete list of every named place.
Stephens, Elbert, Franklin, and Madison counties appear around the frame as regional references. Bowersville sits closest to the Franklin County side, while the large water surface dominates the north and east beyond Hartwell. Those outside labels are not survey measurements, but they help explain Hart County’s northeastern Georgia setting and why the eastern shoreline is such a prominent part of the map.
Tugaloo and Savannah Rivers Along the Lake Hartwell Shoreline
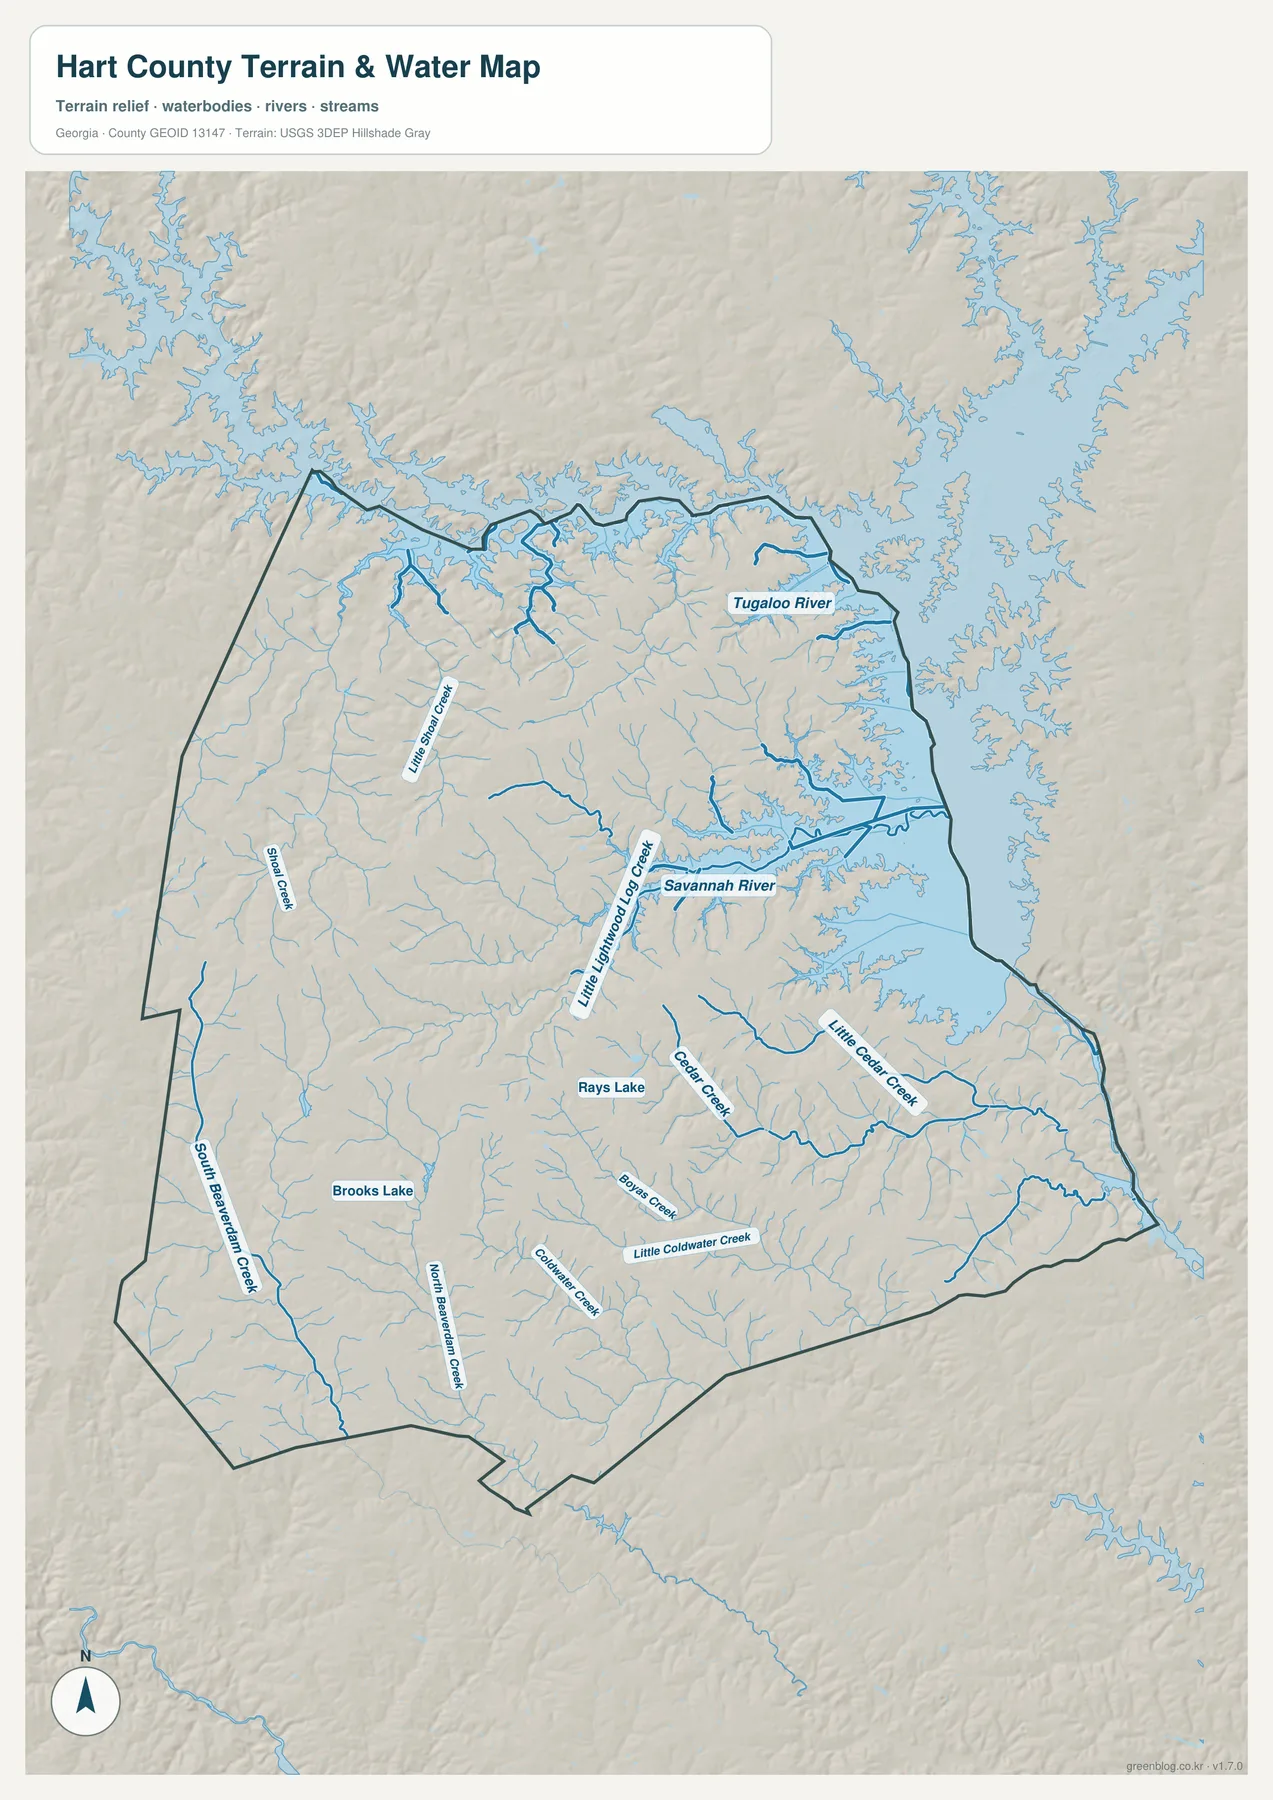
The most dominant water feature is the broad connected shoreline along the north and east. The source article identifies Lake Hartwell as a defining local feature, while the supplied water preview directly labels the Tugaloo River in the northeast and the Savannah River farther south. Long branches of water extend inland from the county edge, producing a much more irregular shoreline than the general road map suggests. Reed Creek and the Hartwell side are therefore closely tied to a reservoir-and-river landscape rather than a simple straight boundary.
Little Shoal Creek descends through the northwestern interior, and Shoal Creek follows a long western valley. Near the central-eastern side, Little Lightwood Log Creek reaches toward the major water. Cedar Creek and Little Cedar Creek occupy separate eastern and southeastern valleys. Farther south, Little Coldwater Creek and Coldwater Creek are labeled, while South Beaverdam Creek provides a long southwestern reference. These names show how many inland channels feed the larger water system or cross the rolling terrain before leaving the county.
Rays Lake and Brooks Lake are two small named inland water bodies. They are much smaller than the Lake Hartwell shoreline, but they provide useful local reference points in parts of the county where the tributary network is dense. The water map is especially useful because it separates large rivers, reservoir arms, creeks, and small lakes without requiring readers to identify them among all the road labels on the general map.
This water view is intended for county-scale geographic orientation. It does not establish parcel flood status, shoreline ownership, water depth, marina access, or boating conditions. Those questions require current specialized records. For ordinary map reading, the useful relationships are the Tugaloo and Savannah river labels along the eastern water, the long reservoir arms near Reed Creek and Hartwell, and the tributaries such as Little Shoal, Cedar, Little Cedar, and South Beaverdam Creek that divide the inland hills.
Elevation from About 141 to 296 Meters
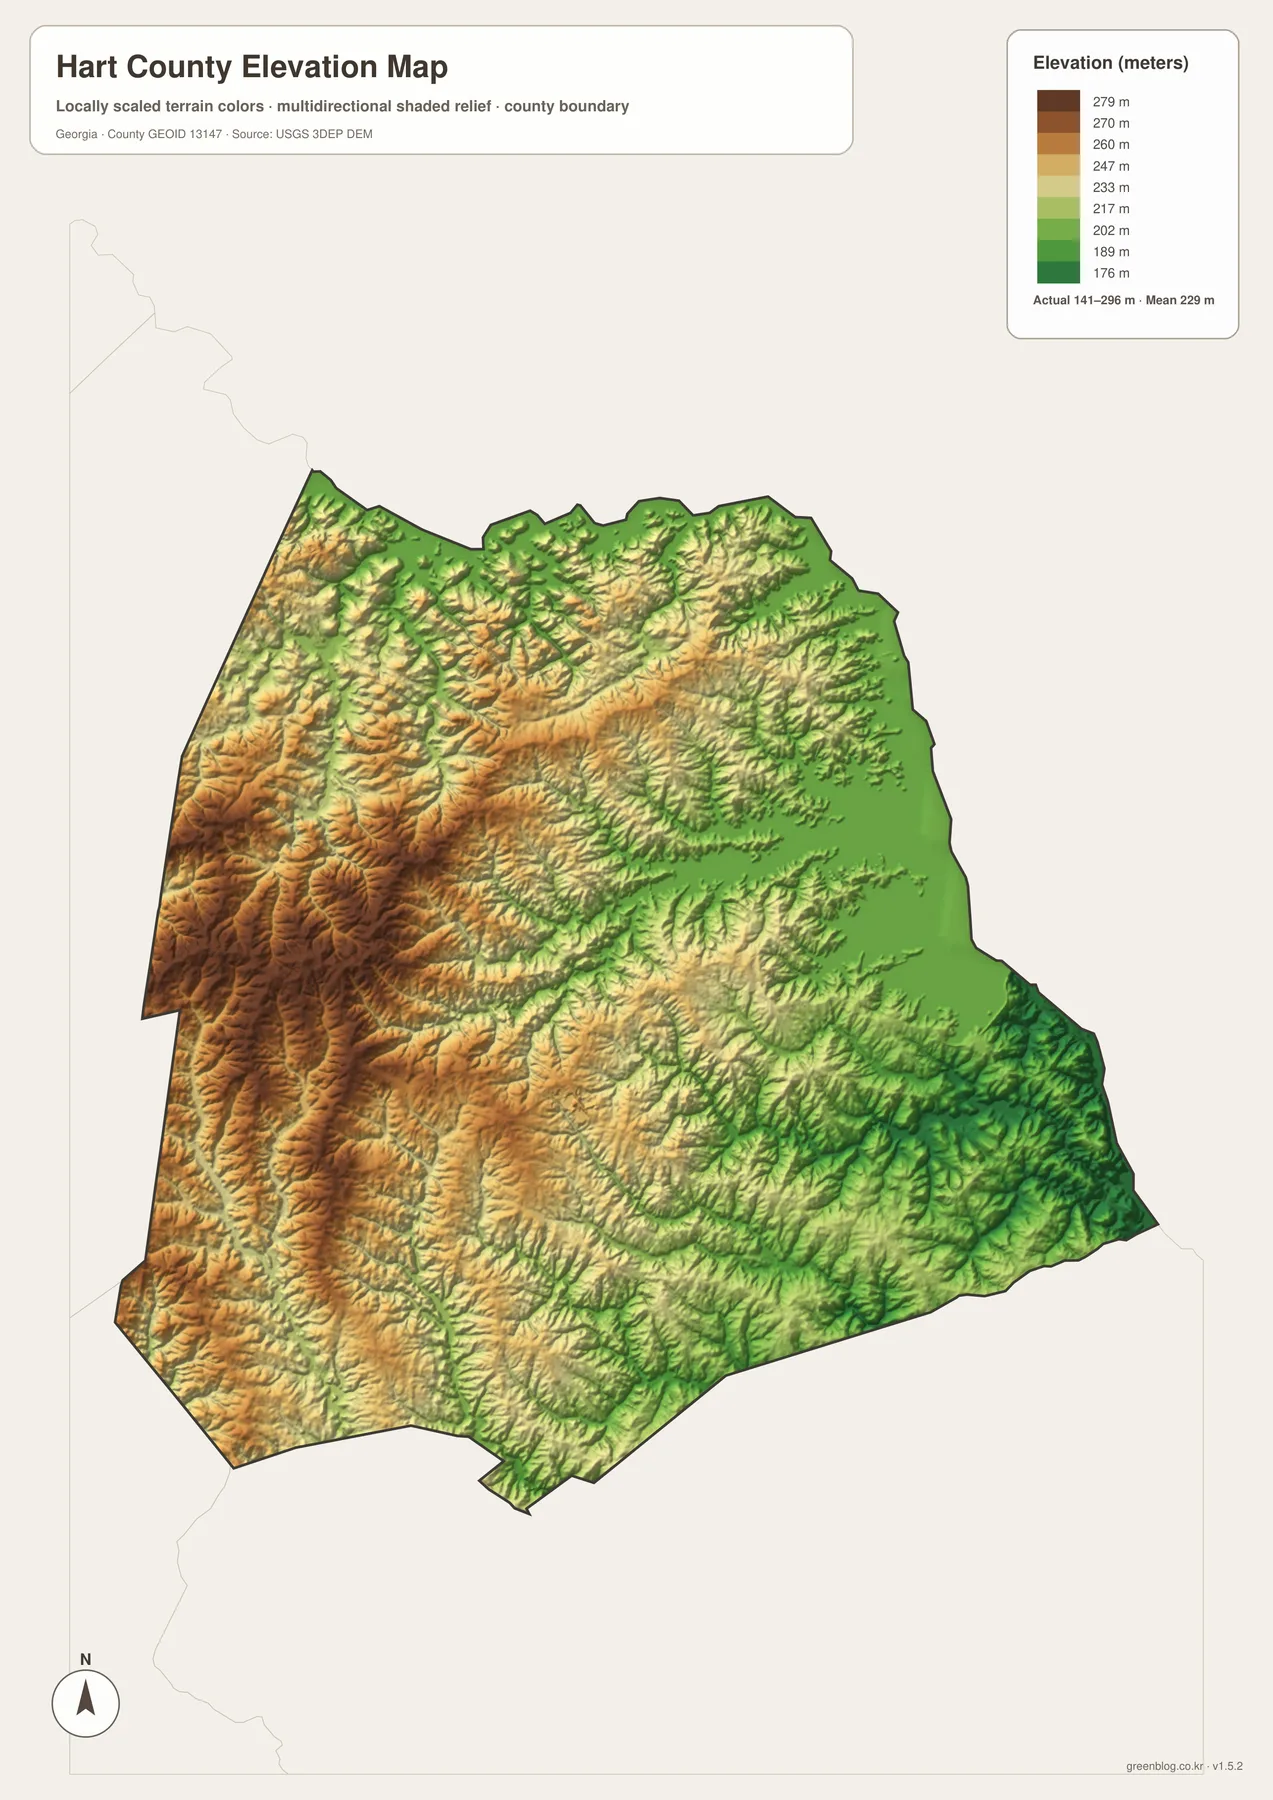
The supplied elevation view reports an actual range of approximately 141 to 296 meters, with a mean of 229 meters. The western and west-central interior contains the broadest tan and brown higher ground. In contrast, the eastern reservoir edge and many stream valleys appear green and lower. A difference of roughly 155 meters is moderate compared with mountain counties farther north, but the dense relief still makes Hart County look distinctly rolling rather than flat.
The lowest terrain is closely associated with water. Green corridors reach inland from the eastern shoreline, and the Cedar Creek and Little Cedar Creek valleys occupy lower paths through the hills. The Tugaloo and Savannah side is especially low compared with the western interior. This relationship becomes much easier to see when the water and elevation maps are placed side by side: branching water follows the same parts of the county where relief drops into green valleys.
The western half has more continuous higher relief, but it is not a single plateau. Shoal Creek, South Beaverdam Creek, and many unnamed tributaries cut narrow lower channels through the rolling uplands. Hartwell itself sits within this mixed terrain rather than at the county’s highest point. Overall elevation tends to fall toward the eastern water, yet repeated local ridges and valleys prevent the county from being described accurately as one simple west-to-east slope.
The relief colors are designed for broad comparison across Hart County, not for determining the exact elevation of a building lot, road project, or drainage design. Site-specific work requires finer elevation data and, when appropriate, field measurements. For classroom geography, county profiles, or presentations, the 141–296 meter range clearly shows the higher western rolling ground and the lower lake-and-river valleys to the east.
Hartwell, Lake Hartwell, and the Northwest I-85 Connection
The source material in the package states that Hart County was established in 1853 and identifies Lake Hartwell, Interstate 85, manufacturing, agriculture, and access toward South Carolina as parts of the county’s modern regional setting. The four maps here do not measure industrial output, farm acreage, or traffic volumes. Instead, they provide the geographic framework behind those subjects: Hartwell at the internal road center, I-85 near the northwestern edge, the broad lake-and-river shoreline to the east, western communities such as Bowersville and Canon, and rolling relief between about 141 and 296 meters.
The general county view is the best starting point when roads, places, and the boundary all matter. The ranked city map provides a cleaner comparison of Hartwell and Bowersville. The water map is the stronger reference for Lake Hartwell’s branching shoreline, the Tugaloo and Savannah rivers, and named tributaries, while the elevation map explains why eastern water occupies lower terrain and why the western interior appears more strongly rolling.
Hartwell ties the four themes together particularly well. Routes 51, 77, 8, and 181 spread from the city in different directions. Moving east brings the broad water system close to the urban area; moving west leads toward Bowersville, Canon, and higher rolling terrain; and the northwestern corner provides the I-85 regional connection. Reading those relationships together shows Hart County as more than a lake destination or highway-edge county. It is a county where an inland city center, reservoir shoreline, river valleys, and rolling uplands meet within a relatively compact area.
Frequently Asked Questions
Which cities are emphasized on the ranked city view?
The supplied city map highlights Hartwell and Bowersville. Its CITY INDEX shows Hartwell at 4,562 and Bowersville at 522, while the general county map also labels Canon, Reed Creek, and Eagle Grove.
Which rivers and creeks are named around the Lake Hartwell side?
The water view labels the Tugaloo River and Savannah River along the major eastern water system. Little Shoal Creek, Shoal Creek, Cedar Creek, Little Cedar Creek, Little Coldwater Creek, Coldwater Creek, and South Beaverdam Creek provide inland references.
What elevation range is shown for Hart County?
The map reports an actual range of about 141 to 296 meters and a mean of 229 meters. Western and west-central rolling ground is generally higher, while the eastern shoreline and many stream valleys lie lower.
What is included in the downloadable A3 ZIP?
The archive contains four large JPG originals covering the county reference map, Hartwell–Bowersville city distribution, water network, and elevation. Separating the themes keeps roads, settlement, water labels, and relief easier to read when printed or placed in a document.
Map File Information
Hart County A3 Map Files
- Included Files: 4 high-resolution A3 JPG maps described on this page
- File Type: JPG files in a ZIP archive
- Intended Use: Printing, education, presentations, and map-based projects
Related Maps
Hart County Data and Map References
- U.S. Census Bureau QuickFacts: Hart County – current official county statistics
- Hart County official profile – county administration and local background
- New Georgia Encyclopedia: Hart County – county history and the 1853 establishment date
- Census TIGER/Line boundary resources – Hart County and neighboring-county reference geometry
- USGS hydrography resources – reference data for the Tugaloo and Savannah rivers, tributaries, and mapped waters
- USGS 3DEP elevation resources – source elevation data for comparing the 141–296 meter terrain range
Green Map creates custom-edited map images using open geographic data sources such as geoBoundaries, Natural Earth, OpenStreetMap, and government open data. These maps are edited visual materials, not raw data files, and are provided for education, documents, presentations, and graphic reference.