A Japan Map must balance geographic distance with readable detail. The main island chain forms a long northeast-to-southwest arc, while Okinawa lies much farther southwest than the landscape page can show comfortably. Drawing every island at its full relative position would leave a large area of open sea and make the prefectural labels smaller. This collection uses a separate Okinawa inset so Hokkaido, Honshu, Shikoku, Kyushu, and the southwestern islands remain useful on the same canvas.
The page presents three coordinated maps and one companion flag image. The color map labels prefectures and groups them visually by region. The black-and-white version keeps the same names and boundaries without colored fills. The outline removes geographic labels and region colors, leaving a working base for exercises and custom graphics. The flag is a separate national symbol rather than a fourth geographic version.
Each published map preview measures 1200×848 pixels, and the supplied map files are described as 4960×3504. All three share the same landscape geometry and prefectural framework. That consistency lets a reader move from reference to practice without learning a new arrangement. Use the labeled files for orientation and the blank Japan Map for original colors, numbers, translated labels, or a limited data overlay.
Table of Contents
Basic Information About Japan
Japan is an East Asian archipelago divided administratively into 47 prefectures. Hokkaido occupies the large northern island, and most prefectures lie along Honshu, the longest and most populous main island. Shikoku sits south of western Honshu, Kyushu lies farther southwest, and Okinawa Prefecture extends through the Ryukyu island chain. The maps emphasize these first-level divisions rather than municipal boundaries.
The labeled versions also identify eight familiar geographic regions: Hokkaido, Tohoku, Kanto, Chubu, Kansai, Chugoku, Shikoku, and Kyushu. These labels organize the prefectures into broad areas for orientation; they do not replace the 47 prefectural boundaries drawn underneath. A Japan Map can therefore support two reading levels at once—regional location first, then a specific prefecture.
Tokyo is labeled in Kanto on eastern Honshu. Kyoto and Osaka appear in Kansai, while prefectures such as Aomori, Akita, Iwate, Miyagi, Yamagata, and Fukushima form Tohoku south of Hokkaido. The western end of Honshu leads through Chugoku toward Kyushu, with Shikoku positioned across the Inland Sea. Okinawa is placed inside a boxed inset on the two labeled maps so its islands can be seen without compressing the main chain.
A practical reading route starts at Hokkaido, moves down through Tohoku and Kanto, follows Honshu west through Chubu, Kansai, and Chugoku, then compares Shikoku and Kyushu. Okinawa should be read after that main sequence because the inset changes its page position. This route helps learners connect the region callouts with prefecture names while avoiding the false impression that the inset shows ordinary geographic distance.
Structure of the Japan Map Collection
The three map styles answer different questions. Color answers “Which broad region contains this prefecture?” Black and white answers “Where is this named prefecture?” while remaining economical to print. The outline asks the user to supply names or categories. Boundaries and island positions stay consistent, so the files can be combined in one lesson, report, or presentation.
The landscape format is important because Japan is both long and diagonally oriented. Preserve the 1200×848 preview ratio, or the corresponding 4960×3504 source ratio, instead of stretching the artwork into a portrait frame. If the full country becomes too small in a document, use a larger landscape page or crop a duplicate for a regional detail while keeping the original file unchanged.
1️⃣ Color-Coded Japan Map
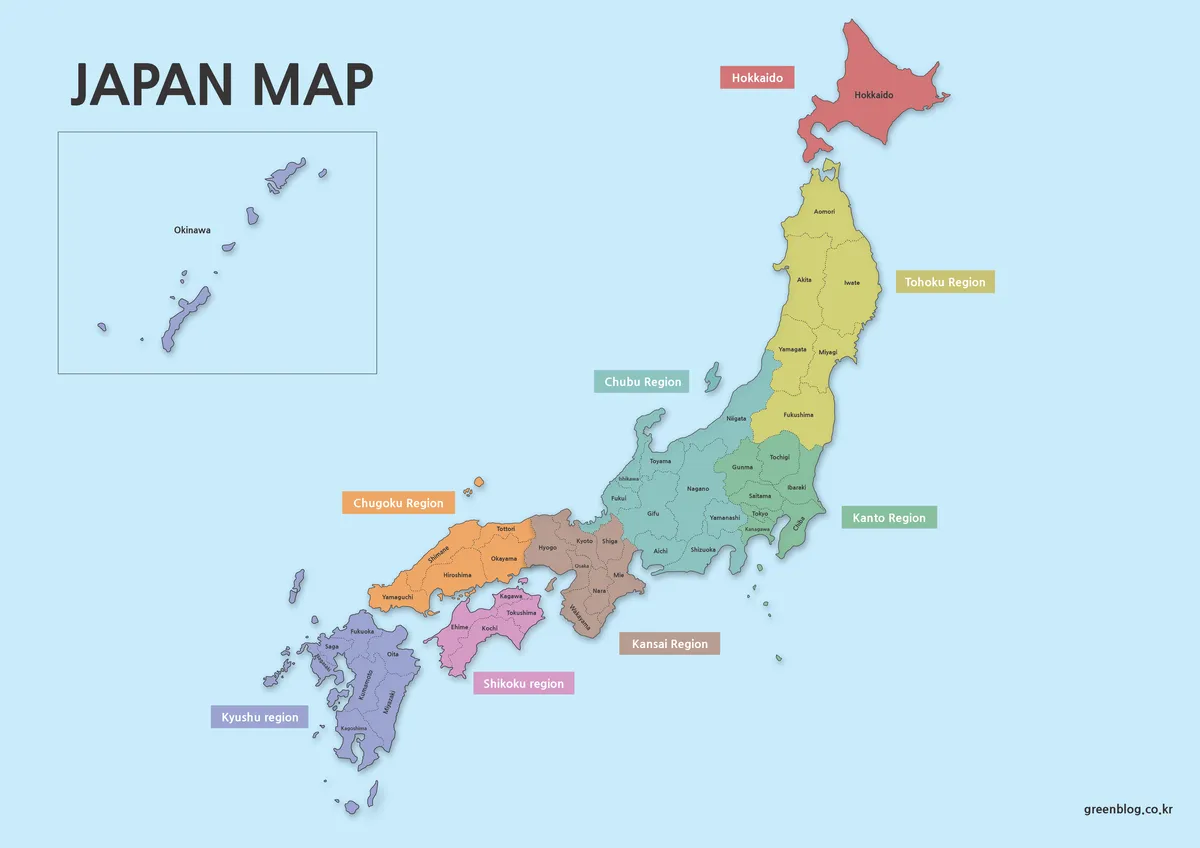
The color file assigns one coordinated fill to each of the eight regions while retaining thin prefectural lines and names. Hokkaido appears red, Tohoku yellow, Kanto green, Chubu blue-green, Kansai brown, Chugoku orange, Shikoku pink, and Kyushu purple. The shades are categorical: they separate areas visually but do not represent population, area, elevation, or rank.
This hierarchy makes the color Japan Map useful for an opening slide, a regional comparison, or an answer sheet. A reader can identify the regional block before searching for an individual prefecture. If new statistics are added, create a separate legend and use symbols or a new controlled scale; otherwise, the existing regional colors could be mistaken for the data itself.
2️⃣ Black and White Map (Print-Friendly)
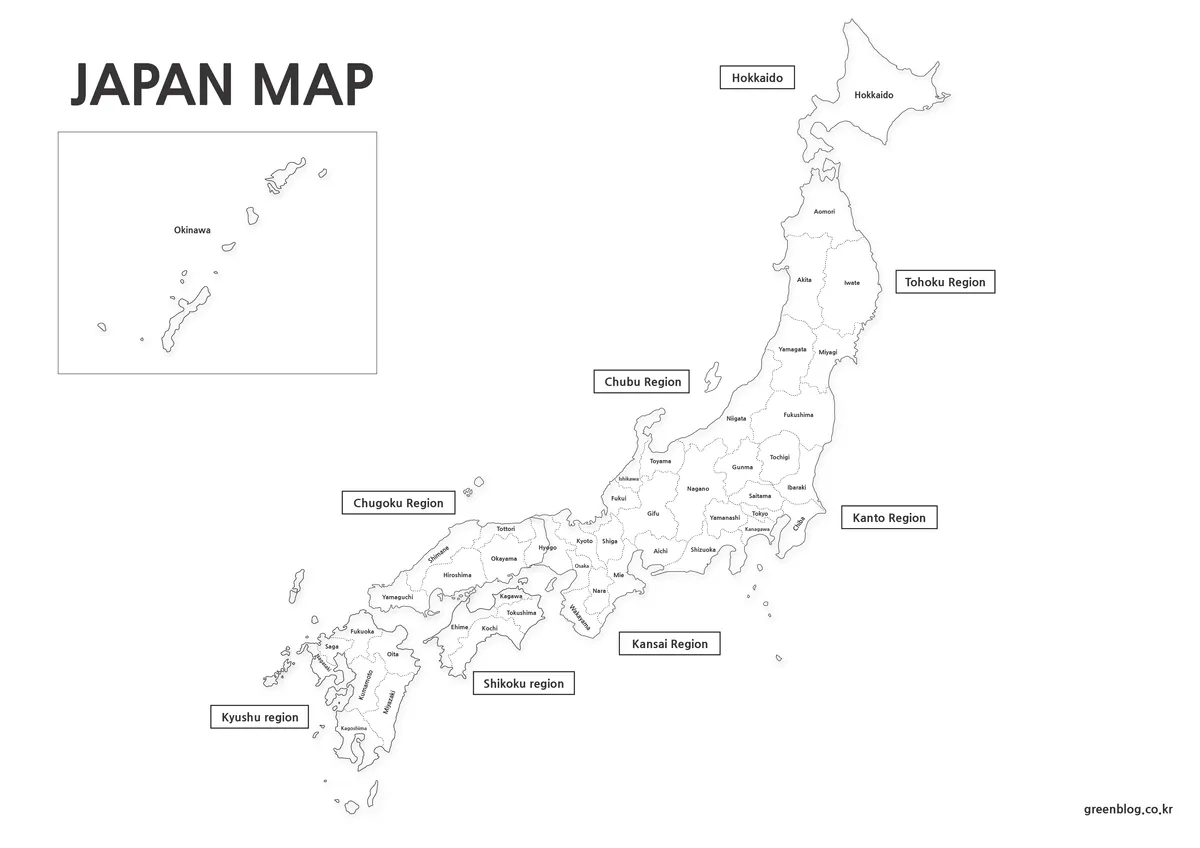
The monochrome version removes regional fills but preserves prefecture names, boundary lines, regional callouts, and the Okinawa inset. Black outlines on a white field reproduce cleanly in office documents and classroom packets. The lack of background color also leaves more visual room for circles, arrows, route lines, or a few handwritten notes.
Use the black-and-white Japan Map when labels must remain visible but color printing is unnecessary. Before producing multiple copies, print one test sheet and inspect the smallest prefectural names around Kanto, Kansai, and western Honshu. A landscape page, narrow margins, and proportional scaling will usually preserve more detail than forcing the image into a smaller portrait space.
3️⃣ Outline Map (For Graphic Work)
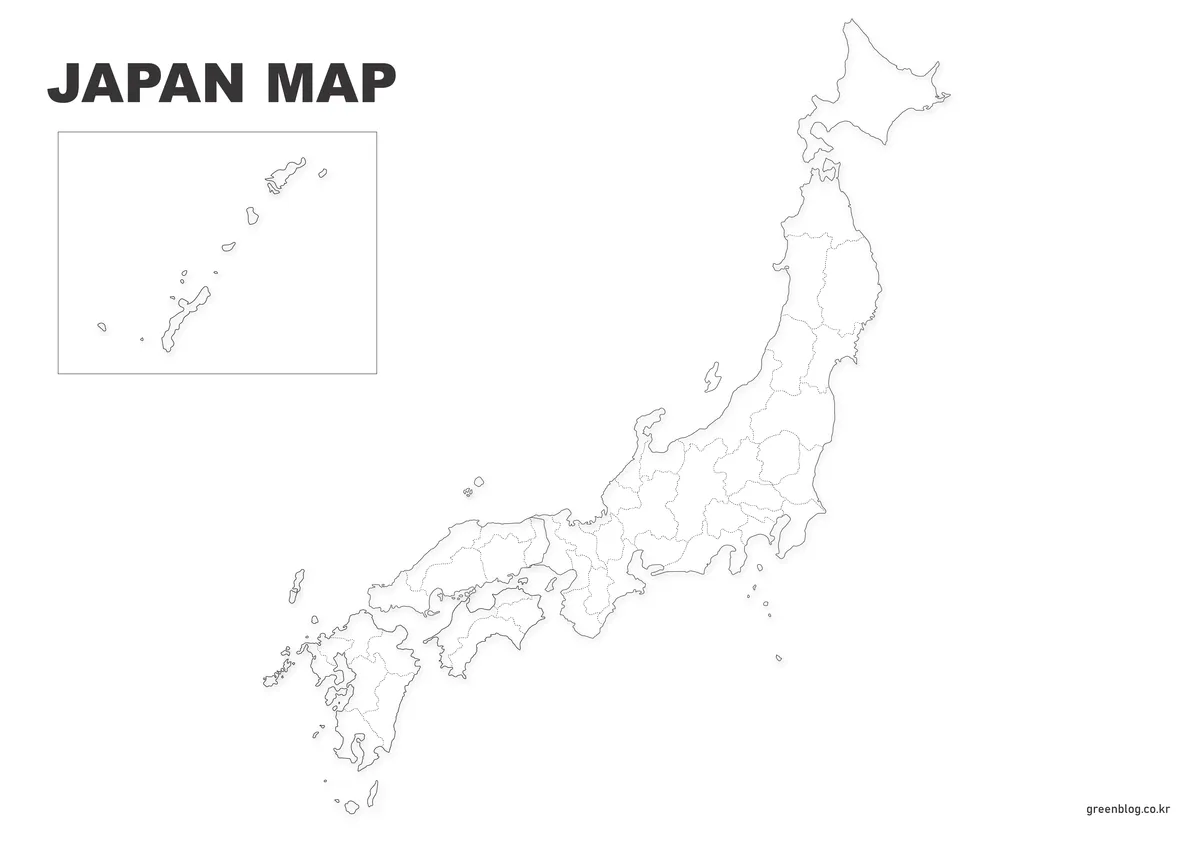
The outline removes prefecture names, region callouts, and colored fills while keeping the national coastline and internal prefectural divisions. Okinawa’s islands remain separated from the main chain within the page layout, but the boxed label treatment used by the reference maps is gone. The result is a neutral base rather than an answer key.
A blank Japan Map can become a prefecture quiz, a coloring activity, a numbered answer exercise, or the base of a choropleth-style graphic. Decide what each color means before editing, use a legend with units and a source date for data work, and keep an untouched copy. Because the supplied asset is raster-based, repeated erasing or resizing can reduce line quality.
4️⃣ Japan Flag Image
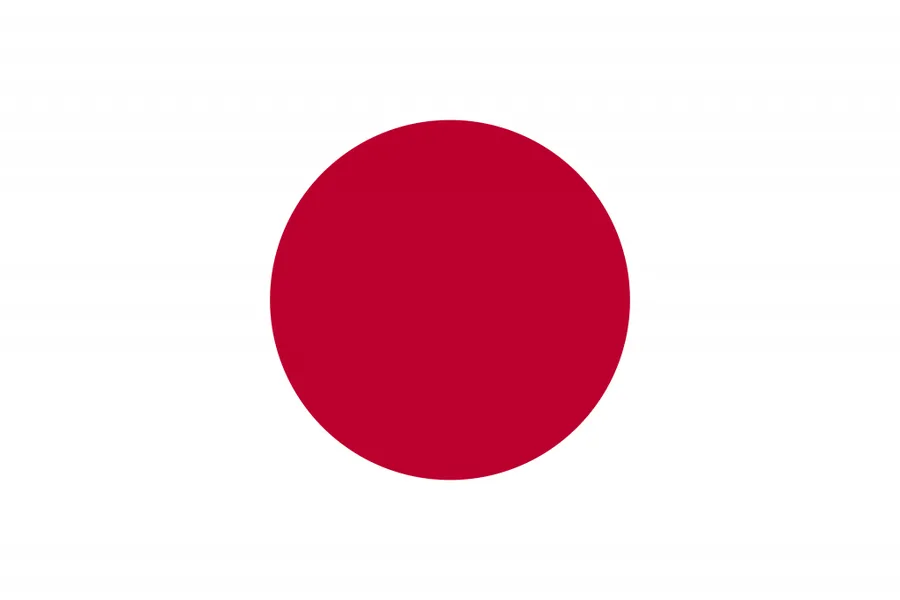
The separate 900×600 flag image uses a red disc centered on a white 3:2 field. It contains no coastline, prefectural border, or geographic label. Use it as a national identifier beside a page title, presentation opening, or country profile rather than treating it as another map version.
Keeping the flag independent from the maps protects the geographic information. A full-opacity flag overlay would hide small islands and administrative lines, while a heavily transparent overlay could still make labels difficult to read. The three maps carry location and boundary information; the flag supplies visual context only.
Choosing a Japan Map Version
Choose color for quick regional orientation, black and white for a labeled handout or report, and the outline for recall practice or original data. A multi-stage lesson can begin with the color reference, continue with the monochrome sheet, and finish on the outline. A design project can follow the same sequence by using the labeled file to verify placement before editing a copy of the blank base.
The Okinawa inset improves legibility but does not show the full geographic distance between Okinawa and Kyushu. Add an explanatory note whenever relative distance is central to the task. These images are communication and study resources, not navigation, surveying, or legal boundary documents. For authoritative geospatial work, consult current official mapping data and use a source with suitable scale and coordinates.
For classroom use, separate recognition from production. Ask students to identify regions on the color map, locate selected prefectures on the monochrome map, and transfer the same information to the outline. For a report, choose only the version needed and add a concise caption explaining the Okinawa inset. For design work, test the final image at its actual display size so small islands and internal borders do not disappear after export.
Frequently Asked Questions
What can these Japan maps be used for?
They can be used for blog posts, educational materials, presentations, printed documents, and non-commercial graphic projects.
What are the resolution and size of the maps?
All maps were created at 4960 × 3504 resolution, considering Japan’s long geographic shape. The files remain clear even when zoomed in.
Can they be printed on A4 paper?
Yes. The black and white and outline maps were designed with printing in mind and remain readable when printed on A4 size.
Can these maps be used on personal blogs or for learning materials?
Can these maps be used on personal blogs or for learning materials?
Download Information
The protected ZIP contains the three map styles: color labeled, black-and-white labeled, and blank outline. Download the archive once, extract it, and preserve the original files before making edits. The Japanese flag remains the separate companion image shown on the page rather than a fourth cartographic style.
Map File Information
This archive contains three coordinated Japan map files for reference, printing, lessons, and custom graphics.
- Included Versions: Color labeled, black-and-white labeled, and blank outline
Related Maps
Additional Resources
The Geospatial Information Authority of Japan provides official mapping, surveying, and geospatial information for readers who need authoritative national reference material.
Green Map creates custom-edited map images using open geographic data sources such as geoBoundaries, Natural Earth, OpenStreetMap, and government open data. These maps are edited visual materials, not raw data files, and are provided for education, documents, presentations, and graphic reference.