U.S. state asphalt and road oil prices were concentrated in a fairly narrow range in 2024, with a few clear high-price outliers. In the EIA State Energy Data System, California was highest at $24.01 per million Btu and Hawaii followed at $23.29. Arizona was lowest at $14.26. Across the 50 states and the District of Columbia, the simple mean was $16.74/MMBtu and the median was $16.46.
The label can be misleading if it is read as a general industrial petroleum price. SEDS assigns all asphalt and road oil consumption to the industrial sector because these products are used mainly in construction activity. The price series is centered on asphalt binder or asphalt cement used in road construction. It is therefore best interpreted as a state-level road-paving material price measure within EIA’s energy accounting system, not as a retail fuel price paid by a typical factory.
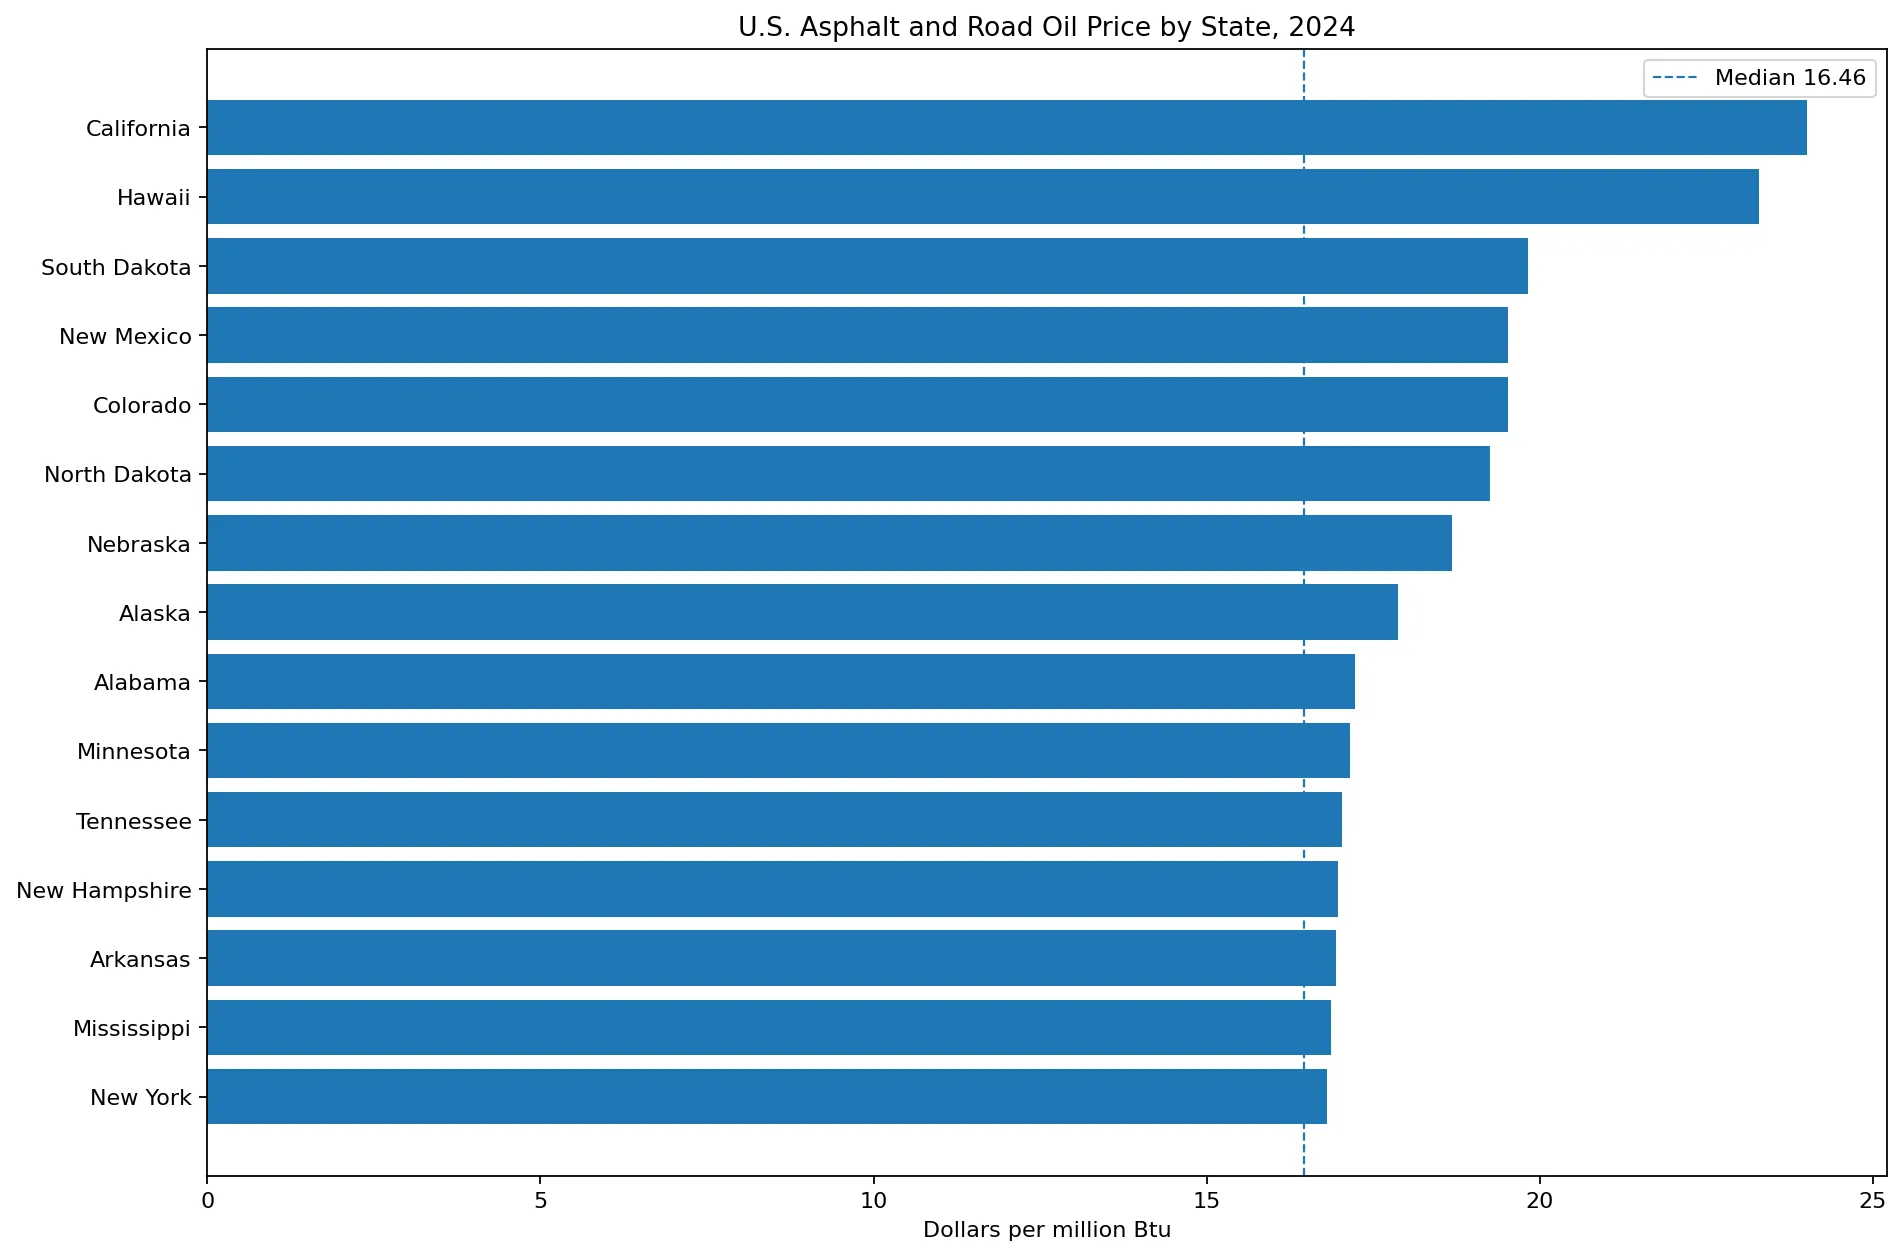
Table of Contents
What the asphalt and road oil price measures
SEDS places asphalt and road oil in the industrial sector. EIA explains that the products are used primarily for road construction, with other uses including roofing, sealing, and waterproofing materials. The price concept focuses on asphalt binder or asphalt cement used in road construction. That makes it different from consumer gasoline, heating oil, diesel, or other petroleum prices that are observed through fuel retail markets.
Taxes are treated differently as well. EIA states that SEDS asphalt prices exclude taxes because street and highway paving is commonly performed under contracts for state, county, and other public authorities that are typically exempt from paying those taxes. A direct comparison with another petroleum product should therefore first check whether the other price includes taxes and whether it refers to the same transaction level.
For 2009 forward, SEDS develops state physical-unit asphalt prices from individual state departments of transportation. EIA calculates a simple average of reported weekly or monthly prices to estimate the annual state price. When a state does not report a price, SEDS assigns an average based on neighboring states according to its technical methodology. Not every observation should therefore be interpreted as an independently observed, transaction-weighted state market price.
California and Hawaii are the two highest-price jurisdictions
California leads at $24.01/MMBtu and Hawaii is second at $23.29. South Dakota follows at $19.82, while Colorado and New Mexico both record $19.53. North Dakota is at $19.26 and Nebraska at $18.69. Only California and Hawaii exceed $20/MMBtu, creating a visible separation from the rest of the distribution.
California is $7.55 above the national state median and $9.75 above Arizona, the lowest state observation. The maximum is about 1.68 times the minimum. That range is not extraordinarily wide compared with some fuel-price series, but asphalt binder is an important input to paving work, so sustained regional price differences can still matter for construction budgets and contract escalation formulas.
The state values by themselves do not identify why California or Hawaii is high. Transportation costs, refinery supply, crude and heavy-product markets, contract structures, specifications, and regional procurement practices may all matter in specific markets. A causal explanation would require state DOT price bulletins, bid data, and supply-chain information beyond this state comparison.
Arizona is the lowest state value
Arizona records $14.26/MMBtu, followed by Oregon at $14.71 and Indiana at $14.80. Missouri and Montana are both at $15.03, New Jersey at $15.09, Michigan at $15.13, Wisconsin at $15.24, and Connecticut at $15.30. These observations form the lower tail of the 2024 distribution.
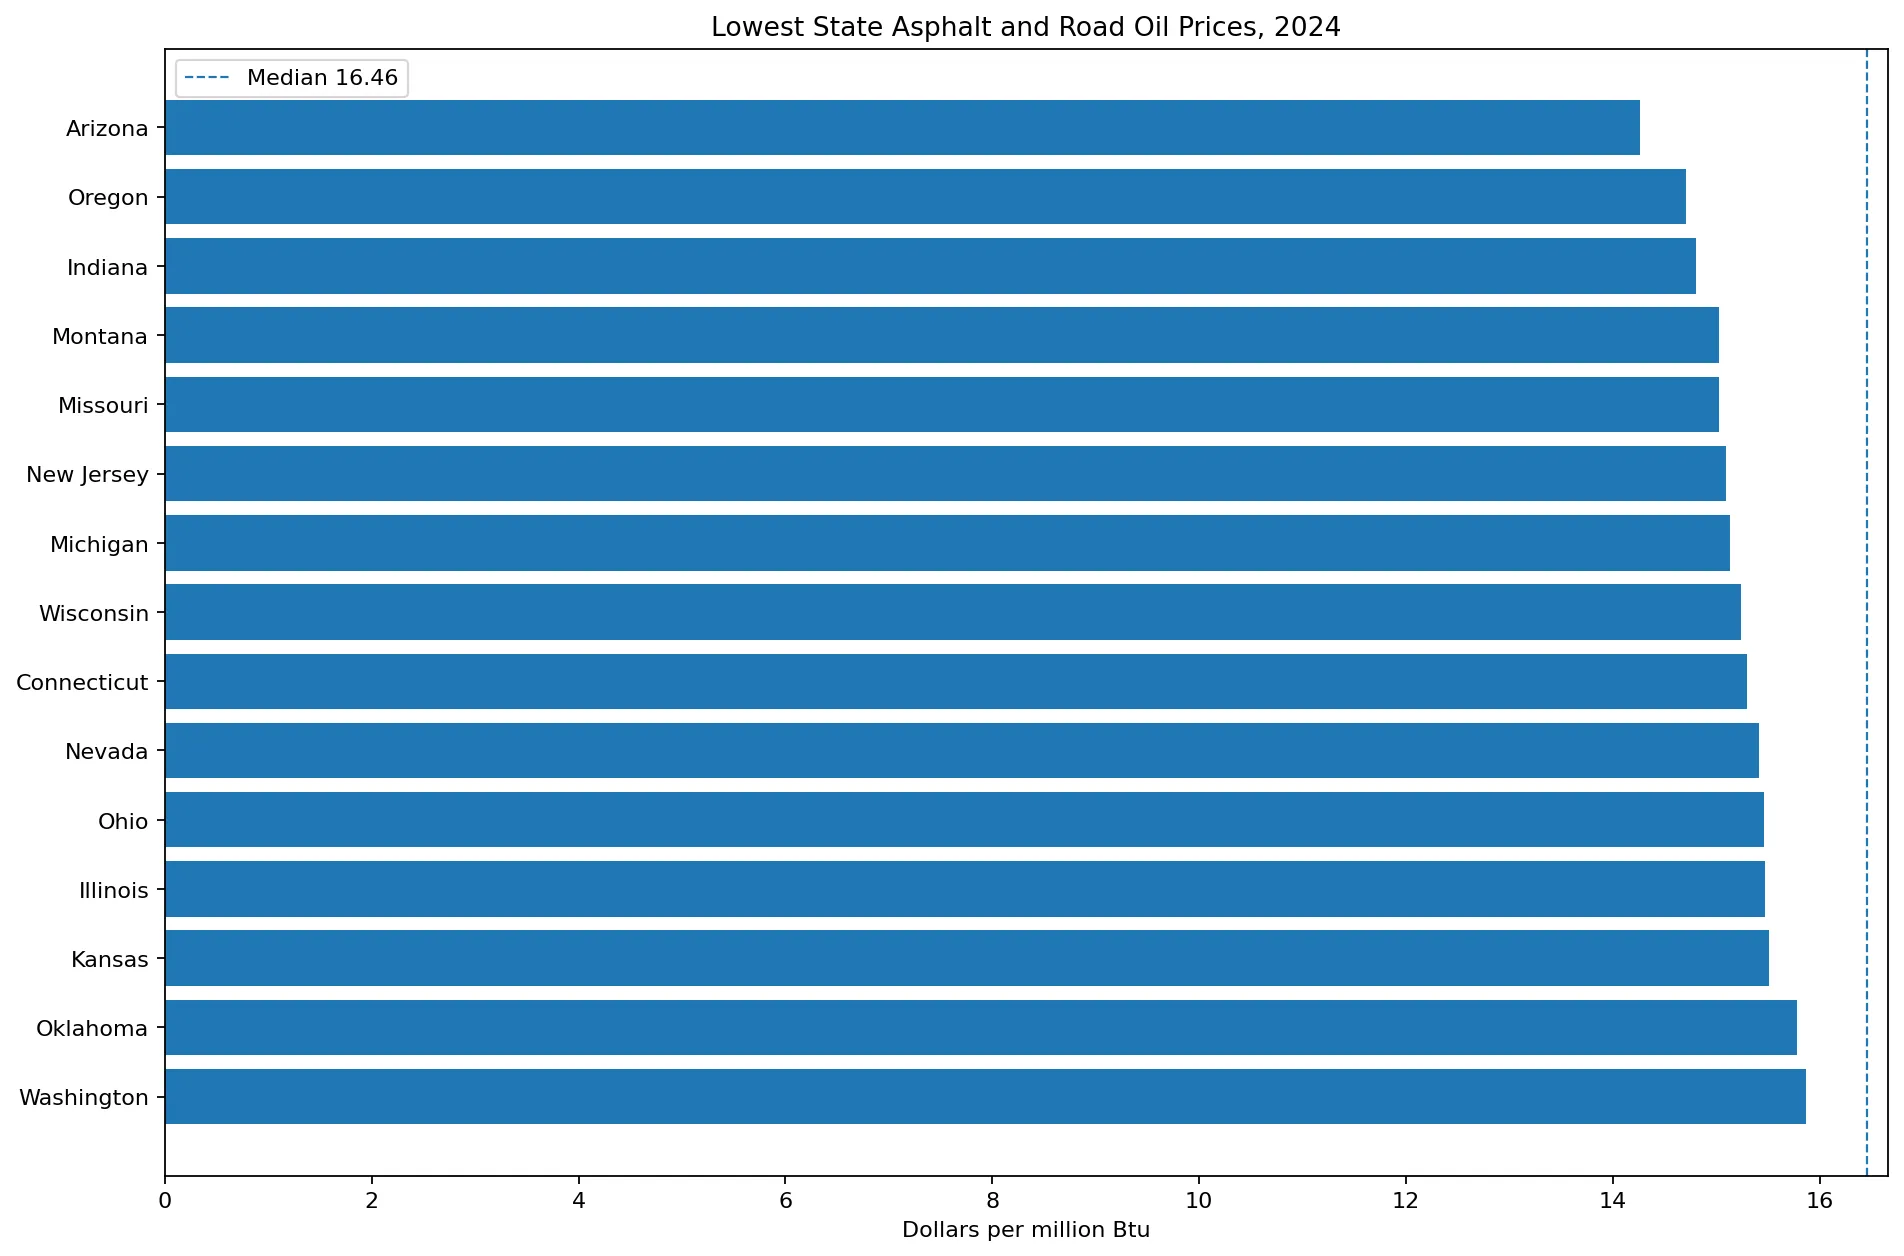
A low asphalt price should not be turned into a ranking of total road-building cost. Paving projects also depend on aggregate, labor, equipment, haul distance, mix design, project scale, specifications, and contract terms. The EIA series isolates the asphalt and road oil price component in an energy-statistics framework. It is useful context, but it is not a complete construction-cost index.
Most jurisdictions cluster around $15 to $17 per million Btu
The median is $16.46/MMBtu and the middle half of the 51 observations lies between about $15.65 and $16.91. The full range extends to $24.01 only because a small number of observations sit well above the central cluster. Most jurisdictions are much closer together than the minimum-to-maximum spread suggests.
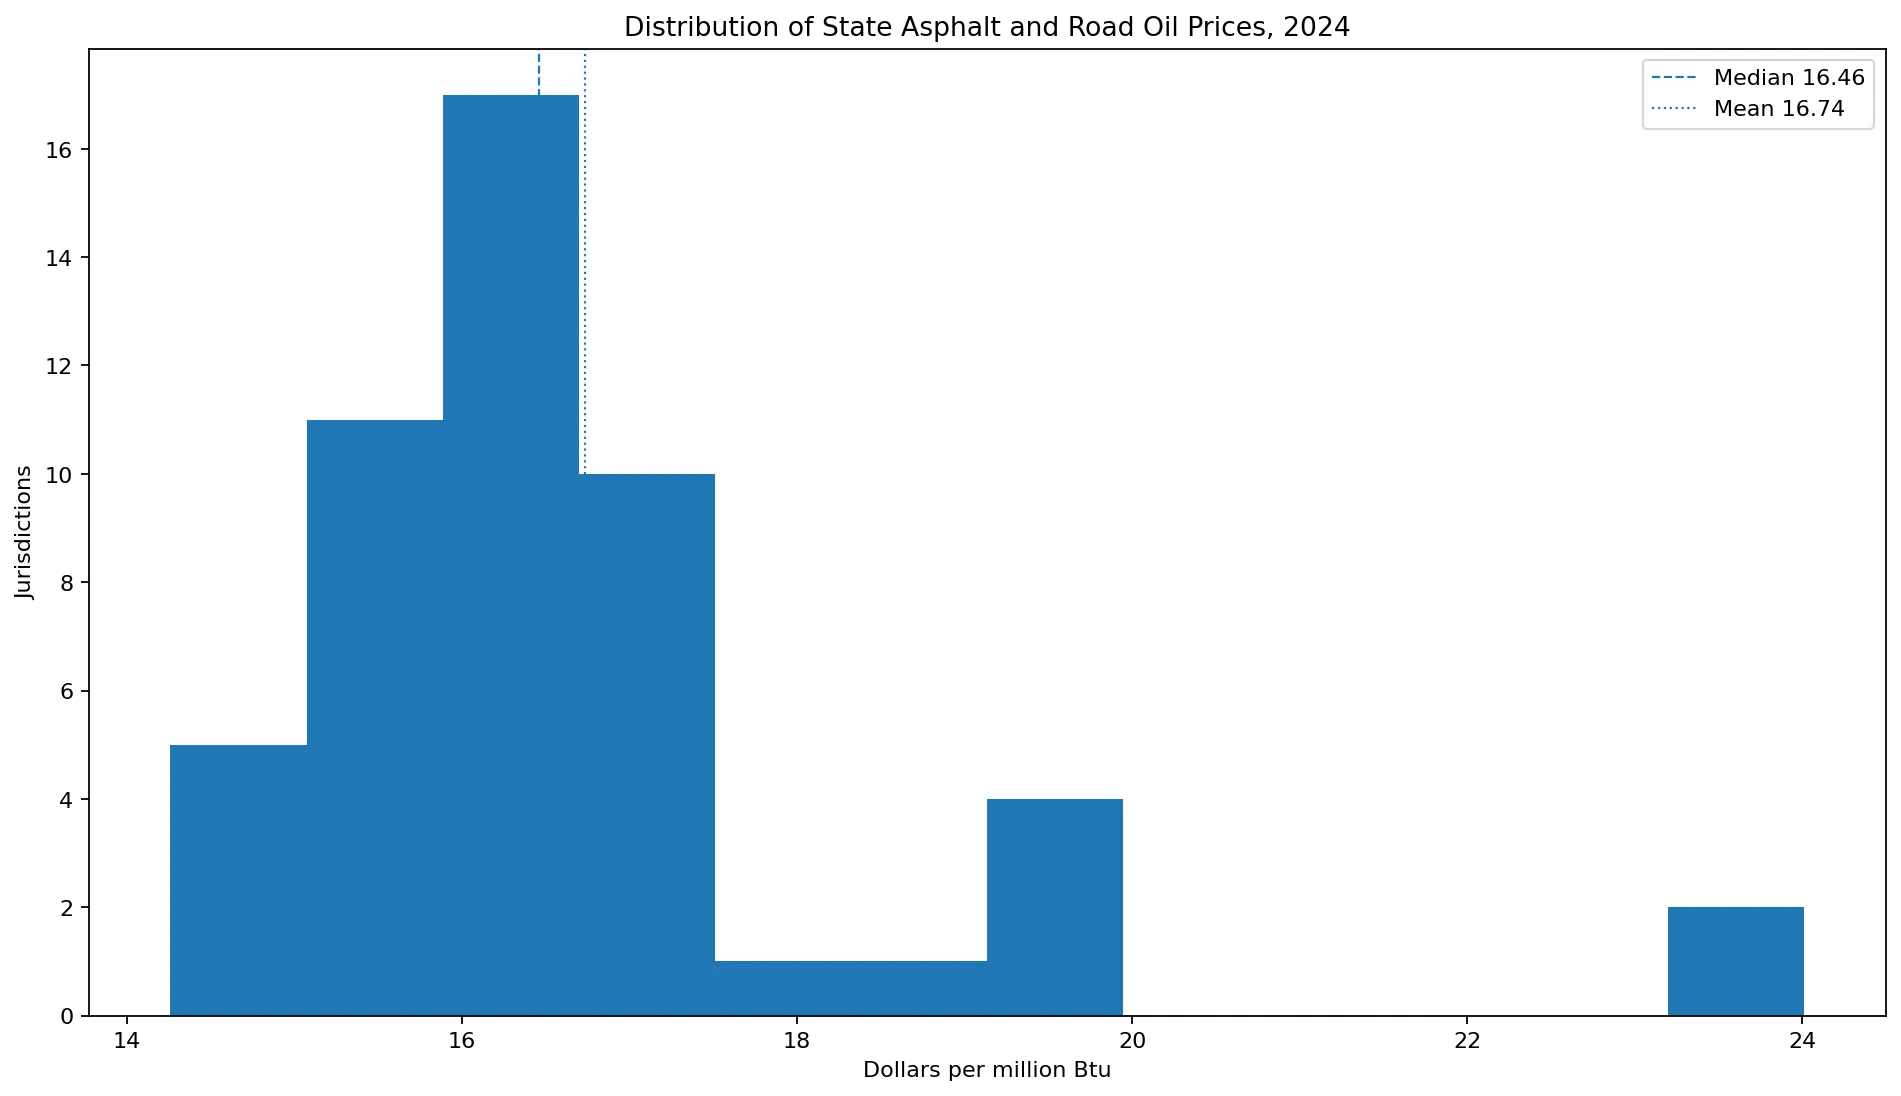
The mean of $16.74 is only modestly above the median, but the direction of the difference reflects the high-price tail. For describing the center of the state distribution, the median and interquartile range are often more informative than the mean alone. They show that a typical jurisdiction is much closer to $16 than to the two high outliers above $23.
Why the state ranking should not be treated as a precise market league table
SEDS is designed to provide a consistent state energy system, not a real-time asphalt trading screen. The underlying price data come primarily from state DOT publications. EIA uses simple averages of weekly or monthly reported prices, and states without direct reports can be assigned neighboring-state averages. Very small differences between adjacent states in the ranking therefore should not be interpreted as evidence of a meaningful competitive advantage.
The price bulletin itself may also represent the type of binder index used in public paving contracts rather than every transaction in a state. Private construction, specialty products, localized freight, and project-specific grades can differ. The SEDS series is strongest for broad geographic comparison and consistent annual tracking under a documented methodology.
Price and consumption answer different questions
A high-price state does not necessarily consume a large amount of asphalt. SEDS estimates state asphalt and road oil consumption through a different procedure. For recent years, U.S. total asphalt consumption is allocated to states using measures such as hot-mix and warm-mix asphalt production, excluding reclaimed asphalt pavement. The state price is developed from DOT price information. Because the two pieces come from different statistical procedures, their rankings need not move together.
Expenditure introduces a third dimension because it combines consumption and price. A state can have a moderate price but high total spending if it uses a large volume of asphalt. Conversely, a high-price state can have smaller total expenditures if its consumption is limited. The price map should not be used as a substitute for market size or infrastructure investment.
Why the unit is dollars per million Btu
Asphalt and road oil can be measured in barrels, tons, or other physical units, but SEDS also expresses energy prices in dollars per million Btu to maintain a common energy-accounting framework. MMBtu means one million British thermal units. Energy-normalized prices allow cross-fuel comparisons that would be difficult if every product remained in a different physical unit.
For construction procurement, however, physical-unit prices can be more directly relevant. A paving contract may use a per-ton binder index or another project-specific unit. Converting the EIA $/MMBtu figure into a contract price requires the appropriate heat content and product specification. The figures here should therefore be used as SEDS energy-price observations, not quoted as bid prices.
The ranked curve highlights the two upper outliers
When all 51 jurisdictions are sorted from high to low, California and Hawaii stand clearly above the main body of the distribution. South Dakota, Colorado, New Mexico, and North Dakota form the next group in the $19 range. The curve then becomes much flatter through the large group of jurisdictions clustered around $16.
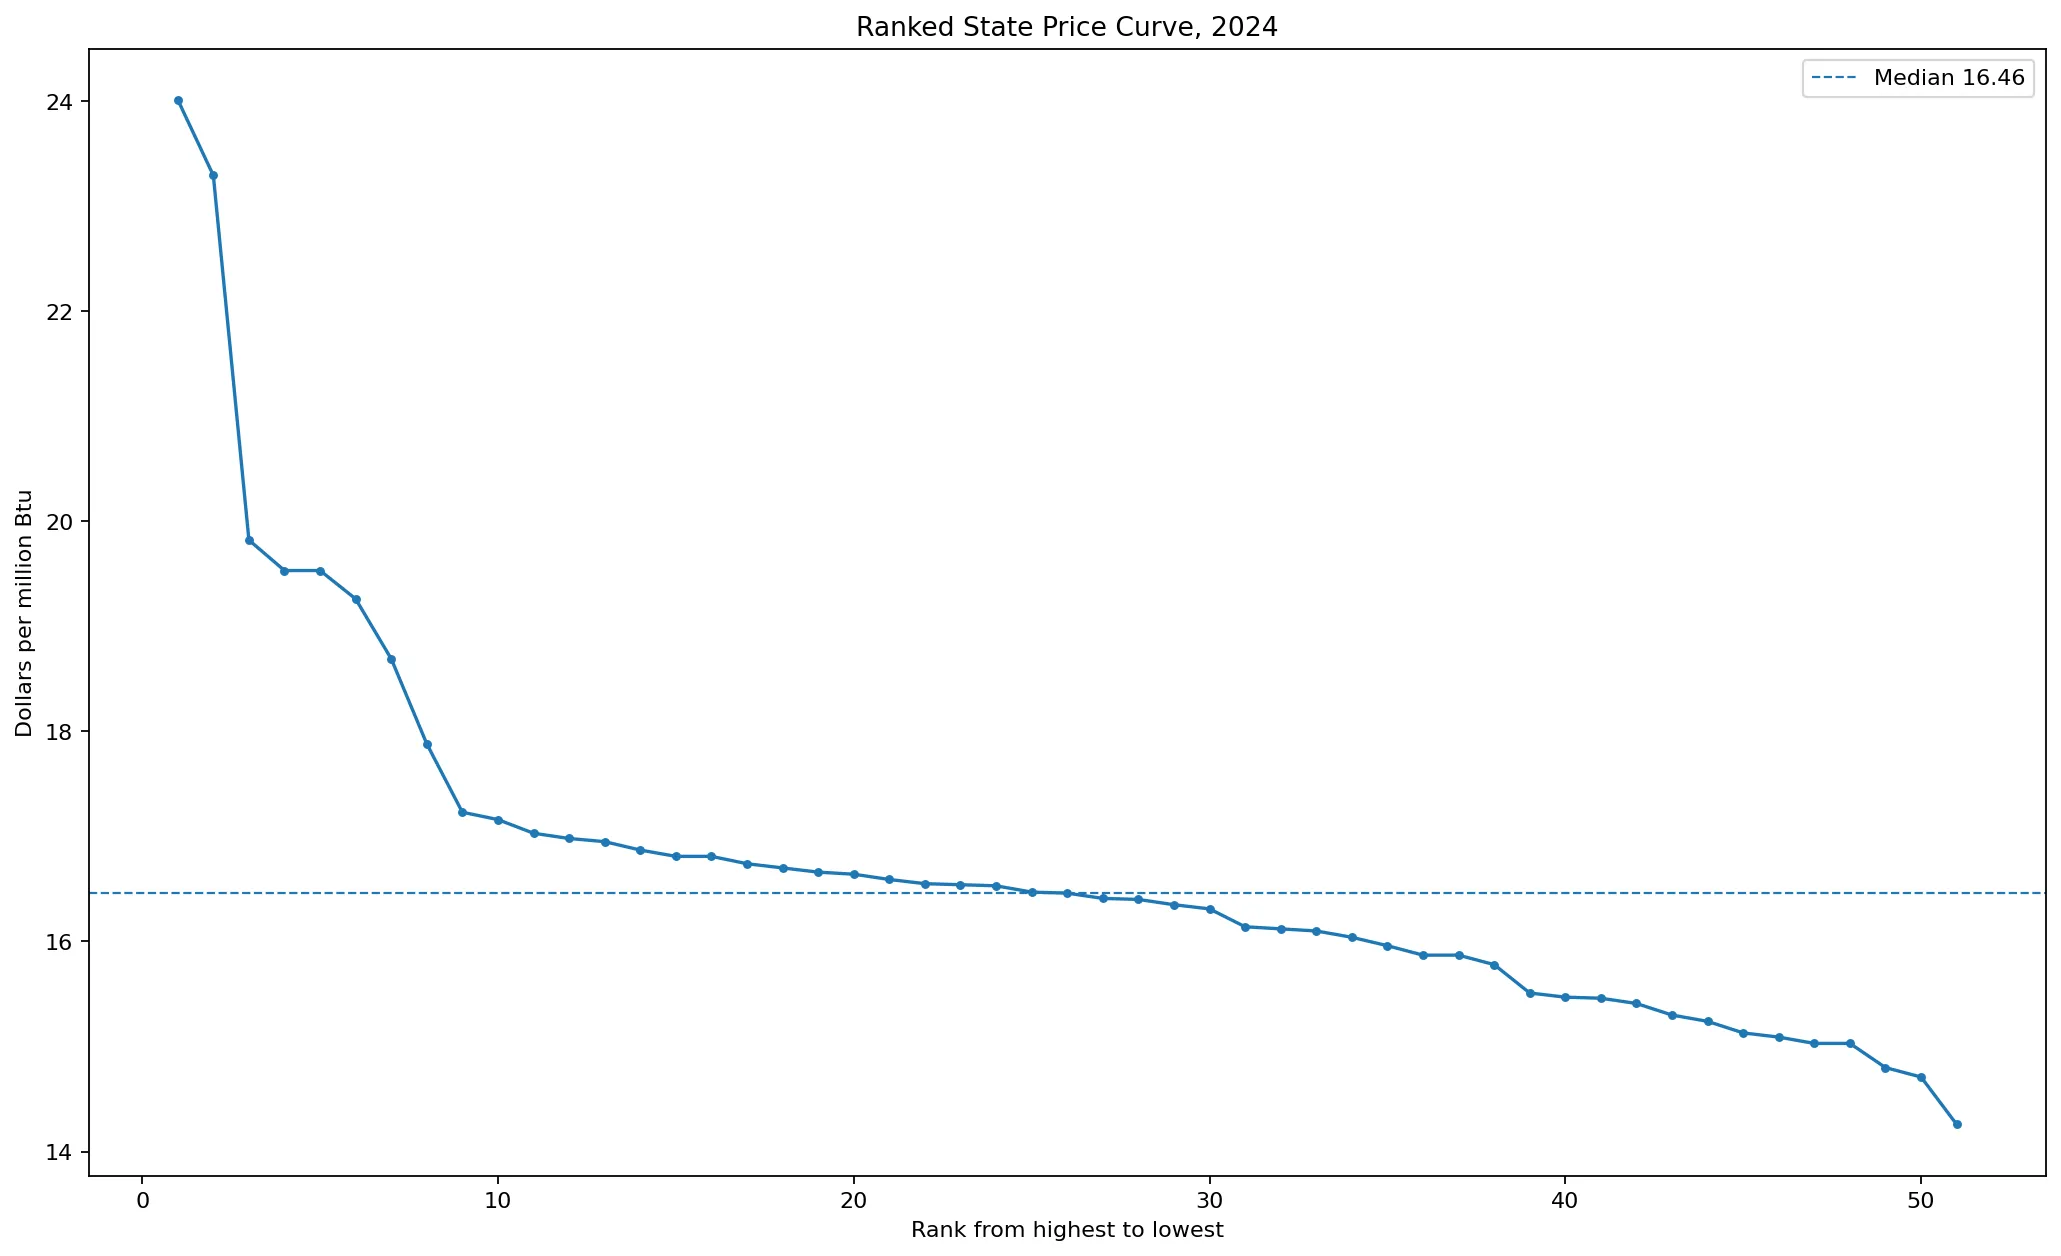
That shape is a reminder not to overstate tiny changes in rank. Moving a few cents can shift a state several places in the middle of a tightly packed distribution without representing a major economic change. Price bands and year-over-year movements are often more useful than exact ordinal rank when the differences are small.
Official EIA references
EIA Table F18 presents 2024 state estimates for asphalt and road oil consumption, prices, expenditures, and carbon dioxide emissions. The SEDS Prices and Expenditures technical documentation explains the asphalt and road oil price methodology, including DOT sources, annual averaging, tax treatment, and neighboring-state assignments. These methodological notes are essential for interpreting close state differences.
All 51 jurisdictions in 2024
The table below lists the 50 states and the District of Columbia from the highest to the lowest 2024 price. Every jurisdiction has a positive price observation in this dataset, and the unit is dollars per million Btu.
| Rank | State | Code | Year | $/MMBtu |
|---|---|---|---|---|
| 1 | California | CA | 2024 | 24.01 |
| 2 | Hawaii | HI | 2024 | 23.29 |
| 3 | South Dakota | SD | 2024 | 19.82 |
| 4 | Colorado | CO | 2024 | 19.53 |
| 5 | New Mexico | NM | 2024 | 19.53 |
| 6 | North Dakota | ND | 2024 | 19.26 |
| 7 | Nebraska | NE | 2024 | 18.69 |
| 8 | Alaska | AK | 2024 | 17.88 |
| 9 | Alabama | AL | 2024 | 17.23 |
| 10 | Minnesota | MN | 2024 | 17.16 |
| 11 | Tennessee | TN | 2024 | 17.03 |
| 12 | New Hampshire | NH | 2024 | 16.98 |
| 13 | Arkansas | AR | 2024 | 16.95 |
| 14 | Mississippi | MS | 2024 | 16.87 |
| 15 | New York | NY | 2024 | 16.81 |
| 16 | Vermont | VT | 2024 | 16.81 |
| 17 | Iowa | IA | 2024 | 16.74 |
| 18 | Maine | ME | 2024 | 16.70 |
| 19 | Kentucky | KY | 2024 | 16.66 |
| 20 | Idaho | ID | 2024 | 16.64 |
| 21 | Louisiana | LA | 2024 | 16.59 |
| 22 | Maryland | MD | 2024 | 16.55 |
| 23 | Rhode Island | RI | 2024 | 16.54 |
| 24 | Massachusetts | MA | 2024 | 16.53 |
| 25 | District of Columbia | DC | 2024 | 16.47 |
| 26 | South Carolina | SC | 2024 | 16.46 |
| 27 | Florida | FL | 2024 | 16.41 |
| 28 | Virginia | VA | 2024 | 16.40 |
| 29 | Utah | UT | 2024 | 16.35 |
| 30 | Georgia | GA | 2024 | 16.31 |
| 31 | Wyoming | WY | 2024 | 16.14 |
| 32 | North Carolina | NC | 2024 | 16.12 |
| 33 | West Virginia | WV | 2024 | 16.10 |
| 34 | Pennsylvania | PA | 2024 | 16.04 |
| 35 | Texas | TX | 2024 | 15.96 |
| 36 | Delaware | DE | 2024 | 15.87 |
| 37 | Washington | WA | 2024 | 15.87 |
| 38 | Oklahoma | OK | 2024 | 15.78 |
| 39 | Kansas | KS | 2024 | 15.51 |
| 40 | Illinois | IL | 2024 | 15.47 |
| 41 | Ohio | OH | 2024 | 15.46 |
| 42 | Nevada | NV | 2024 | 15.41 |
| 43 | Connecticut | CT | 2024 | 15.30 |
| 44 | Wisconsin | WI | 2024 | 15.24 |
| 45 | Michigan | MI | 2024 | 15.13 |
| 46 | New Jersey | NJ | 2024 | 15.09 |
| 47 | Missouri | MO | 2024 | 15.03 |
| 48 | Montana | MT | 2024 | 15.03 |
| 49 | Indiana | IN | 2024 | 14.80 |
| 50 | Oregon | OR | 2024 | 14.71 |
| 51 | Arizona | AZ | 2024 | 14.26 |
Frequently Asked Questions
Which state had the highest asphalt and road oil price in 2024?
California was highest at $24.01/MMBtu, followed by Hawaii at $23.29.
Which state had the lowest price?
Arizona was lowest at $14.26/MMBtu. Oregon followed at $14.71 and Indiana at $14.80.
Why is asphalt and road oil assigned to the industrial sector?
EIA SEDS assigns all consumption to the industrial sector because these products are used mainly in construction activity, especially road construction.
Are all state prices direct transaction averages?
No. EIA uses state DOT weekly or monthly prices where available, but some states can receive averages based on neighboring states under the SEDS methodology.
Related Articles
Green Map creates custom-edited map images using open geographic data sources such as geoBoundaries, Natural Earth, OpenStreetMap, and government open data. These maps are edited visual materials, not raw data files, and are provided for education, documents, presentations, and graphic reference.