Renewable energy input by independent power producers varied sharply across U.S. jurisdictions in 2024. In the EIA Electric Power Operational Data series defined by fueltypeid=AOR, sectorid=94 and total-consumption-btu, Texas recorded 555.824 million MMBtu, or 25.03% of the sum of 51 state-level observations. California followed with 310.010 million MMBtu and Oklahoma ranked third. The measure is not electricity output. It represents the heat-equivalent renewable energy input used by independent power producers for electricity generation and useful thermal output.
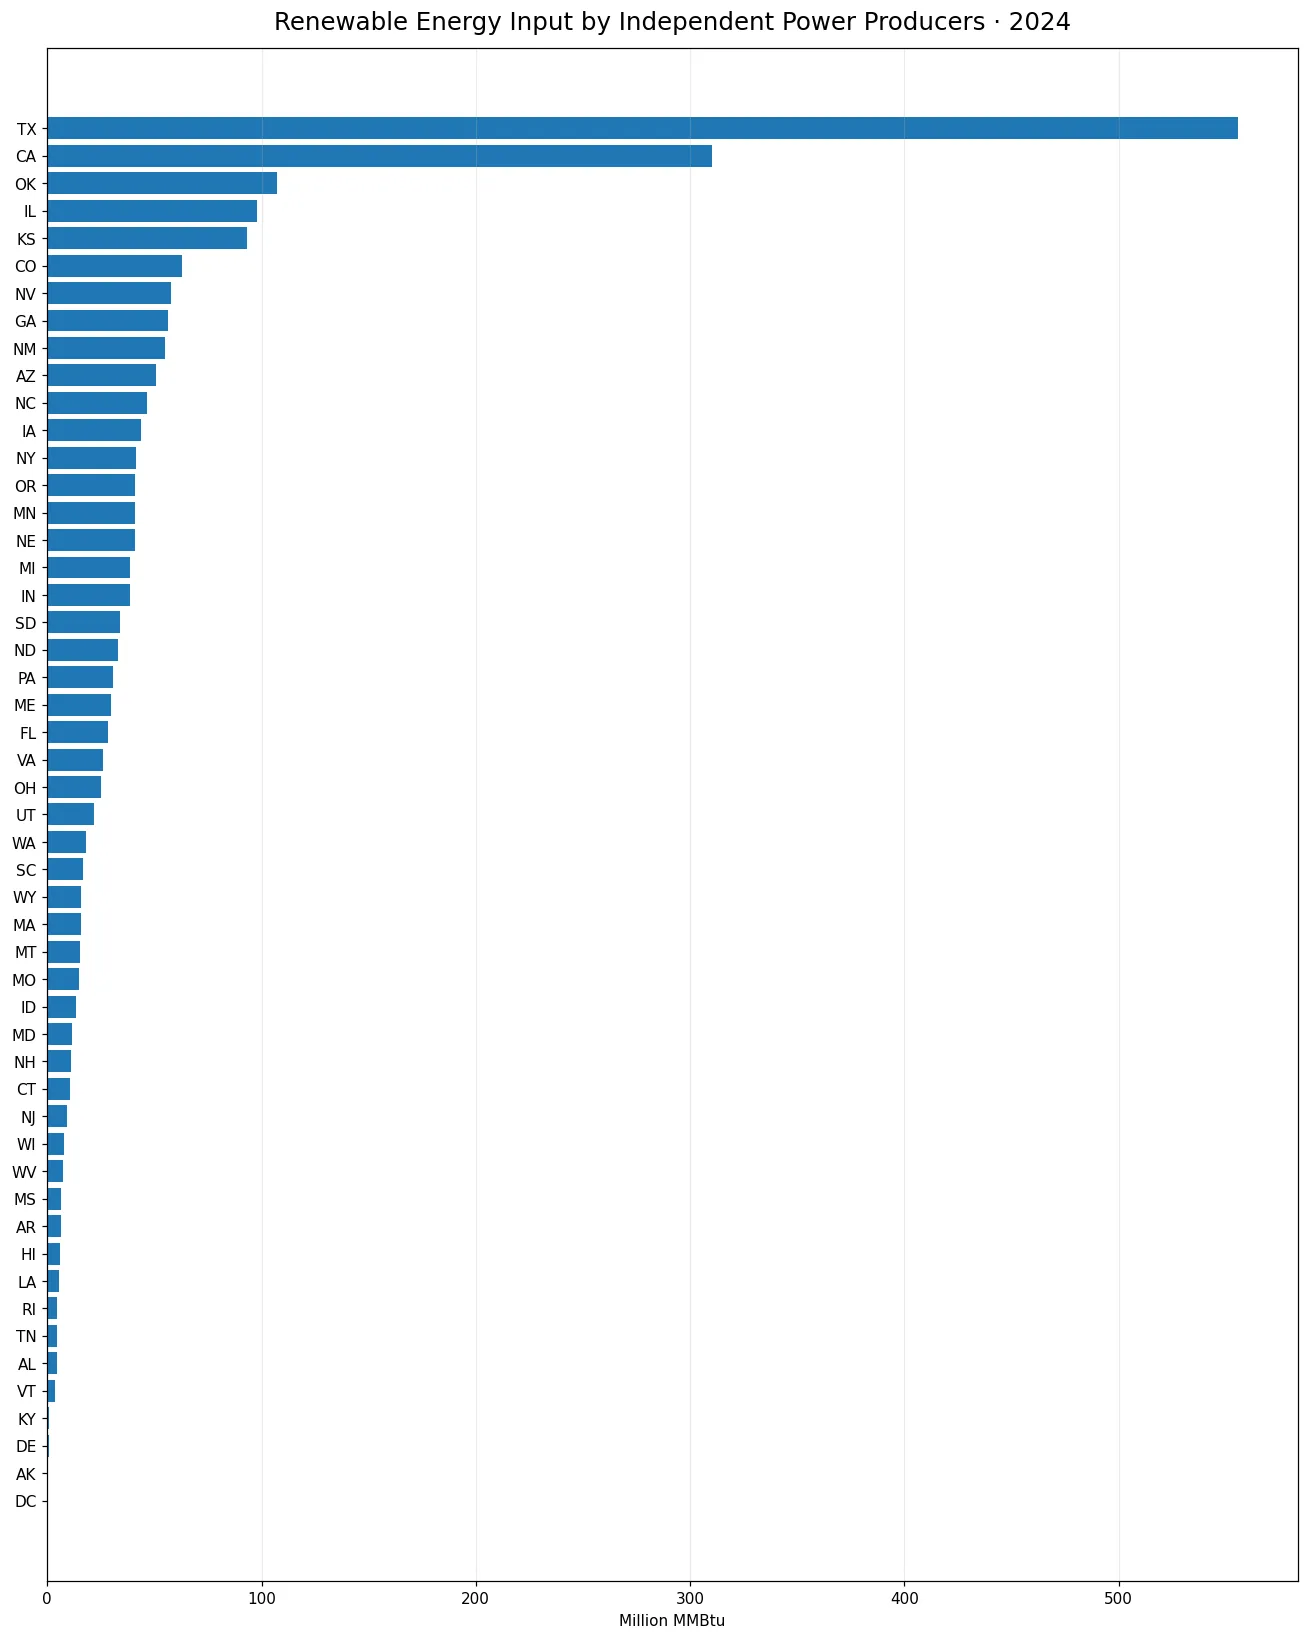
Table of Contents
What the EIA series measures
This series reports fuel energy consumption on a common heat-content basis. The AOR fuel facet represents all renewables within the EIA classification used for this operational dataset, while sector 94 restricts the observations to Independent Power Producers. The field total-consumption-btu includes energy used for electricity generation as well as energy assigned to useful thermal output where applicable. That scope is narrower than all U.S. energy consumption but broader than the companion field that isolates fuel input for electricity generation only.
Using million MMBtu allows energy from different renewable sources to be expressed on one energy basis even when their original physical units differ. That makes state-level totals comparable within this specific EIA series. It does not reveal the contribution of each renewable source, however. A high total can reflect different combinations of renewable technologies and operating patterns, so the AOR aggregate should not be read as a statement about one particular fuel or technology.
Texas and California dominated the 2024 distribution
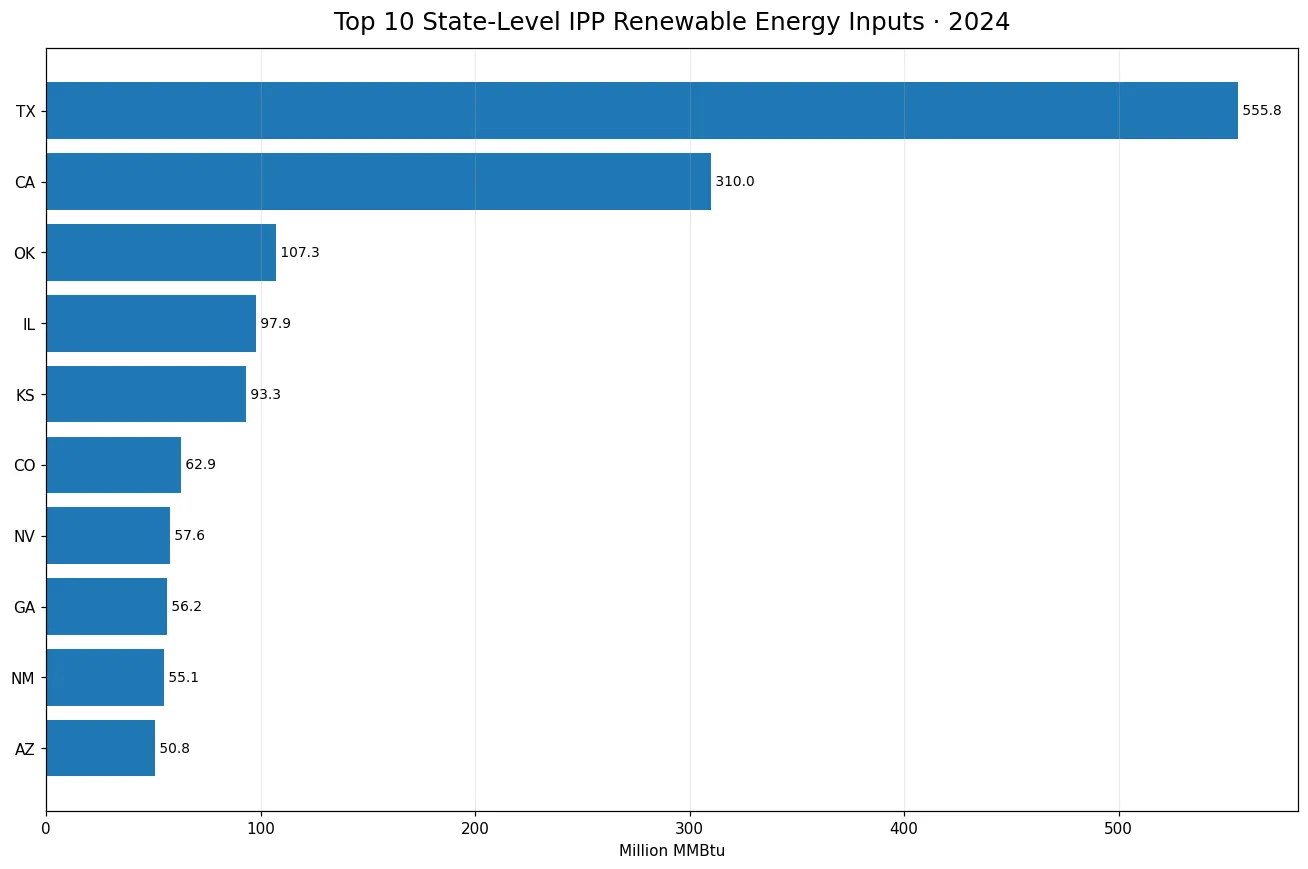
The 51-jurisdiction sum was 2,220.372 million MMBtu. Texas contributed 555.824 million MMBtu, equal to 25.03% of that sum. California contributed 310.010 million MMBtu, or 13.96%. Together, the two states represented 38.99% of the observed total. Oklahoma ranked third at 107.281 million MMBtu. The three leading states together accounted for 43.83%, showing that the state-level distribution was concentrated rather than even.
Illinois followed at 97.923 million MMBtu and Kansas at 93.287. Colorado, Nevada, Georgia, New Mexico and Arizona completed the top 10. The ranking describes the renewable energy input recorded for independent power producers, not the size of an entire state electricity market. Utility ownership structures and the role of independent generators differ by state, so the sector boundary matters when comparing otherwise similar-looking energy statistics.
The top 10 jurisdictions held nearly two-thirds of the observed input
The top 10 jurisdictions accounted for 65.17% of the 51-jurisdiction sum. The median was 21.883 million MMBtu, well below the mean of 43.537 million MMBtu. That gap between mean and median is consistent with a right-skewed distribution in which a few very large observations raise the average. For a typical-state perspective, the median therefore provides useful context alongside the national-style sum and the leading-state shares.
The difference within the top tier is also substantial. Texas was more than five times Oklahoma, and California was far above the third-ranked state as well. Showing all 51 observations on one chart reveals the full spread, while a separate top-10 view makes the spacing among the leading states easier to read. Both views are useful because a single ranking can hide how far apart neighboring positions actually are.
Every jurisdiction had a positive reported value
All 50 states and the District of Columbia had positive observations in this 2024 slice. There were no missing values and no reported zeros. The smallest value was the District of Columbia at 0.10291 million MMBtu, while Alaska recorded 0.20820. Small positive observations were retained exactly as reported rather than rounded to zero. Because all 51 jurisdictions were present, the state-level sum did not require imputation or an adjustment for missing regions.
A positive value does not imply that every jurisdiction has the same renewable technologies or the same scale of independent generation. AOR is an aggregate category, and the composition behind each state total can differ materially. The result should therefore be read as evidence that some renewable energy input was recorded for sector 94 in every jurisdiction, not as proof of uniform renewable capacity, output, or market structure.
Total consumption is broader than generation-only fuel input
The distinction between total-consumption-btu and consumption-for-eg-btu is important. The generation-only field measures fuel energy used specifically to produce electricity. Total consumption can also include fuel energy assigned to useful thermal output. In facilities that produce both electricity and useful heat, the two measures can differ even when the same fuel and sector are selected. Treating them as interchangeable would blur an important part of the EIA accounting structure.
This series also differs from an ALL-fuels IPP total. Here the fuel facet is AOR, so the values represent the renewable portion of the sector 94 energy-input accounting. Calculating a renewable share of all IPP fuel use would require a matching ALL-fuels series with the same year, sector and field. Mixing a different year or a generation-only field into that denominator would create a ratio whose components do not describe the same scope.
State differences should be interpreted with sector structure in mind
Texas and California clearly had the largest renewable energy inputs in this sector, but the observations alone do not establish why. Plant capacity, utilization, renewable-resource mix, power-market organization and the presence of cogeneration or useful-thermal operations can all affect the reported totals. None of those causal variables is directly measured by this single state series, so the analysis is limited to the observed geographic pattern instead of attributing it to one policy or technology.
Further analysis could separate the AOR aggregate into more specific fuel categories, compare total-consumption-btu with consumption-for-eg-btu, and place the energy input next to net generation for the same sector. Those comparisons can help distinguish fuel composition, generation-only input and useful-thermal activity. The present view is intentionally narrower: it establishes the 2024 state distribution for one precisely defined renewable-energy input measure.
MMBtu is an input measure, not electricity generation
MMBtu is a unit of energy content. Electricity output is usually reported in megawatt-hours, and the two measures answer different questions. More energy input does not automatically translate into proportionally more electricity because technologies, conversion conventions and operating conditions differ. That caution is especially relevant for an aggregate renewable category, where the EIA uses energy accounting methods that allow unlike renewable sources to appear in a common Btu-based series.
For that reason, this ranking is not an efficiency ranking. Estimating efficiency would require an output measure aligned with the same facilities and scope, plus careful treatment of the conversion conventions applied to renewable generation. The state values here should be used to compare the scale of recorded renewable energy input within independent power producers, not to infer generation efficiency, electricity prices, emissions, or profitability.
Year and sector must remain aligned in comparisons
EIA operational data contain many series with nearly identical names. Changing only the sector from 94 to 98 can move the scope from Independent Power Producers to the broader Electric Power category. Changing the field from total consumption to generation-only consumption changes what part of the energy input is counted. A valid time comparison should keep fueltypeid=AOR, sectorid=94 and total-consumption-btu fixed while changing only the year.
The 2024 observations are a snapshot rather than a long-term trend. A state that ranks highly in one year may move later as generation assets, operating conditions, hydrology, renewable buildout or market participation change. A trend claim therefore needs multiple years under the same definition. This article does not assume that the 2024 ordering will persist beyond the observed period.
Shares were calculated from the same 51 comparable observations
Each state share was calculated by dividing its published value by the sum of the 51 observations, 2,220.372 million MMBtu. Texas therefore represented 25.03% and California 13.96% of the state-level sum. These percentages are descriptive calculations for the geographic distribution; they should not be presented as a separately published EIA national-share table. No missing value was replaced with zero and no estimated state value was introduced.
Absolute values remain important beside the percentages. A small percentage can still represent a meaningful amount of energy input, while a very large state can dominate the share calculation. Reading the total, median, state values and concentration measures together gives a more complete view than a rank alone. It also avoids turning a geographic comparison into an unsupported judgment about the broader quality of a state energy system.
Source and calculation method
The source is the annual U.S. Energy Information Administration Electric Power Operational Data series. The query definition is 2024, fueltypeid=AOR, sectorid=94 and data=total-consumption-btu, with values reported in million MMBtu. The analysis covers all 50 states and the District of Columbia. Rankings use the published state observations, and the sum, mean, median and concentration shares are calculated from those same observations without imputation.
The official source is U.S. Energy Information Administration Electric Power Operational Data. EIA can revise historical observations, so a later retrieval under the same definition may differ slightly. Comparisons with other EIA series should first align fuel, sector, field and year so that changes in scope are not mistaken for changes in energy use.
Frequently Asked Questions
Which state had the largest IPP renewable energy input in 2024?
Texas ranked first at 555.824 million MMBtu, equal to 25.03% of the sum of the 51 state-level observations.
What does total-consumption-btu include?
It represents total fuel energy input for electricity generation and useful thermal output within the selected fuel and sector. It is broader than consumption-for-eg-btu, which isolates generation-only input.
Does a higher energy-input value necessarily mean more renewable electricity generation?
No. Energy input and electricity output are different measures, and their relationship depends on technology, accounting conventions, operating conditions and the renewable mix.
Related Articles
Green Map creates custom-edited map images using open geographic data sources such as geoBoundaries, Natural Earth, OpenStreetMap, and government open data. These maps are edited visual materials, not raw data files, and are provided for education, documents, presentations, and graphic reference.