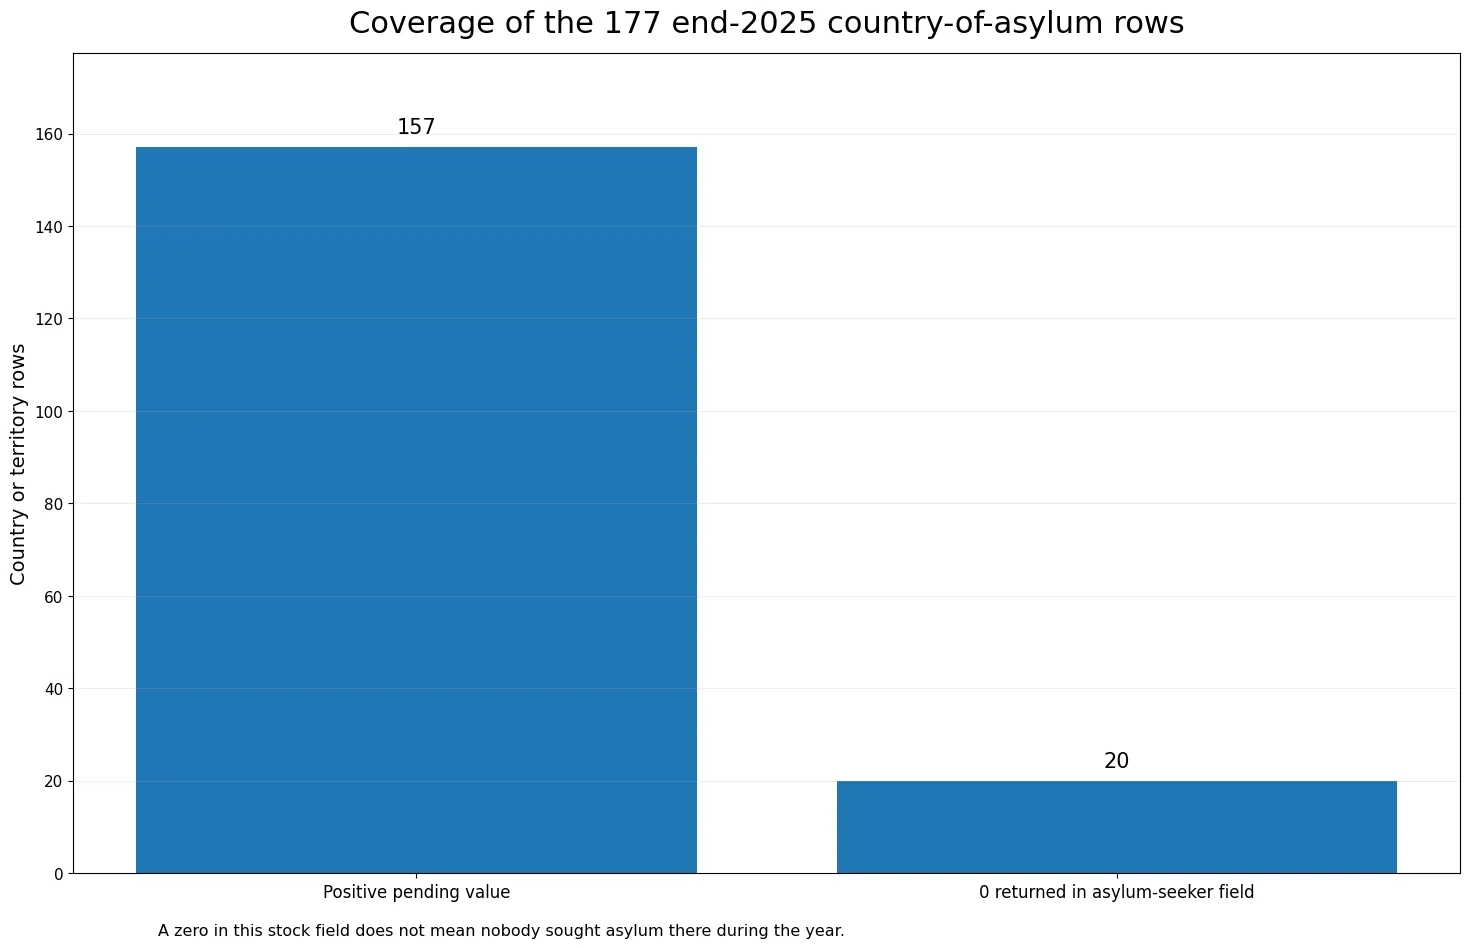
At the end of 2025, an asylum-seeker in UNHCR population statistics was a person who had sought international protection and whose claim for refugee status had not yet been determined. The figures here are organized by country or territory of asylum, meaning the place where the person was seeking protection, not the person’s country of origin. The extract contains 177 country or territory rows: 157 have a positive asylum-seeker value and 20 return zero. Together they sum to 8,998,097 people, essentially the same scale as UNHCR’s rounded global headline of 9 million asylum-seekers at the end of 2025.
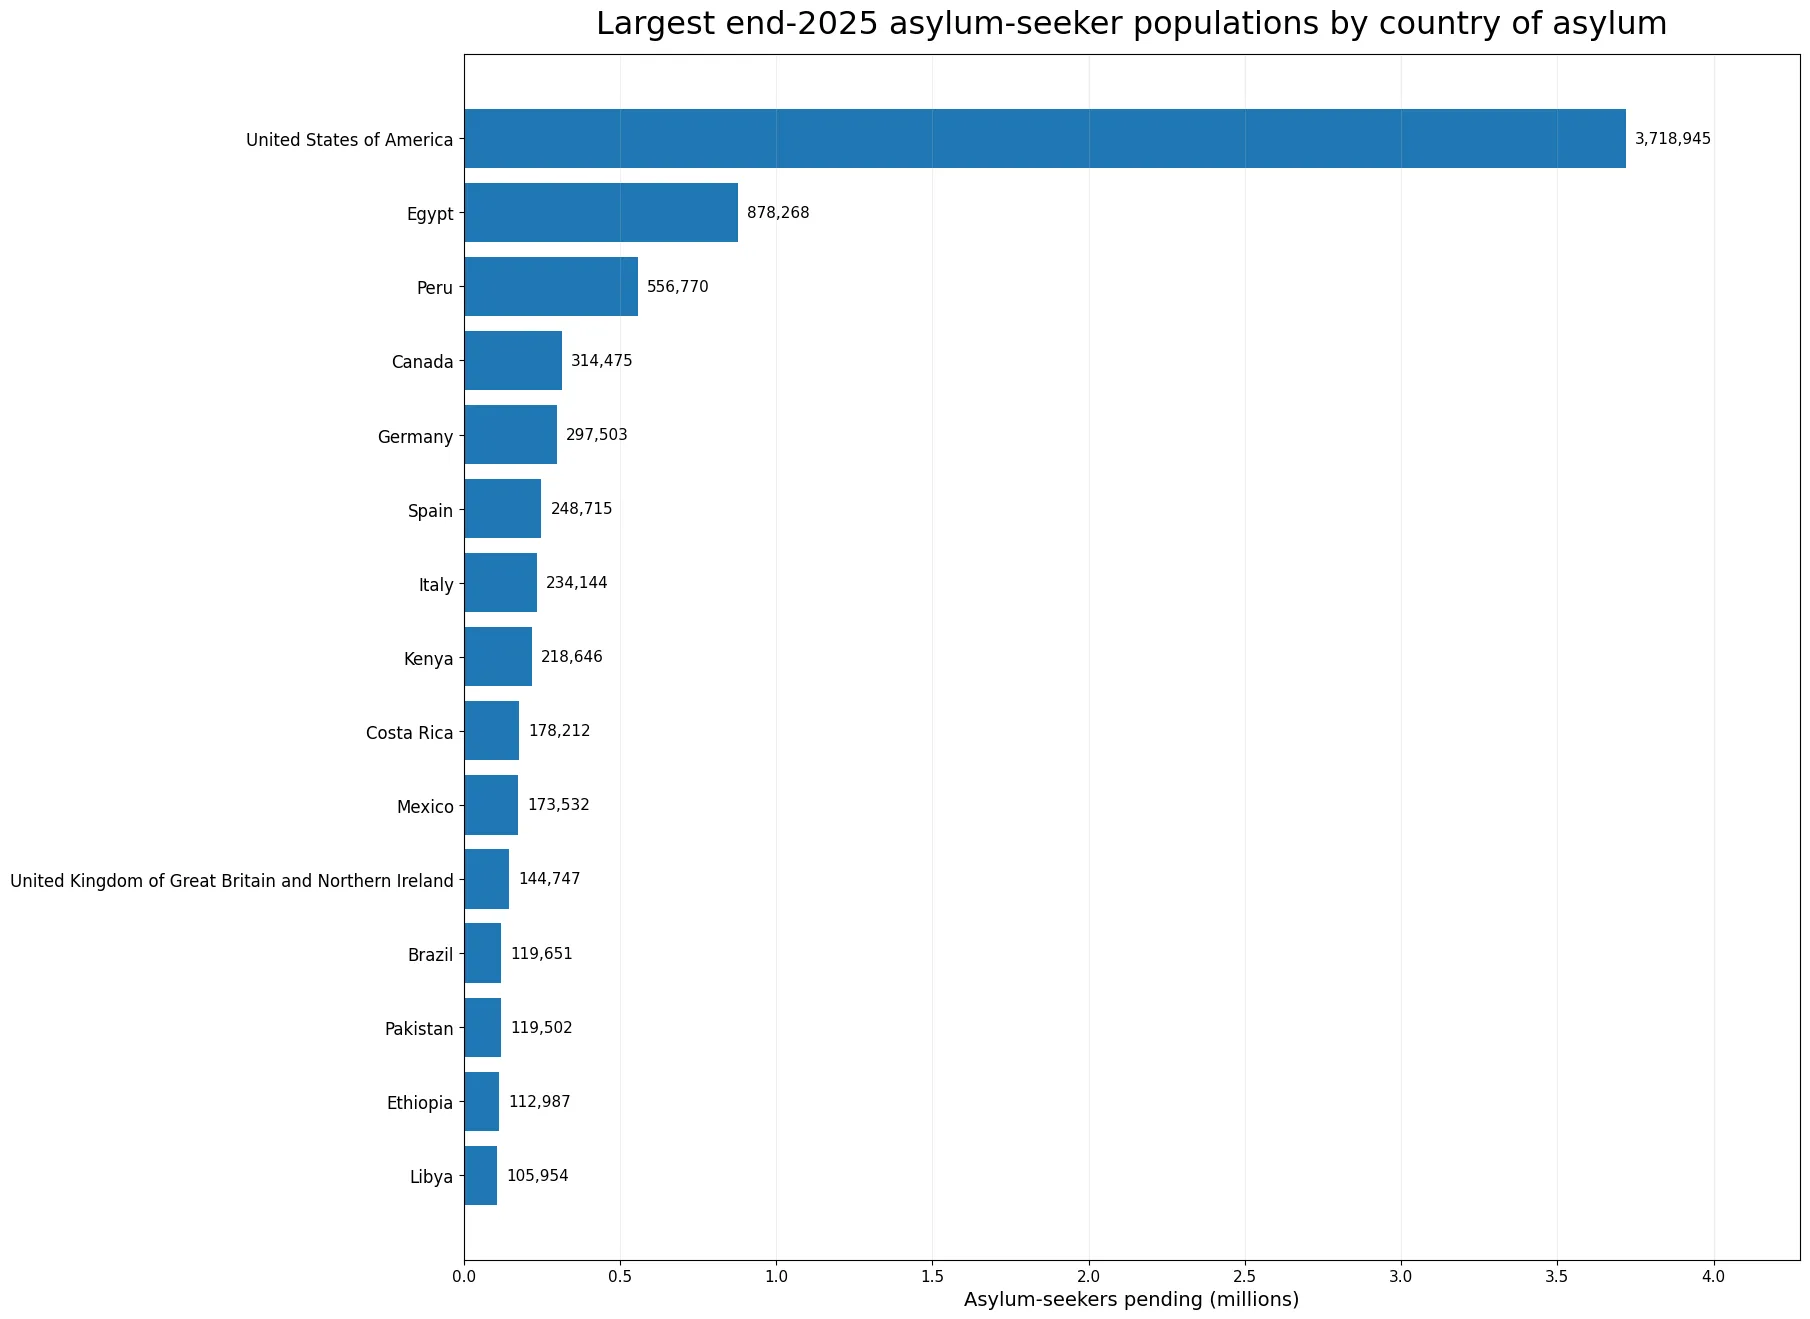
The distribution is highly concentrated. The United States of America records 3,718,945 asylum-seekers pending, about 41.3% of the extract total. Egypt follows with 878,268, Peru with 556,770, Canada with 314,475, and Germany with 297,503. The top five rows account for about 64.1% of the total and the top ten for 75.8%. These are not counts of new applications filed during 2025. They are an end-of-year stock of people whose asylum claims were still pending.
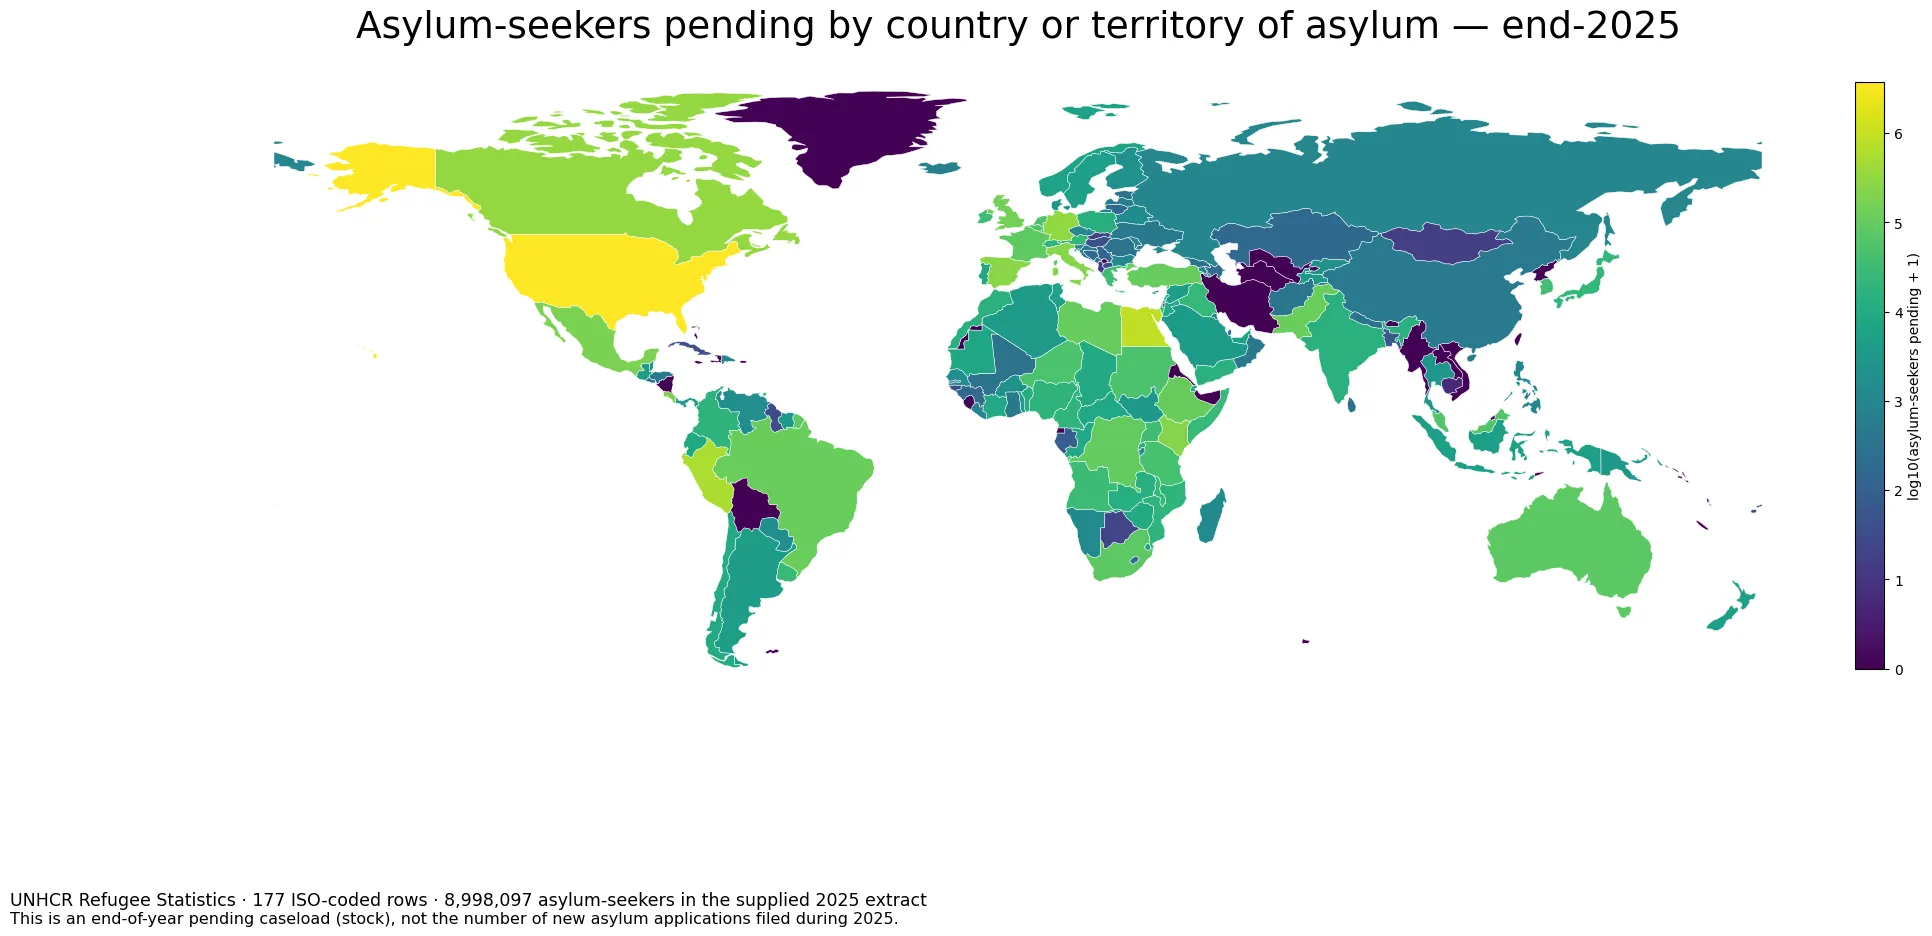
Table of Contents
What this asylum-seeker statistic actually counts
UNHCR’s statistical definition describes asylum-seekers as people who have sought international protection and whose refugee-status claims have not yet been determined. A person may later be recognized as a refugee or receive another protection status, or a claim may ultimately be rejected. The asylum-seeker category therefore represents a procedural stage. It is not the same as the refugee population, the number of people crossing a border, or the number of people who submitted a new application during the calendar year.
The Refugee Data Finder methodology keeps asylum-seekers, refugees, and other people in need of international protection as distinct statistical categories. That distinction matters when comparing host countries. A large pending caseload does not by itself mean a country recognized more refugees, received the largest number of new applications during the year, or operated a slower asylum system. The end-year balance is shaped by applications entering the system, decisions leaving it, legal reviews, transfers into other protection categories, and revisions to administrative records.
A small number of host countries account for most of the pending stock
The five largest country-of-asylum rows contain 5,765,961 people, or about 64.1% of all 177 rows. The top ten contain 6,819,210, equivalent to 75.8%, while the top fifteen reach 7,422,051, or 82.5%. The United States alone contributes more than 3.7 million pending asylum-seekers and strongly affects the global distribution. That is why the arithmetic mean of the 177 rows, roughly 50,837, is far above the median of 1,836.
The highest rows are geographically diverse. North America and Europe are prominent, but Egypt, Peru, Kenya, Costa Rica, Mexico, Brazil, Pakistan, Ethiopia and Libya also appear among the larger host-country caseloads. The pattern cannot be reduced to one income group or one region. Geography, conflict-driven routes, established communities, access to asylum procedures, visa and border policies, and national processing systems can all shape where people have claims pending at year end. The dataset shows the resulting distribution, but it does not identify a single cause for each country’s value.
Pending stock is different from new asylum applications
Two measures that sound similar answer different questions. A pending stock asks how many people were still recorded as asylum-seekers at a particular date, such as the end of December. New applications are a flow: how many claims or applicants entered the asylum process during a period. A country can register many applications during a year yet show a smaller increase in the end-year stock if it also completes many decisions. The reverse is possible when unresolved cases from earlier years remain in the system.
This distinction also means that the 2025 map should not be described as a map of “who applied in 2025.” Some of the people counted at the end of the year may have lodged claims earlier. Likewise, people who applied during 2025 but received a final decision before year end may no longer be in the asylum-seeker stock. To assess processing capacity or changes in asylum pressure, the stock should be read together with applications, decisions, recognition outcomes and processing-time statistics.
How to interpret the 20 rows that return zero
Twenty of the 177 country or territory rows return zero in the 2025 asylum-seeker field. Those values come from the source data; missing observations were not converted to zero for the analysis. Even so, a zero end-year stock is not identical to saying that nobody sought asylum there during 2025. Applications may have been decided before the reference date, another protection mechanism may have been used, or national reporting and statistical classifications may differ.
The cautious wording is therefore “zero returned in this end-2025 asylum-seeker field.” A single zero cannot be used to infer the absence of irregular movement, temporary protection, earlier claims, or other forms of international protection. This is especially important when the map is used outside a time-series context. The end-year stock is a snapshot, and snapshots can change sharply when backlogs are cleared, large new movements occur, or statistical systems are revised.
The distribution has a very long upper tail
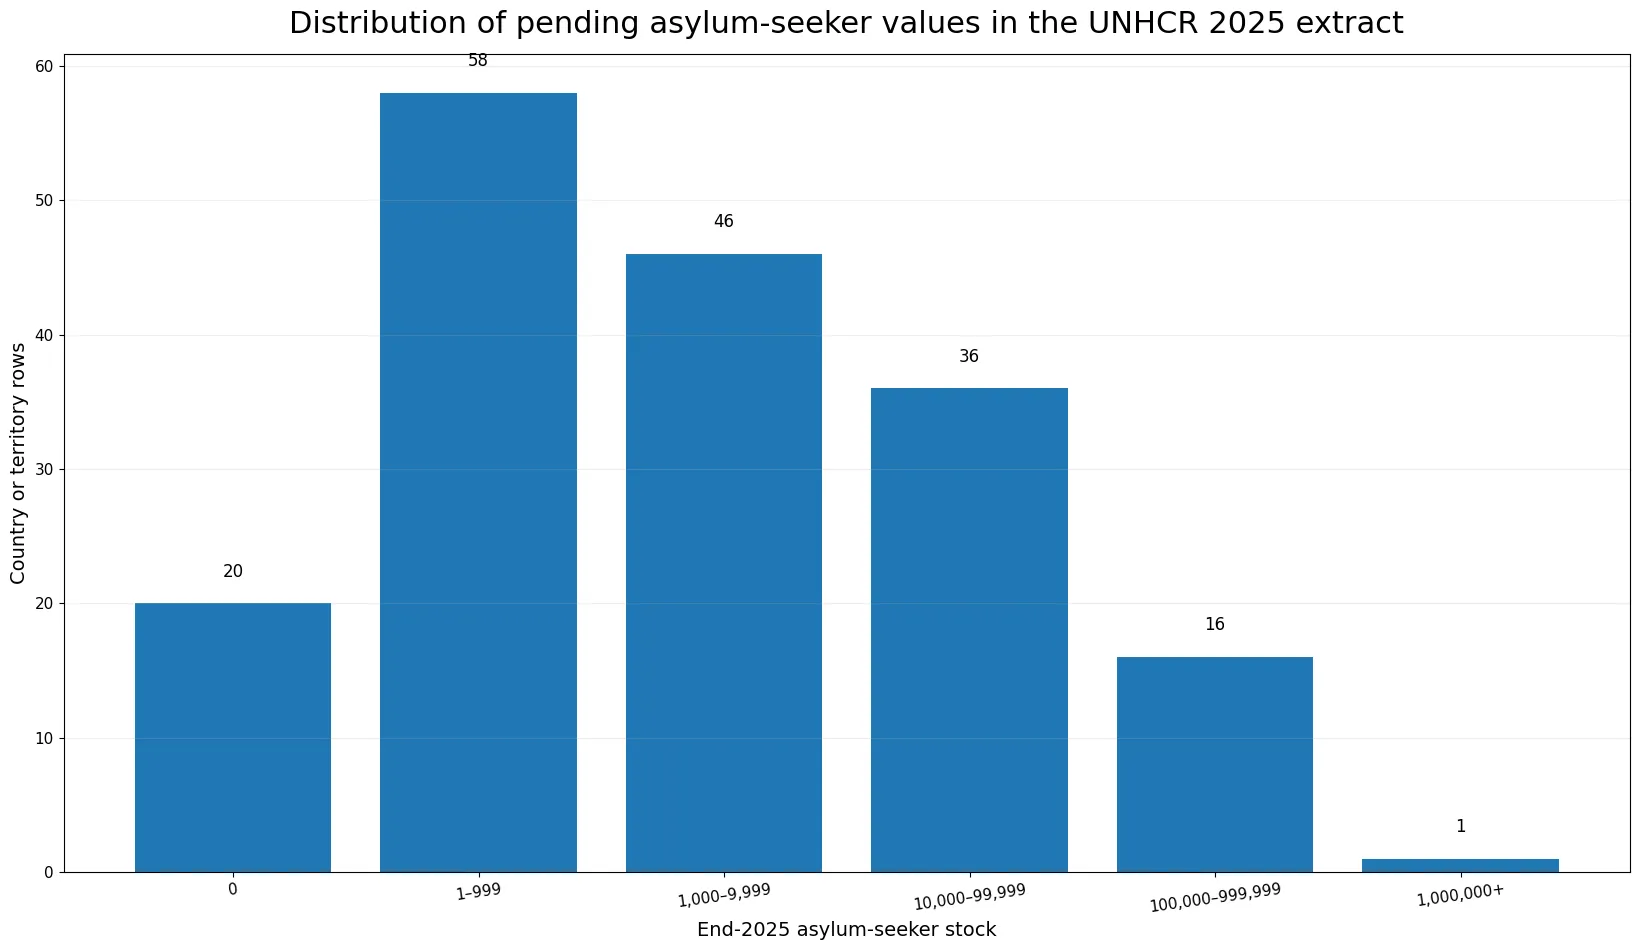
By value band, 20 rows are zero, 58 are between 1 and 999, 46 are between 1,000 and 9,999, 36 are between 10,000 and 99,999, 16 are between 100,000 and 999,999, and one exceeds one million. Among the 157 positive rows, the median is 3,246 and the mean is about 57,313. The gap between those two measures is another sign that a relatively small number of large host-country caseloads pull the average upward.
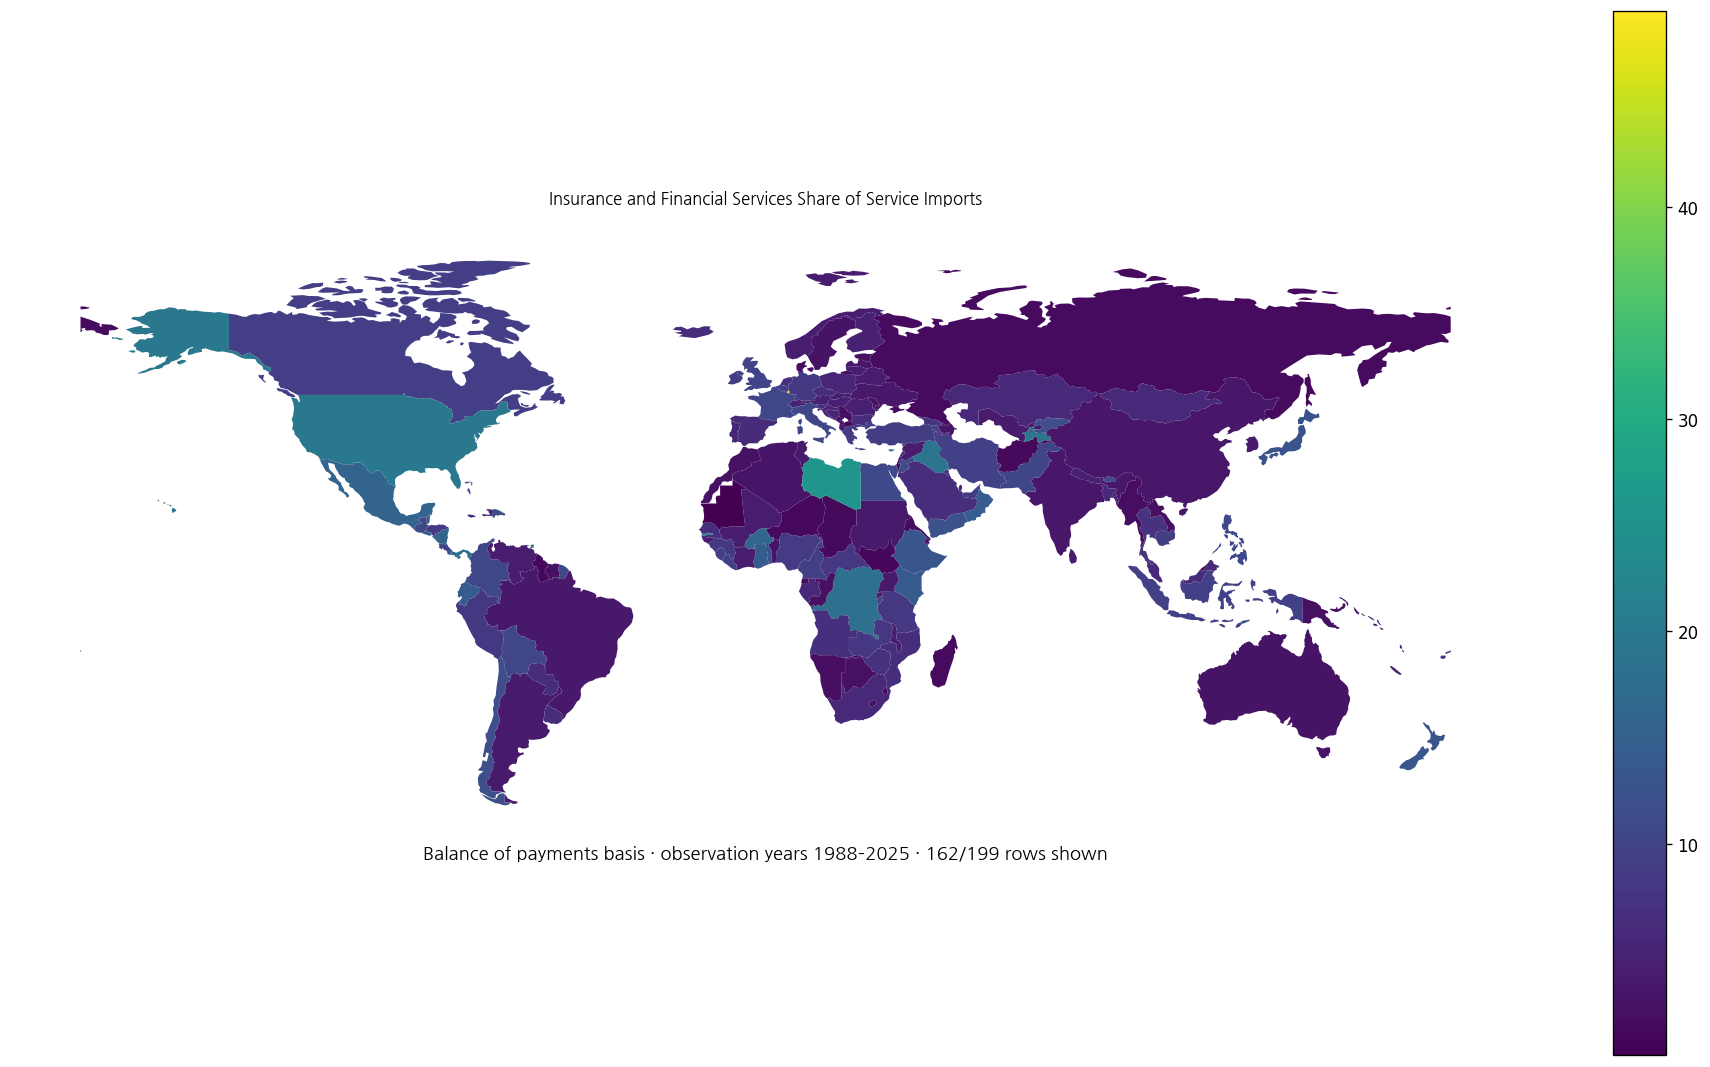
A conventional linear map would compress most of the lower and middle values into a narrow visual range. The featured map therefore applies a logarithmic transformation to the value used for color. This changes only the visual spacing, not the underlying counts. Countries with hundreds or thousands of pending asylum-seekers remain visible alongside countries with hundreds of thousands or millions. The full table below preserves the original integer values for direct comparison.
Country of asylum is not the same as country of origin
Asylum statistics can be mapped along two different geographic dimensions. A country-of-asylum view asks where people have pending protection claims. A country-of-origin view asks where those people came from. This dataset uses the first perspective because the population API query aggregates all countries of asylum. A large value for one host country therefore says nothing by itself about the nationality mix of the people counted there.
Both perspectives are useful, but for different questions. Host-country data are relevant to the scale of asylum administration and protection responsibilities. Origin-country data are more directly connected to the crises, persecution and rights conditions that drive people to seek protection abroad. Neither perspective, at country-total level, can establish the merits or likely outcome of an individual asylum claim.
All 177 country and territory rows for 2025
The table below retains all 177 rows and orders them from the largest end-year asylum-seeker value to the smallest. All observations refer to 2025, so there is no mixed-year comparison. Zero values are retained rather than removed. The ordering is a size comparison of pending caseloads, not a ranking of asylum policy, human-rights performance, administrative quality or generosity. Absolute counts should also be distinguished from population-adjusted rates, which answer a different question.
| Country or territory of asylum | Year | Asylum-seekers pending at year end |
|---|---|---|
| United States of America | 2025 | 3,718,945 |
| Egypt | 2025 | 878,268 |
| Peru | 2025 | 556,770 |
| Canada | 2025 | 314,475 |
| Germany | 2025 | 297,503 |
| Spain | 2025 | 248,715 |
| Italy | 2025 | 234,144 |
| Kenya | 2025 | 218,646 |
| Costa Rica | 2025 | 178,212 |
| Mexico | 2025 | 173,532 |
| United Kingdom of Great Britain and Northern Ireland | 2025 | 144,747 |
| Brazil | 2025 | 119,651 |
| Pakistan | 2025 | 119,502 |
| Ethiopia | 2025 | 112,987 |
| Libya | 2025 | 105,954 |
| Türkiye | 2025 | 102,497 |
| Dem. Rep. of the Congo | 2025 | 100,112 |
| France | 2025 | 85,227 |
| Australia | 2025 | 82,925 |
| South Africa | 2025 | 82,358 |
| Malaysia | 2025 | 63,011 |
| Belgium | 2025 | 58,725 |
| Sudan | 2025 | 50,147 |
| Niger | 2025 | 50,004 |
| Netherlands (Kingdom of the) | 2025 | 49,662 |
| United Rep. of Tanzania | 2025 | 43,262 |
| Rep. of Korea | 2025 | 39,106 |
| Uganda | 2025 | 35,249 |
| Ireland | 2025 | 33,728 |
| Greece | 2025 | 31,928 |
| Angola | 2025 | 30,261 |
| Israel | 2025 | 29,682 |
| Uruguay | 2025 | 27,288 |
| Somalia | 2025 | 25,702 |
| Malawi | 2025 | 25,251 |
| Trinidad and Tobago | 2025 | 23,369 |
| Iraq | 2025 | 23,366 |
| Cyprus | 2025 | 23,162 |
| Japan | 2025 | 22,647 |
| Austria | 2025 | 22,014 |
| Mozambique | 2025 | 18,972 |
| Cameroon | 2025 | 18,553 |
| Nigeria | 2025 | 18,192 |
| Colombia | 2025 | 17,421 |
| Switzerland | 2025 | 17,039 |
| Rwanda | 2025 | 15,251 |
| India | 2025 | 15,075 |
| Morocco | 2025 | 15,033 |
| Yemen | 2025 | 14,642 |
| Poland | 2025 | 13,848 |
| Zambia | 2025 | 12,906 |
| Benin | 2025 | 11,947 |
| Djibouti | 2025 | 10,141 |
| Chile | 2025 | 9,561 |
| Zimbabwe | 2025 | 9,495 |
| Chad | 2025 | 9,371 |
| Portugal | 2025 | 8,595 |
| Ecuador | 2025 | 8,571 |
| Central African Rep. | 2025 | 8,454 |
| Cote d'Ivoire | 2025 | 8,177 |
| Congo | 2025 | 8,109 |
| Jordan | 2025 | 8,068 |
| Lebanon | 2025 | 7,617 |
| Mauritania | 2025 | 7,378 |
| Norway | 2025 | 6,280 |
| United Arab Emirates | 2025 | 6,257 |
| Tunisia | 2025 | 5,523 |
| Indonesia | 2025 | 4,697 |
| Sweden | 2025 | 4,661 |
| New Zealand | 2025 | 4,584 |
| Togo | 2025 | 4,282 |
| Syrian Arab Rep. | 2025 | 4,144 |
| Panama | 2025 | 4,129 |
| Guatemala | 2025 | 4,088 |
| Argentina | 2025 | 3,941 |
| Saudi Arabia | 2025 | 3,907 |
| Algeria | 2025 | 3,690 |
| Eswatini | 2025 | 3,511 |
| South Sudan | 2025 | 3,246 |
| Tajikistan | 2025 | 3,238 |
| Suriname | 2025 | 3,191 |
| Papua New Guinea | 2025 | 3,121 |
| Luxembourg | 2025 | 3,050 |
| Thailand | 2025 | 2,880 |
| Denmark | 2025 | 2,738 |
| Kyrgyzstan | 2025 | 1,981 |
| Burkina Faso | 2025 | 1,957 |
| Finland | 2025 | 1,879 |
| Belize | 2025 | 1,836 |
| Paraguay | 2025 | 1,659 |
| Venezuela (Bolivarian Republic of) | 2025 | 1,577 |
| Senegal | 2025 | 1,538 |
| Belarus | 2025 | 1,470 |
| Burundi | 2025 | 1,466 |
| Malta | 2025 | 1,390 |
| Namibia | 2025 | 1,326 |
| Bulgaria | 2025 | 1,317 |
| Madagascar | 2025 | 1,279 |
| Dominican Rep. | 2025 | 1,029 |
| Armenia | 2025 | 998 |
| Czechia | 2025 | 993 |
| Russian Federation | 2025 | 976 |
| Philippines | 2025 | 942 |
| Liberia | 2025 | 725 |
| Slovenia | 2025 | 722 |
| Iceland | 2025 | 660 |
| Kuwait | 2025 | 611 |
| Rep. of Moldova | 2025 | 594 |
| Gambia | 2025 | 509 |
| Latvia | 2025 | 487 |
| China | 2025 | 482 |
| Ghana | 2025 | 475 |
| Ukraine | 2025 | 443 |
| Honduras | 2025 | 441 |
| Croatia | 2025 | 434 |
| Oman | 2025 | 414 |
| Afghanistan | 2025 | 382 |
| El Salvador | 2025 | 328 |
| Mali | 2025 | 322 |
| Estonia | 2025 | 321 |
| Romania | 2025 | 316 |
| Nepal | 2025 | 302 |
| Georgia | 2025 | 288 |
| Sri Lanka | 2025 | 271 |
| Mauritius | 2025 | 233 |
| Lesotho | 2025 | 202 |
| Azerbaijan | 2025 | 199 |
| Montenegro | 2025 | 175 |
| Guinea | 2025 | 172 |
| Bosnia and Herzegovina | 2025 | 164 |
| Kazakhstan | 2025 | 163 |
| Lithuania | 2025 | 156 |
| Qatar | 2025 | 153 |
| Sint Maarten (Dutch part) | 2025 | 141 |
| Serbia and Kosovo: S/RES/1244 (1999) | 2025 | 134 |
| Bahrain | 2025 | 122 |
| Nauru | 2025 | 92 |
| Gabon | 2025 | 86 |
| Bangladesh | 2025 | 67 |
| Hungary | 2025 | 42 |
| Cuba | 2025 | 40 |
| North Macedonia | 2025 | 38 |
| Liechtenstein | 2025 | 37 |
| Fiji | 2025 | 31 |
| Guinea-Bissau | 2025 | 30 |
| Guyana | 2025 | 29 |
| British Virgin Islands | 2025 | 26 |
| Botswana | 2025 | 21 |
| Slovakia | 2025 | 16 |
| Cayman Islands | 2025 | 15 |
| Mongolia | 2025 | 15 |
| Comoros | 2025 | 14 |
| Albania | 2025 | 11 |
| Barbados | 2025 | 8 |
| Vanuatu | 2025 | 7 |
| Cambodia | 2025 | 5 |
| Dominica | 2025 | 5 |
| Aruba | 2025 | 0 |
| Bahamas | 2025 | 0 |
| Bolivia (Plurinational State of) | 2025 | 0 |
| Brunei Darussalam | 2025 | 0 |
| Cabo Verde | 2025 | 0 |
| China, Hong Kong SAR | 2025 | 0 |
| Curacao | 2025 | 0 |
| Eritrea | 2025 | 0 |
| Haiti | 2025 | 0 |
| Iran (Islamic Rep. of) | 2025 | 0 |
| Monaco | 2025 | 0 |
| Myanmar | 2025 | 0 |
| Saint Kitts and Nevis | 2025 | 0 |
| Saint Lucia | 2025 | 0 |
| Sierra Leone | 2025 | 0 |
| Singapore | 2025 | 0 |
| Turkmenistan | 2025 | 0 |
| Turks and Caicos Islands | 2025 | 0 |
| Uzbekistan | 2025 | 0 |
| Viet Nam | 2025 | 0 |
Source and interpretation limits
The country values come from the UNHCR Refugee Statistics 2025 population API using country of asylum. UNHCR’s figures at a glance report approximately 9 million asylum-seekers globally at the end of December 2025, very close to the 8,998,097 sum of these 177 rows. The annual 2025 statistics and Global Trends 2025 were released on 11 June 2026.
UNHCR compiles forced-displacement statistics primarily from governments and its own operations. A common international framework makes cross-country comparison possible, but national procedures, registration systems and later revisions are not identical. This map is well suited to showing where pending asylum-seeker stocks were concentrated at the end of 2025. It should not be used alone to infer new application pressure, recognition rates, processing speed, individual protection needs or the overall quality of a national asylum system.
Frequently Asked Questions
Is an asylum-seeker the same as a refugee?
No. An asylum-seeker has sought international protection but has not yet received a final determination of refugee status. A person may later be recognized as a refugee or receive another outcome.
Which host country has the largest asylum-seeker value in this 2025 dataset?
The United States of America has the largest end-year value at 3,718,945, followed by Egypt, Peru, Canada and Germany.
Does this dataset count new asylum applications filed during 2025?
No. It is an end-of-year stock of people whose asylum claims were still pending. New applications are a separate flow measure.
Does a zero mean nobody sought asylum in that country during 2025?
Not necessarily. It is a zero in the end-year pending asylum-seeker field. Claims may have been resolved earlier or people may be recorded under another protection category.
Related Articles
Green Map creates custom-edited map images using open geographic data sources such as geoBoundaries, Natural Earth, OpenStreetMap, and government open data. These maps are edited visual materials, not raw data files, and are provided for education, documents, presentations, and graphic reference.