World Bank indicator TM.TAX.MRCH.WM.FN.ZS reports the import-weighted mean most-favored-nation tariff across all merchandise products. The latest non-empty dataset covers 188 countries and economies, with observation years ranging from 2002 to 2022. The unweighted mean across country indicators is 7.94% and the median 7.05%.
This is not a simple average of tariff lines. Each MFN tariff rate is weighted by the import share of the corresponding product, so heavily imported products contribute more to the national average than products with little trade. The statistic therefore combines the tariff schedule with the observed composition of imports.
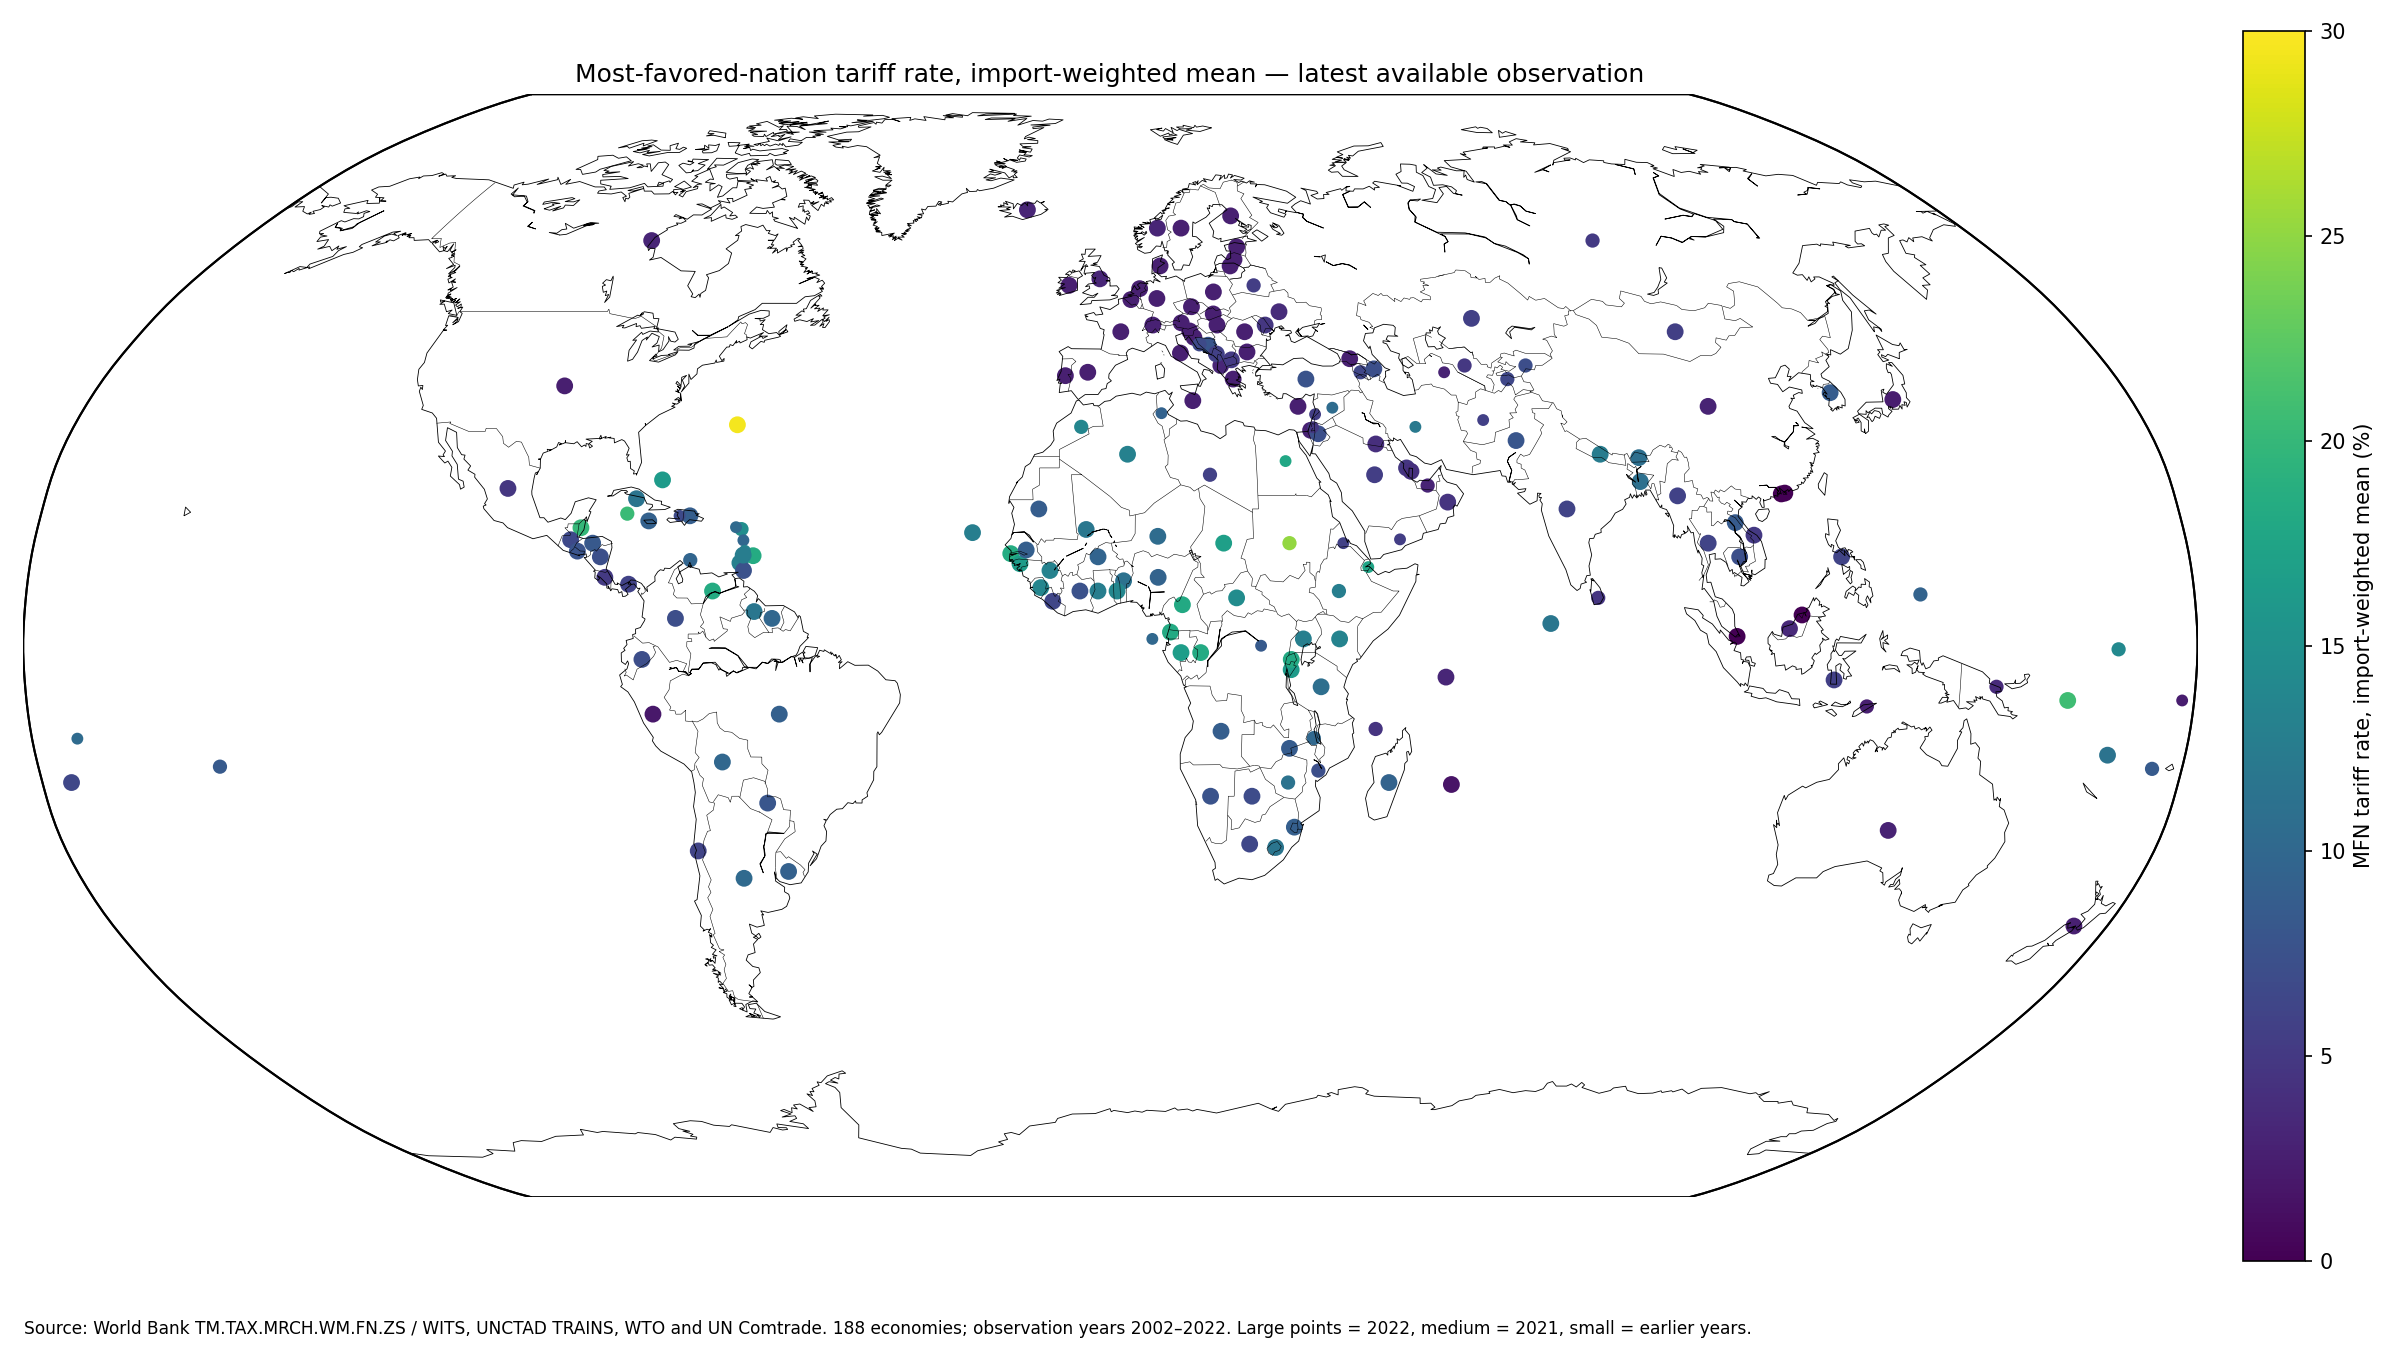
Table of Contents
The weighted MFN average uses product import shares
The World Bank metadata glossary defines the indicator as the average of MFN tariff rates weighted by product import shares. Tariff-line data are classified at HS six- or eight-digit level and linked to SITC Revision 3 categories, while import weights are derived from UN Comtrade.
Conceptually, tariff rates are multiplied by the relevant import values, the products are summed, and the total is divided by overall imports. A tariff on a large imported product category therefore has more influence than the same tariff on a product that is barely imported.
MFN tariffs differ from preferential or effectively applied tariffs
An MFN tariff is the non-preferential benchmark rate generally applied when no lower preferential rate is available. Free-trade agreements, customs unions and other preference schemes can reduce the tariff actually applied to imports from eligible partners.
That makes this series different from the effectively applied weighted mean tariff. The applied measure can incorporate preferential treatment, whereas the MFN series is better suited to comparing the general non-preferential tariff schedule.
Weighted mean and simple mean answer different questions
The MFN simple mean gives equal weight to tariff lines. The weighted mean gives more weight to products with larger imports. If high-tariff products are imported in small quantities while low-tariff products dominate trade, the weighted mean can be much lower than the simple mean.
The gap between the two indicators can therefore reflect both the shape of the tariff schedule and the composition of imports. Neither one should be treated as a complete summary of all trade barriers.
The latest-observation median is 7.05%
Across 188 latest observations, the median is 7.05%, the first quartile 3.17% and the third quartile 10.82%. The middle half of economies lies between roughly 3.17% and 10.82%. The simple country mean is 7.94%.
Two observations are exactly zero, 4 are above zero but below 2%, 58 are from 2% to under 5%, 70 from 5% to under 10%, 35 from 10% to under 15%, 14 from 15% to under 20%, and 5 are at least 20%.
| Latest import-weighted MFN tariff | Economies | Share of 188 |
|---|---|---|
| 0% | 2 | 1.1% |
| Above 0% to under 2% | 4 | 2.1% |
| 2% to under 5% | 58 | 30.9% |
| 5% to under 10% | 70 | 37.2% |
| 10% to under 15% | 35 | 18.6% |
| 15% to under 20% | 14 | 7.4% |
| 20% or more | 5 | 2.7% |
Bermuda has the highest latest observation at 29.52%
Bermuda records 29.52%, Sudan 25.17%, Solomon Islands 20.66%, the Cayman Islands 20.39%, and Belize 20.00%.
The years are not fully synchronized: Sudan and the Cayman Islands are from 2021, while several other high values are from 2022. Egypt’s latest value is from 2019 and Djibouti’s from 2014, so the latest-value ranking is designed for coverage rather than a strict single-year league table.
| True latest-observation rank | Country or economy | Observation year | Weighted MFN tariff |
|---|---|---|---|
| 1 | Bermuda | 2022 | 29.52% |
| 2 | Sudan | 2021 | 25.17% |
| 3 | Solomon Islands | 2022 | 20.66% |
| 4 | Cayman Islands | 2021 | 20.39% |
| 5 | Belize | 2022 | 20.00% |
| 6 | Gambia, The | 2022 | 18.49% |
| 7 | Venezuela, RB | 2022 | 18.39% |
| 8 | Barbados | 2022 | 18.36% |
| 9 | Congo, Rep. | 2022 | 18.18% |
| 10 | Equatorial Guinea | 2022 | 18.18% |
| 11 | Rwanda | 2022 | 18.15% |
| 12 | Cameroon | 2022 | 18.08% |
| 13 | Egypt, Arab Rep. | 2019 | 17.88% |
| 14 | Djibouti | 2014 | 17.56% |
| 15 | Chad | 2022 | 16.80% |
The synchronized 2022 subset contains 143 economies
Among the 143 observations from 2022, Bermuda records 29.52%, Solomon Islands 20.66%, Belize 20.00%, the Gambia 18.49%, Venezuela 18.39%, and Barbados 18.36%.
| 2022 rank | Country or economy | Weighted MFN tariff |
|---|---|---|
| 1 | Bermuda | 29.52% |
| 2 | Solomon Islands | 20.66% |
| 3 | Belize | 20.00% |
| 4 | Gambia, The | 18.49% |
| 5 | Venezuela, RB | 18.39% |
| 6 | Barbados | 18.36% |
| 7 | Equatorial Guinea | 18.18% |
| 8 | Congo, Rep. | 18.18% |
| 9 | Rwanda | 18.15% |
| 10 | Cameroon | 18.08% |
| 11 | Chad | 16.80% |
| 12 | Gabon | 16.57% |
| 13 | Guinea-Bissau | 16.52% |
| 14 | Burundi | 16.36% |
| 15 | Bahamas, The | 16.34% |
The 2022 subset has an unweighted mean of 7.64%, a median of 6.60%, a first quartile of 2.72%, and a third quartile of 10.83%. For a same-year cross-country comparison, this subset is more coherent than the full latest-value map.
Most 2022 observations fall between 2% and 10%
In 2022, two economies report 0%, 4 are above zero but below 2%, 49 are from 2% to under 5%, 49 from 5% to under 10%, 24 from 10% to under 15%, 12 from 15% to under 20%, and 3 are at least 20%.
The 6.60% median places a typical reporting economy in the middle single digits, but the same year contains both near-zero tariff averages and values close to 30%.
Hong Kong SAR, China and Macao SAR, China report official zeros
Both observations are 0.00% in 2022. Brunei Darussalam records 0.05%, Singapore 0.11%, Mauritius 1.59%, and Peru 1.96%.
A reported zero is not the same as missing data. All 188 rows used in this analysis contain numeric source observations; no absent economy has been converted to zero.
| Low-end order | Country or economy | Observation year | Weighted MFN tariff |
|---|---|---|---|
| 1 | Macao SAR, China | 2022 | 0.00% |
| 2 | Hong Kong SAR, China | 2022 | 0.00% |
| 3 | Brunei Darussalam | 2022 | 0.05% |
| 4 | Singapore | 2022 | 0.11% |
| 5 | Mauritius | 2022 | 1.59% |
| 6 | Peru | 2022 | 1.96% |
| 7 | Japan | 2022 | 2.42% |
| 8 | Tuvalu | 2017 | 2.43% |
| 9 | Timor-Leste | 2021 | 2.53% |
| 10 | United States | 2022 | 2.53% |
| 11 | Georgia | 2022 | 2.59% |
| 12 | New Zealand | 2022 | 2.61% |
| 13 | Finland | 2022 | 2.68% |
| 14 | Denmark | 2022 | 2.68% |
| 15 | Bulgaria | 2022 | 2.68% |
East Asia ranges from 0.05% to 6.05% in 2022
The Philippines records 6.05%, Thailand 5.98%, Indonesia 5.73%, Viet Nam 4.98%, Malaysia 3.42%, China 2.86%, Japan 2.42%, Singapore 0.11%, and Brunei Darussalam 0.05%.
Even within one region, differences in tariff schedules and import baskets produce a wide range. Import weights make the indicator sensitive to what each economy actually buys from abroad.
| East Asia examples | Observation year | Weighted MFN tariff |
|---|---|---|
| Philippines | 2022 | 6.05% |
| Thailand | 2022 | 5.98% |
| Indonesia | 2022 | 5.73% |
| Viet Nam | 2022 | 4.98% |
| Malaysia | 2022 | 3.42% |
| China | 2022 | 2.86% |
| Japan | 2022 | 2.42% |
| Singapore | 2022 | 0.11% |
| Brunei Darussalam | 2022 | 0.05% |
South Asia is mostly in the upper single digits or low double digits
In 2022, Nepal records 12.44%, the Maldives 11.78%, Bangladesh 11.00%, Bhutan 10.82%, Pakistan 8.07%, and India 5.99%. Sri Lanka’s latest value is 4.68% from 2021 and Afghanistan’s is 5.72% from 2018.
Those older observations should not be described as 2022 tariff conditions. Tariff reforms and changes in the import basket can materially change the weighted average over several years.
| South Asia examples | Observation year | Weighted MFN tariff |
|---|---|---|
| Nepal | 2022 | 12.44% |
| Maldives | 2022 | 11.78% |
| Bangladesh | 2022 | 11.00% |
| Bhutan | 2022 | 10.82% |
| Pakistan | 2022 | 8.07% |
| India | 2022 | 5.99% |
| Afghanistan | 2018 | 5.72% |
| Sri Lanka | 2021 | 4.68% |
Several Sub-Saharan African economies are above 13%
The Gambia records 18.49%, the Republic of Congo 18.18%, Equatorial Guinea 18.18%, Rwanda 18.15%, Cameroon 18.08%, Chad 16.80%, Gabon 16.57%, Guinea-Bissau 16.52%, and Burundi 16.36%.
These are MFN benchmark rates weighted by imports, not necessarily the tariffs actually collected on every shipment. Preferential arrangements, exemptions and product-specific rules can change the effective tariff faced by a particular importer.
| Sub-Saharan Africa examples | Observation year | Weighted MFN tariff |
|---|---|---|
| Gambia, The | 2022 | 18.49% |
| Congo, Rep. | 2022 | 18.18% |
| Equatorial Guinea | 2022 | 18.18% |
| Rwanda | 2022 | 18.15% |
| Cameroon | 2022 | 18.08% |
| Chad | 2022 | 16.80% |
| Gabon | 2022 | 16.57% |
| Guinea-Bissau | 2022 | 16.52% |
| Burundi | 2022 | 16.36% |
| Togo | 2022 | 13.91% |
| Sierra Leone | 2022 | 13.80% |
| Kenya | 2022 | 13.37% |
| Guinea | 2022 | 13.20% |
| Benin | 2022 | 11.23% |
The Americas range from Belize at 20% to Peru below 2%
Belize records 20.00%, Venezuela 18.39%, Barbados 18.36%, Argentina 10.29%, Brazil 9.06%, Colombia 7.06%, Chile 5.99%, Mexico 4.75%, Canada 3.05%, the United States 2.53%, and Peru 1.96%.
The spread reflects differences in general tariff schedules and import composition. It should not be treated as a complete measure of market openness because preferential tariffs, quotas, standards and other non-tariff measures are outside this single percentage.
| Americas examples | Observation year | Weighted MFN tariff |
|---|---|---|
| Belize | 2022 | 20.00% |
| Venezuela, RB | 2022 | 18.39% |
| Barbados | 2022 | 18.36% |
| Argentina | 2022 | 10.29% |
| Brazil | 2022 | 9.06% |
| Colombia | 2022 | 7.06% |
| Chile | 2022 | 5.99% |
| Mexico | 2022 | 4.75% |
| Canada | 2022 | 3.05% |
| United States | 2022 | 2.53% |
| Peru | 2022 | 1.96% |
Many European economies share a 2.68% value in 2022
Austria, Belgium, Bulgaria, Croatia, Czechia, Denmark, Estonia, Finland, France, Germany, Greece, Hungary, Italy, Latvia, Lithuania, Malta, the Netherlands, Poland, Portugal, Romania, the Slovak Republic, Slovenia, Spain and Sweden all record 2.68%.
The common value is consistent with the European Union’s common external tariff framework, but it does not mean every shipment into every member faces the same effective tariff. Preferential treatment and the detailed import mix still matter.
| European examples | Observation year | Weighted MFN tariff |
|---|---|---|
| Austria | 2022 | 2.68% |
| Belgium | 2022 | 2.68% |
| Bulgaria | 2022 | 2.68% |
| Czechia | 2022 | 2.68% |
| Germany | 2022 | 2.68% |
| Denmark | 2022 | 2.68% |
| Spain | 2022 | 2.68% |
| Estonia | 2022 | 2.68% |
| Finland | 2022 | 2.68% |
| France | 2022 | 2.68% |
| Greece | 2022 | 2.68% |
| Croatia | 2022 | 2.68% |
| Hungary | 2022 | 2.68% |
| Italy | 2022 | 2.68% |
| Lithuania | 2022 | 2.68% |
| Latvia | 2022 | 2.68% |
| Malta | 2022 | 2.68% |
| Netherlands | 2022 | 2.68% |
| Poland | 2022 | 2.68% |
| Portugal | 2022 | 2.68% |
| Romania | 2022 | 2.68% |
| Slovak Republic | 2022 | 2.68% |
| Slovenia | 2022 | 2.68% |
| Sweden | 2022 | 2.68% |
Import weighting can downplay tariff lines that attract little trade
Because the weights are observed imports, a product with a very high tariff but almost no imports receives little weight. High tariffs can themselves suppress imports, which means the trade-weighted average is not a pure measure of the tariff schedule’s restrictiveness.
That is a strength when the question is exposure of the actual import basket, but a limitation when the question is the legal structure of protection. Simple means, tariff peaks and detailed product-level rates can complement the weighted average.
All products refers to merchandise, not services
The tariff lines are based on the Harmonized System for goods. Services such as banking, transport, tourism and telecommunications are governed by different trade rules and are outside this merchandise-tariff indicator.
A broad assessment of trade openness therefore requires more than the MFN merchandise tariff. Services restrictions and non-tariff measures can be economically important even when merchandise tariffs are low.
Mixed observation years are the main limitation of the latest-value map
Of the 188 latest observations, 143 are from 2022 and 26 from 2021, giving 169 from those two years. 10 latest values are from 2019 or earlier, and the oldest dates to 2002.
The visual uses larger points for 2022, medium points for 2021 and smaller points for older years so broad geographic coverage does not hide the time mismatch.
| Latest observation year | Economies |
|---|---|
| 2022 | 143 |
| 2021 | 26 |
| 2020 | 9 |
| 2019 | 2 |
| 2018 | 1 |
| 2017 | 3 |
| 2016 | 1 |
| 2014 | 1 |
| 2006 | 1 |
| 2002 | 1 |
The simple country mean is not a global import-weighted tariff
The 7.94% latest-value mean and 7.64% 2022 mean give every economy one equal weight. A major importer and a small economy each contribute one national indicator.
A global tariff exposure measure would require another layer of weighting by each economy’s import value. Product weighting within a country and country weighting across the world are separate operations.
Source and calculation notes
The source is World Bank World Development Indicators series TM.TAX.MRCH.WM.FN.ZS, based on WITS, UNCTAD TRAINS, WTO tariff databases and UN Comtrade import weights. The analysis uses 188 latest non-empty observations and separately summarizes the 143 values from 2022.
All 188 country codes are matched to geographic centroids for the map, producing a 100% match. Reported zeros remain zero, no missing values are fabricated, and point size indicates observation-year recency.
Frequently Asked Questions
How is the import-weighted MFN tariff calculated?
MFN tariff rates are weighted by the import shares of the corresponding products, so heavily imported products have more influence on the national average.
Is the MFN tariff the same as the tariff actually applied to every import?
No. Preferential agreements can provide lower rates to eligible partners, so effectively applied tariffs can differ from the MFN benchmark.
Are all 188 observations from 2022?
No. There are 143 observations from 2022, 26 from 2021, and the remaining latest values date from 2002–2020.
Related Articles
Green Map creates custom-edited map images using open geographic data sources such as geoBoundaries, Natural Earth, OpenStreetMap, and government open data. These maps are edited visual materials, not raw data files, and are provided for education, documents, presentations, and graphic reference.