World Bank data for 2021 show that primary government expenditure as a proportion of the original approved budget varies widely across reporting countries and economies. Among 124 reported observations, the simple mean is 100.22% and the median is 99.79%. Türkiye records the highest value at 145.73%, followed by the Slovak Republic at 140.70%, Sudan at 136.76%, Lithuania at 136.06% and Japan at 136.00%. Afghanistan has the lowest reported value at 48.67%.
A value of 100% is the reference point: actual primary government expenditure equalled the original approved budget. Values above 100% indicate spending above the original budget, while values below 100% indicate spending below it. Of the 124 observations, 61 are above 100% and 63 are below 100%. 72 fall between 90% and 110%, so many countries are close to the original budget even though the full range is wide.
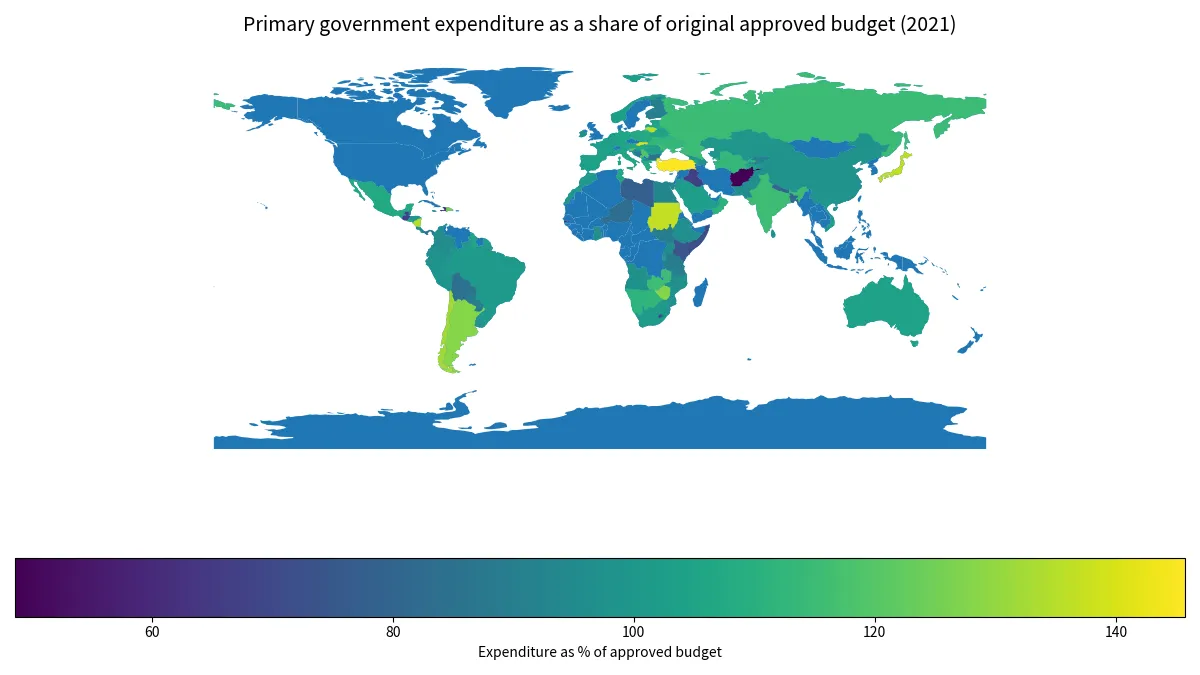
Table of Contents
100% is a budget-execution reference point, not a fiscal performance score
GF.XPD.BUDG.ZS compares actual primary government expenditure with the budget originally approved. A value close to 100% means actual spending was close to the initial plan. A value above 100% indicates expenditure exceeded the original approved budget, while a value below 100% indicates under-execution relative to that plan.
The ratio should not be turned into a simple good-versus-bad score. Budgets can change during a fiscal year because of emergencies, policy revisions, inflation, revenue shocks, supplementary appropriations or implementation delays. The indicator is useful for examining budget credibility and execution variance, but it does not directly measure spending quality, fiscal sustainability, debt risk or value for money.
Türkiye, the Slovak Republic and Sudan were far above the original budget
Türkiye records 145.73%, the Slovak Republic 140.70%, Sudan 136.76%, Lithuania 136.06% and Japan 136.00%. Nicaragua reaches 134.64%, Chile 132.22%, Argentina 128.21%, Zimbabwe 127.88% and the Dominican Republic 125.71%.
There are 11 observations at 120% or above. These values mean actual primary expenditure was at least one-fifth higher than the original approved budget. The dataset does not identify the reason for the overrun. Emergency spending, policy revisions, supplementary budgets and price changes are possible contexts, but country budget documents are needed to establish causes.
The 99.79% median is almost exactly on the original budget
The median is 99.79%, very close to the 100% reference point. The first quartile is 90.84% and the third quartile 107.10%, placing the middle half of observations between roughly 90.8% and 107.1%. The simple mean of 100.22% is also close to 100%, but that central tendency hides substantial variation at both ends.
The top ten observations average 134.39%, while the bottom ten average 67.01%. The maximum-to-minimum gap is 97.06 percentage points. A global median near 100% therefore does not imply that individual countries all execute budgets close to the original plan.
Afghanistan, Haiti and The Gambia were far below the approved budget
Afghanistan records 48.67%, Haiti 59.33%, The Gambia 63.21%, Guatemala 66.62% and Iraq 66.86%. 10 observations are below 80%, indicating actual primary expenditure at least one-fifth below the original approved budget.
Under-execution can be associated with procurement delays, financing shortfalls, administrative capacity, conflict, project postponement or policy changes, but the ratio cannot identify which explanation applies. Low execution should not automatically be described as fiscal discipline or savings because it can also reflect an inability to deliver planned public services.
Regional patterns exist, but within-region variation is large
Among observations matched to the map boundary, Europe has 32 reported countries with a median of 105.60%. Asia has 26 with a median of 99.49%, Africa 26 with 96.51%, and South America 10 with 98.27%. These are unweighted country medians, not regional expenditure-weighted ratios.
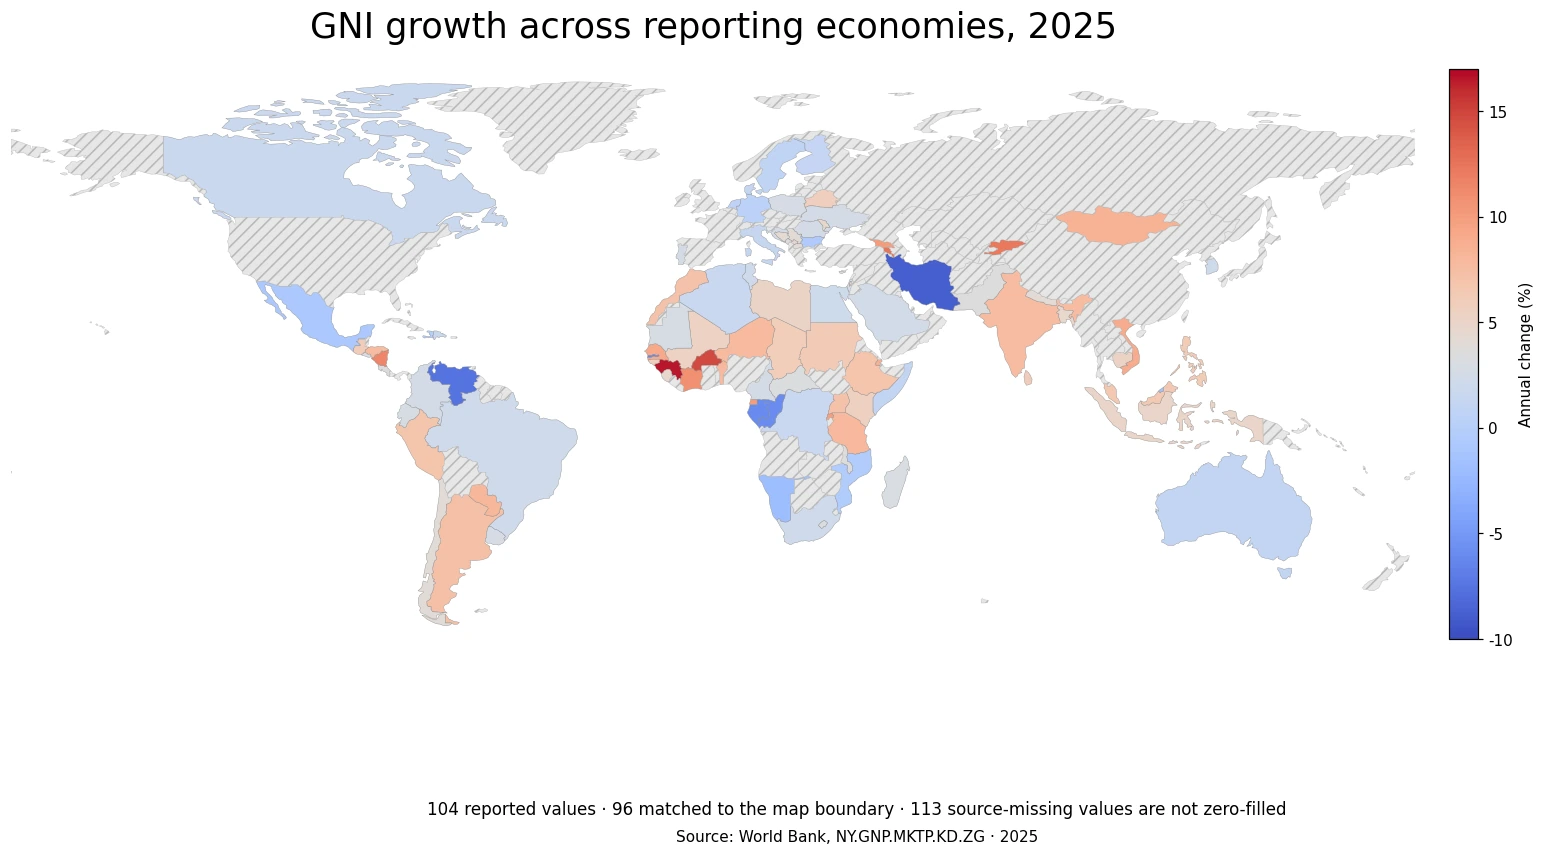
The map shows clusters of values above 100% in parts of Europe and Central Asia, but both high and low execution ratios appear within Africa, Asia and the Americas. Geography alone cannot explain the differences. Budget institutions, accounting rules, fiscal shocks and policy responses vary country by country.
This is not government expenditure as a share of GDP
A value of 120% does not mean the government spent 120% of GDP. The denominator is the original approved budget, not national income or economic output. Countries with very different government sizes can all record 100% if actual primary expenditure matches the original budget.
Similarly, a country at 130% does not necessarily spend more money in absolute terms than a country at 90%. The ratio measures plan-versus-execution alignment. Comparing the size of government requires separate indicators such as expenditure as a share of GDP or per-capita government spending.
The 2021 reference year matters
The comparison refers to 2021, when many governments were still responding to the economic and public-health effects of the COVID-19 pandemic. Budget revisions and emergency spending may have been unusually important in some countries. The indicator itself, however, does not quantify how much of each deviation was caused by the pandemic.
Assessing persistent budget credibility requires a time series. One year above 120% can reflect an exceptional shock, while repeated deviations may indicate a structural pattern. The same is true for low execution rates. A one-year cross-section should therefore be interpreted cautiously.
All 124 reported observations for 2021
The table lists the 124 countries and economies with a reported 2021 value, ordered from highest to lowest. The source contains 217 country and economy rows, but 93 have no 2021 value. Those missing rows are not replaced with zero or ranked at the bottom.
| Rank | Country or economy | Expenditure / original budget |
|---|---|---|
| 1 | Türkiye | 145.73% |
| 2 | Slovakia | 140.70% |
| 3 | Sudan | 136.76% |
| 4 | Lithuania | 136.06% |
| 5 | Japan | 136.00% |
| 6 | Nicaragua | 134.64% |
| 7 | Chile | 132.22% |
| 8 | Argentina | 128.21% |
| 9 | Zimbabwe | 127.88% |
| 10 | Dominican Republic | 125.71% |
| 11 | Slovenia | 121.88% |
| 12 | Montenegro | 119.14% |
| 13 | Serbia | 118.95% |
| 14 | Moldova | 117.56% |
| 15 | Zambia | 115.39% |
| 16 | India | 115.37% |
| 17 | Russia | 114.84% |
| 18 | Uzbekistan | 113.49% |
| 19 | Turkmenistan | 113.32% |
| 20 | St. Vincent & Grenadines | 113.22% |
| 21 | Ukraine | 112.89% |
| 22 | Botswana | 112.45% |
| 23 | Oman | 111.83% |
| 24 | Micronesia | 111.52% |
| 25 | Namibia | 111.18% |
| 26 | Malta | 109.90% |
| 27 | Greece | 109.31% |
| 28 | Armenia | 108.27% |
| 29 | Cyprus | 107.36% |
| 30 | Mexico | 107.20% |
| 31 | El Salvador | 107.18% |
| 32 | Poland | 107.07% |
| 33 | Luxembourg | 106.99% |
| 34 | Hungary | 106.79% |
| 35 | Austria | 106.63% |
| 36 | Latvia | 106.07% |
| 37 | Tunisia | 106.07% |
| 38 | Burundi | 106.06% |
| 39 | Albania | 105.98% |
| 40 | Italy | 105.96% |
| 41 | Guyana | 105.68% |
| 42 | Germany | 105.24% |
| 43 | Tajikistan | 105.01% |
| 44 | Kiribati | 104.88% |
| 45 | Australia | 104.69% |
| 46 | Belarus | 104.57% |
| 47 | Spain | 104.21% |
| 48 | Estonia | 103.88% |
| 49 | Belgium | 103.60% |
| 50 | France | 103.43% |
| 51 | Romania | 103.31% |
| 52 | Norway | 102.96% |
| 53 | Bhutan | 102.81% |
| 54 | Saudi Arabia | 102.53% |
| 55 | Portugal | 102.20% |
| 56 | South Africa | 101.30% |
| 57 | Vietnam | 101.25% |
| 58 | Maldives | 101.09% |
| 59 | Brazil | 100.83% |
| 60 | Morocco | 100.79% |
| 61 | Netherlands | 100.57% |
| 62 | Honduras | 99.89% |
| 63 | Georgia | 99.70% |
| 64 | Jamaica | 99.63% |
| 65 | Jordan | 99.28% |
| 66 | Kazakhstan | 99.15% |
| 67 | Kuwait | 98.78% |
| 68 | Peru | 98.74% |
| 69 | Mozambique | 98.01% |
| 70 | Sri Lanka | 97.99% |
| 71 | Uruguay | 97.80% |
| 72 | China | 97.73% |
| 73 | Croatia | 97.69% |
| 74 | Angola | 97.58% |
| 75 | Ecuador | 97.27% |
| 76 | Ireland | 97.21% |
| 77 | Ghana | 96.82% |
| 78 | Ethiopia | 96.58% |
| 79 | Mauritius | 96.55% |
| 80 | Rwanda | 96.43% |
| 81 | Comoros | 96.32% |
| 82 | Azerbaijan | 96.07% |
| 83 | Uganda | 96.04% |
| 84 | Pakistan | 95.83% |
| 85 | Colombia | 95.64% |
| 86 | Costa Rica | 95.59% |
| 87 | Vanuatu | 94.28% |
| 88 | Eswatini | 93.89% |
| 89 | Malawi | 93.60% |
| 90 | Egypt | 93.16% |
| 91 | North Macedonia | 92.40% |
| 92 | Kyrgyzstan | 92.08% |
| 93 | Palestinian Territories | 90.93% |
| 94 | Kosovo | 90.57% |
| 95 | Finland | 90.44% |
| 96 | Tonga | 90.42% |
| 97 | St. Lucia | 90.17% |
| 98 | Paraguay | 89.88% |
| 99 | South Sudan | 89.86% |
| 100 | Dominica | 89.29% |
| 101 | Seychelles | 89.29% |
| 102 | Tanzania | 89.27% |
| 103 | Belize | 89.10% |
| 104 | Panama | 87.87% |
| 105 | Palau | 87.38% |
| 106 | Bosnia & Herzegovina | 86.94% |
| 107 | Turks & Caicos Islands | 85.88% |
| 108 | Bulgaria | 85.46% |
| 109 | Bolivia | 84.49% |
| 110 | Samoa | 84.44% |
| 111 | São Tomé & Príncipe | 84.27% |
| 112 | Niger | 83.22% |
| 113 | Bangladesh | 81.01% |
| 114 | Nepal | 80.11% |
| 115 | Libya | 77.51% |
| 116 | Kenya | 73.70% |
| 117 | Grenada | 73.22% |
| 118 | Somalia | 71.10% |
| 119 | Lesotho | 69.87% |
| 120 | Iraq | 66.86% |
| 121 | Guatemala | 66.62% |
| 122 | Gambia | 63.21% |
| 123 | Haiti | 59.33% |
| 124 | Afghanistan | 48.67% |
Large data gaps limit a complete global ranking
Only 124 of the 217 country and economy rows have a reported 2021 value. The remaining 93 are source-missing, so the table should be read as a comparison among reporting economies rather than a complete worldwide ranking.
The low-resolution map displays 107 of the reported observations. The remaining 17, mostly small islands and territories, remain in the table and summary statistics. Blank map areas can represent unavailable data or missing geometry rather than a 0% execution ratio.
Source and indicator definition
The source is World Bank indicator GF.XPD.BUDG.ZS, “Primary government expenditures as a proportion of original approved budget (%)”, for 2021. The calculations use the 124 reported observations, while the 93 source-missing rows remain missing. The mean, median, quartiles and ordering are derived from reported values only.
Frequently Asked Questions
What does 100% mean in this indicator?
It means actual primary government expenditure equalled the original approved budget. Above 100% indicates spending above the original budget; below 100% indicates lower spending.
What are the 2021 median and mean?
Across the 124 reported observations, the median is 99.79% and the simple mean is 100.22%.
Does being close to 100% mean better fiscal policy?
Not necessarily. The indicator measures plan-versus-execution alignment, not spending quality, efficiency or debt sustainability.
Are missing values treated as zero?
No. The 93 source-missing rows remain missing and are excluded from the mean and ranking.
Related Articles
Green Map creates custom-edited map images using open geographic data sources such as geoBoundaries, Natural Earth, OpenStreetMap, and government open data. These maps are edited visual materials, not raw data files, and are provided for education, documents, presentations, and graphic reference.