The World Bank’s 2024 total fertility rate series provides a same-year comparison for 217 countries, economies, and separately reported territories. The simple mean is 2.35 births per woman and the median is 1.90. 119 observations are below 2.1, while 56 are at or above 3.0. Chad is highest at 6.028, and Macao SAR, China is lowest at 0.582.
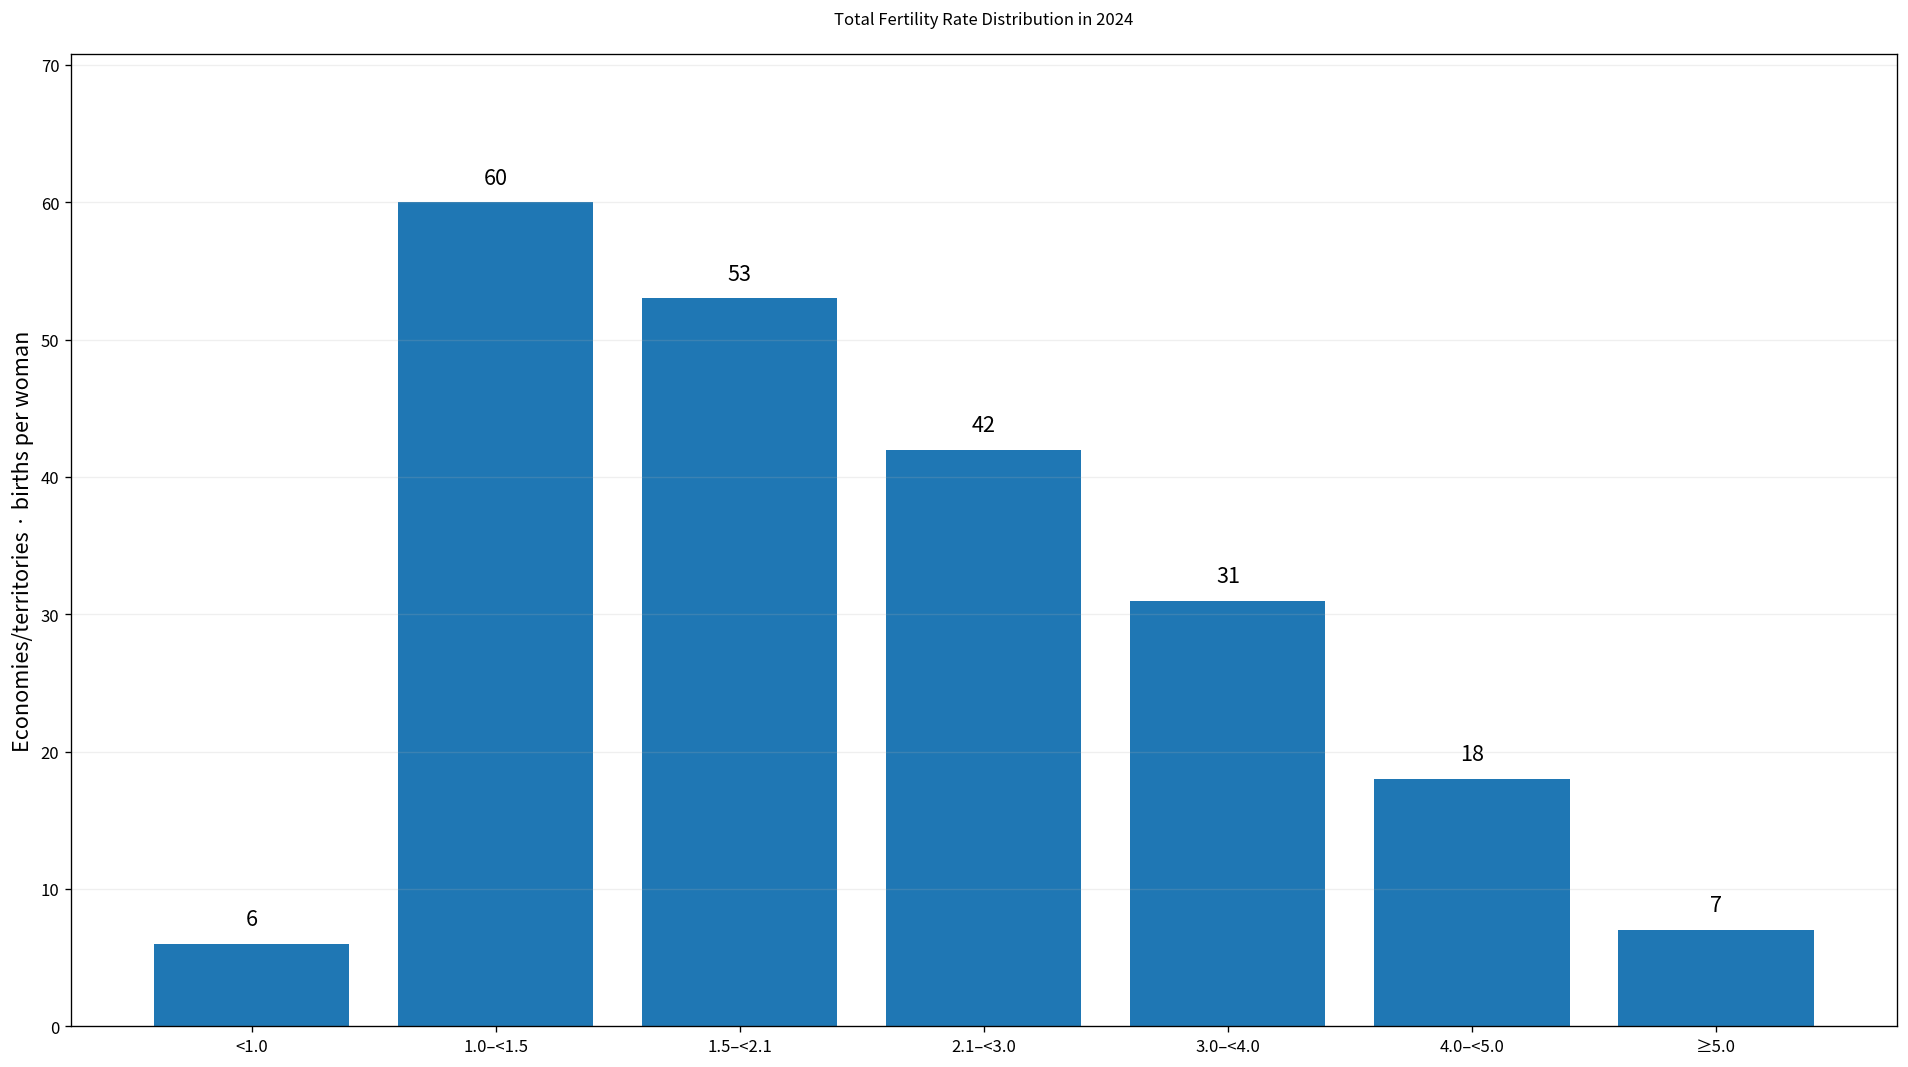
Table of Contents
What the total fertility rate means
The total fertility rate is a period measure derived from age-specific fertility rates. It represents the number of births a woman would be expected to have over her reproductive life if the age-specific fertility rates observed in that year remained unchanged. It is therefore a synthetic indicator of current fertility conditions, not a direct count of children ever born to an actual cohort of women.
The unit is births per woman. A rate of 1.5 means that the year’s age-specific fertility pattern corresponds to roughly 1.5 births per woman over a lifetime under the stated assumption. It is not the same as the total number of births, the crude birth rate, or the population growth rate. A large population can have many births even with a low fertility rate.
All 217 observations refer to 2024
This dataset is unusually clean for cross-country comparison because every observation uses the same reference year and every row has a numeric value. There is no mixed-year latest-value problem and no source-missing value that needs to be imputed. The 217 entries include countries, economies, and separately reported territories, so the count should not be interpreted as the number of sovereign states.
The first quartile is 1.45 births per woman, the median 1.90, and the third quartile 3.07. The middle half of observations therefore lies between roughly 1.45 and 3.07. The mean of 2.35 is above the median because a group of high-fertility observations between four and six births stretches the upper tail.
119 economies and territories are below 2.1
119 of the 217 observations are below 2.1 births per woman. The value 2.1 is often used as an approximate replacement-level reference in low-mortality populations, but replacement fertility is not a universal constant. It can vary with mortality and the sex ratio at birth, so 2.1 should be treated as a useful benchmark rather than an exact threshold for every population.
At lower levels, 66 observations are below 1.5 and 6 are below 1.0. The sub-one observations are spread across several separately reported economies and territories. These are period fertility rates for 2024, not direct forecasts of future population size.
Chad has the highest 2024 fertility rate at 6.03
Chad records 6.028 births per woman, followed by Somalia, Fed. Rep. at 6.013, Congo, Dem. Rep. at 5.981, Central African Republic at 5.954, and Niger at 5.935. Mali is at 5.510 and Angola at 5.048. These seven observations make up the entire group at or above five births per woman.
| 2024 rank | Economy/territory | Total fertility rate |
|---|---|---|
| 1 | Chad | 6.028 |
| 2 | Somalia, Fed. Rep. | 6.013 |
| 3 | Congo, Dem. Rep. | 5.981 |
| 4 | Central African Republic | 5.954 |
| 5 | Niger | 5.935 |
| 6 | Mali | 5.51 |
| 7 | Angola | 5.048 |
| 8 | Burundi | 4.789 |
| 9 | Afghanistan | 4.761 |
| 10 | Mozambique | 4.69 |
| 11 | Mauritania | 4.625 |
| 12 | Tanzania | 4.541 |
| 13 | Yemen, Rep. | 4.499 |
| 14 | Benin | 4.48 |
| 15 | Nigeria | 4.382 |
A high total fertility rate means that the current age-specific fertility schedule corresponds to a high expected number of lifetime births. The indicator alone does not establish why fertility is high. Education, health services, contraceptive access, age at marriage and first birth, urbanization, labor markets, household economics, and social norms can all be relevant, and country-specific explanations require additional evidence.
Macao SAR, China is lowest at 0.58
At the lower end, Macao SAR, China records 0.582 births per woman, followed by Hong Kong SAR, China at 0.841, Puerto Rico (US) at 0.920, Singapore at 0.970, and Ukraine at 0.988 among the values below one. Malta is at 1.010, China 1.013, British Virgin Islands 1.048, and Andorra 1.087.
| Low-order position | Economy/territory | Total fertility rate |
|---|---|---|
| 1 | Macao SAR, China | 0.582 |
| 2 | Korea, Rep. | 0.748 |
| 3 | Hong Kong SAR, China | 0.841 |
| 4 | Puerto Rico (US) | 0.92 |
| 5 | Singapore | 0.97 |
| 6 | Ukraine | 0.988 |
| 7 | Malta | 1.01 |
| 8 | China | 1.013 |
| 9 | British Virgin Islands | 1.048 |
| 10 | Andorra | 1.087 |
| 11 | Spain | 1.1 |
| 12 | Lithuania | 1.11 |
| 13 | Chile | 1.14 |
| 14 | Poland | 1.14 |
| 15 | Japan | 1.15 |
If very low fertility persists for a long period, it tends to reduce the size of future birth cohorts, all else equal. Yet actual population change also depends on mortality and migration. A population can continue growing with low fertility if it has a young age structure or sustained net immigration, while another population may stagnate despite higher fertility if out-migration is substantial.
The largest cluster lies between 1.0 and 2.1
The distribution bands show 6 observations below 1.0, 60 from 1.0 to below 1.5, and 53 from 1.5 to below 2.1. Together, that produces 119 observations below 2.1. There are 42 observations from 2.1 to below 3.0 and 31 from 3.0 to below 4.0.
At the upper end, 18 observations are from 4.0 to below 5.0 and 7 are at least 5.0. A median of 1.895 means that the middle observation, once the 217 values are ordered, is just below 1.9 births per woman. The band counts show why the median is a useful complement to the higher mean.
Fertility is not the same as population growth
Fertility is a major component of population change, but the total fertility rate is not a population growth rate. Age structure matters: even after fertility falls, a population with a large number of people entering reproductive ages can continue to produce many births for some time. This demographic momentum can delay the effect of lower fertility on total population growth.
Migration is equally important for many economies. Net immigration can offset natural decrease, while substantial emigration can reduce population even when fertility is comparatively high. Population projections therefore combine fertility, mortality, migration, and age structure rather than relying on the total fertility rate alone.
How to use the 2.1 reference level
Around 2.1 births per woman is commonly cited as the replacement level in low-mortality populations. It is slightly above two because not every girl survives to the end of the reproductive ages and because the sex ratio at birth is not exactly one-to-one. The precise replacement level varies across populations.
Being below replacement in one year does not mean population decline begins immediately. The timing depends on the age distribution and migration, and fertility itself can change from year to year. The 2.1 line is therefore most useful as a demographic reference point for sustained patterns rather than a short-term prediction rule.
Complete list of 217 countries, economies, and territories
The table below lists all 217 observations in alphabetical order. Every value refers to 2024, so direct cross-sectional comparison does not require a year adjustment. The entries use births per woman, and the displayed precision follows the reported values without filling or estimating any missing observation.
| Country/economy/territory | Year | Total fertility rate |
|---|---|---|
| Afghanistan | 2024 | 4.761 |
| Albania | 2024 | 1.341 |
| Algeria | 2024 | 2.723 |
| American Samoa | 2024 | 2.267 |
| Andorra | 2024 | 1.087 |
| Angola | 2024 | 5.048 |
| Antigua and Barbuda | 2024 | 1.582 |
| Argentina | 2024 | 1.504 |
| Armenia | 2024 | 1.7 |
| Aruba | 2024 | 1.606 |
| Australia | 2024 | 1.481 |
| Austria | 2024 | 1.31 |
| Azerbaijan | 2024 | 1.43 |
| Bahamas, The | 2024 | 1.374 |
| Bahrain | 2024 | 1.805 |
| Bangladesh | 2024 | 2.138 |
| Barbados | 2024 | 1.708 |
| Belarus | 2024 | 1.217 |
| Belgium | 2024 | 1.44 |
| Belize | 2024 | 2.021 |
| Benin | 2024 | 4.48 |
| Bermuda | 2024 | 1.405 |
| Bhutan | 2024 | 1.449 |
| Bolivia | 2024 | 2.523 |
| Bosnia and Herzegovina | 2024 | 1.492 |
| Botswana | 2024 | 2.703 |
| Brazil | 2024 | 1.614 |
| British Virgin Islands | 2024 | 1.048 |
| Brunei Darussalam | 2024 | 1.731 |
| Bulgaria | 2024 | 1.72 |
| Burkina Faso | 2024 | 4.11 |
| Burundi | 2024 | 4.789 |
| Cabo Verde | 2024 | 1.511 |
| Cambodia | 2024 | 2.548 |
| Cameroon | 2024 | 4.261 |
| Canada | 2024 | 1.25 |
| Cayman Islands | 2024 | 1.525 |
| Central African Republic | 2024 | 5.954 |
| Chad | 2024 | 6.028 |
| Channel Islands | 2024 | 1.37 |
| Chile | 2024 | 1.14 |
| China | 2024 | 1.013 |
| Colombia | 2024 | 1.634 |
| Comoros | 2024 | 3.822 |
| Congo, Dem. Rep. | 2024 | 5.981 |
| Congo, Rep. | 2024 | 4.109 |
| Costa Rica | 2024 | 1.318 |
| Cote d’Ivoire | 2024 | 4.23 |
| Croatia | 2024 | 1.46 |
| Cuba | 2024 | 1.445 |
| Curacao | 2024 | 1.4 |
| Cyprus | 2024 | 1.38 |
| Czechia | 2024 | 1.36 |
| Denmark | 2024 | 1.47 |
| Djibouti | 2024 | 2.618 |
| Dominica | 2024 | 1.48 |
| Dominican Republic | 2024 | 2.222 |
| Ecuador | 2024 | 1.806 |
| Egypt, Arab Rep. | 2024 | 2.735 |
| El Salvador | 2024 | 1.768 |
| Equatorial Guinea | 2024 | 4.116 |
| Eritrea | 2024 | 3.68 |
| Estonia | 2024 | 1.18 |
| Eswatini | 2024 | 2.718 |
| Ethiopia | 2024 | 3.909 |
| Faroe Islands | 2024 | 1.913 |
| Fiji | 2024 | 2.27 |
| Finland | 2024 | 1.25 |
| France | 2024 | 1.61 |
| French Polynesia | 2024 | 1.491 |
| Gabon | 2024 | 3.592 |
| Gambia, The | 2024 | 3.907 |
| Georgia | 2024 | 1.802 |
| Germany | 2024 | 1.36 |
| Ghana | 2024 | 3.344 |
| Gibraltar | 2024 | 1.885 |
| Greece | 2024 | 1.24 |
| Greenland | 2024 | 1.706 |
| Grenada | 2024 | 1.472 |
| Guam | 2024 | 2.748 |
| Guatemala | 2024 | 2.287 |
| Guinea | 2024 | 4.131 |
| Guinea-Bissau | 2024 | 3.757 |
| Guyana | 2024 | 2.395 |
| Haiti | 2024 | 2.625 |
| Honduras | 2024 | 2.476 |
| Hong Kong SAR, China | 2024 | 0.841 |
| Hungary | 2024 | 1.41 |
| Iceland | 2024 | 1.56 |
| India | 2024 | 1.962 |
| Indonesia | 2024 | 2.115 |
| Iran, Islamic Rep. | 2024 | 1.684 |
| Iraq | 2024 | 3.221 |
| Ireland | 2024 | 1.47 |
| Isle of Man | 2024 | 1.544 |
| Israel | 2024 | 2.87 |
| Italy | 2024 | 1.18 |
| Jamaica | 2024 | 1.351 |
| Japan | 2024 | 1.15 |
| Jordan | 2024 | 2.604 |
| Kazakhstan | 2024 | 2.984 |
| Kenya | 2024 | 3.167 |
| Kiribati | 2024 | 3.124 |
| Korea, Dem. People’s Rep. | 2024 | 1.784 |
| Korea, Rep. | 2024 | 0.748 |
| Kosovo | 2024 | 1.538 |
| Kuwait | 2024 | 1.56 |
| Kyrgyz Republic | 2024 | 2.6 |
| Lao PDR | 2024 | 2.397 |
| Latvia | 2024 | 1.24 |
| Lebanon | 2024 | 2.227 |
| Lesotho | 2024 | 2.664 |
| Liberia | 2024 | 3.864 |
| Libya | 2024 | 2.298 |
| Liechtenstein | 2024 | 1.37 |
| Lithuania | 2024 | 1.11 |
| Luxembourg | 2024 | 1.25 |
| Macao SAR, China | 2024 | 0.582 |
| Madagascar | 2024 | 3.912 |
| Malawi | 2024 | 3.59 |
| Malaysia | 2024 | 1.543 |
| Maldives | 2024 | 1.56 |
| Mali | 2024 | 5.51 |
| Malta | 2024 | 1.01 |
| Marshall Islands | 2024 | 2.864 |
| Mauritania | 2024 | 4.625 |
| Mauritius | 2024 | 1.44 |
| Mexico | 2024 | 1.892 |
| Micronesia, Fed. Sts. | 2024 | 2.743 |
| Moldova | 2024 | 1.726 |
| Monaco | 2024 | 2.102 |
| Mongolia | 2024 | 2.5 |
| Montenegro | 2024 | 1.8 |
| Morocco | 2024 | 2.208 |
| Mozambique | 2024 | 4.69 |
| Myanmar | 2024 | 2.098 |
| Namibia | 2024 | 3.211 |
| Naoero | 2024 | 3.29 |
| Nepal | 2024 | 1.961 |
| Netherlands | 2024 | 1.43 |
| New Caledonia | 2024 | 1.964 |
| New Zealand | 2024 | 1.57 |
| Nicaragua | 2024 | 2.206 |
| Niger | 2024 | 5.935 |
| Nigeria | 2024 | 4.382 |
| North Macedonia | 2024 | 1.4 |
| Northern Mariana Islands | 2024 | 2.324 |
| Norway | 2024 | 1.45 |
| Oman | 2024 | 2.508 |
| Pakistan | 2024 | 3.547 |
| Palau | 2024 | 1.883 |
| Panama | 2024 | 2.106 |
| Papua New Guinea | 2024 | 3.072 |
| Paraguay | 2024 | 2.416 |
| Peru | 2024 | 1.965 |
| Philippines | 2024 | 1.894 |
| Poland | 2024 | 1.14 |
| Portugal | 2024 | 1.41 |
| Puerto Rico (US) | 2024 | 0.92 |
| Qatar | 2024 | 1.717 |
| Romania | 2024 | 1.39 |
| Russian Federation | 2024 | 1.418 |
| Rwanda | 2024 | 3.645 |
| Samoa | 2024 | 3.801 |
| San Marino | 2024 | 1.158 |
| Sao Tome and Principe | 2024 | 3.596 |
| Saudi Arabia | 2024 | 2.308 |
| Senegal | 2024 | 3.765 |
| Serbia | 2024 | 1.64 |
| Seychelles | 2024 | 1.85 |
| Sierra Leone | 2024 | 3.703 |
| Singapore | 2024 | 0.97 |
| Sint Maarten (Dutch part) | 2024 | 1.44 |
| Slovak Republic | 2024 | 1.46 |
| Slovenia | 2024 | 1.52 |
| Solomon Islands | 2024 | 3.513 |
| Somalia, Fed. Rep. | 2024 | 6.013 |
| South Africa | 2024 | 2.205 |
| South Sudan | 2024 | 3.785 |
| Spain | 2024 | 1.1 |
| Sri Lanka | 2024 | 1.952 |
| St. Kitts and Nevis | 2024 | 1.526 |
| St. Lucia | 2024 | 1.385 |
| St. Martin (French part) | 2024 | 2.673 |
| St. Vincent and the Grenadines | 2024 | 1.761 |
| Sudan | 2024 | 4.264 |
| Suriname | 2024 | 2.231 |
| Sweden | 2024 | 1.43 |
| Switzerland | 2024 | 1.29 |
| Syrian Arab Republic | 2024 | 2.7 |
| Tajikistan | 2024 | 3.036 |
| Tanzania | 2024 | 4.541 |
| Thailand | 2024 | 1.204 |
| Timor-Leste | 2024 | 2.627 |
| Togo | 2024 | 4.122 |
| Tonga | 2024 | 3.1 |
| Trinidad and Tobago | 2024 | 1.536 |
| Tunisia | 2024 | 1.818 |
| Turkiye | 2024 | 1.48 |
| Turkmenistan | 2024 | 2.661 |
| Turks and Caicos Islands | 2024 | 1.452 |
| Tuvalu | 2024 | 3.174 |
| Uganda | 2024 | 4.165 |
| Ukraine | 2024 | 0.988 |
| United Arab Emirates | 2024 | 1.213 |
| United Kingdom | 2024 | 1.551 |
| United States | 2024 | 1.627 |
| Uruguay | 2024 | 1.397 |
| Uzbekistan | 2024 | 3.486 |
| Vanuatu | 2024 | 3.569 |
| Venezuela, RB | 2024 | 2.077 |
| Viet Nam | 2024 | 1.895 |
| Virgin Islands (U.S.) | 2024 | 1.97 |
| West Bank and Gaza | 2024 | 3.25 |
| Yemen, Rep. | 2024 | 4.499 |
| Zambia | 2024 | 4.036 |
| Zimbabwe | 2024 | 3.674 |
How to interpret the data
First, total fertility is a synthetic period measure, not completed lifetime fertility for a real cohort. Second, fertility alone does not determine current population growth. Third, 2.1 is a useful approximate replacement reference but not a universal constant. Fourth, a single national value does not show differences by region, education, income, or other population groups.
Fifth, the causes of high or low fertility should not be reduced to one policy or one social factor. Housing, labor markets, health, education, family formation, migration, and norms can interact in different ways. Long-term demographic analysis should combine fertility with births, deaths, age structure, life expectancy, and migration.
Source and calculation
The source is World Bank World Development Indicators SP.DYN.TFRT.IN, Fertility rate, total (births per woman). The reference year is 2024. All 217 listed countries, economies, and territories have numeric observations. The mean, median, quartiles, band counts, and high/low rankings are calculated from those 2024 values.
Frequently Asked Questions
Is 2.1 births per woman the exact replacement level everywhere?
No. About 2.1 is a common reference for low-mortality populations, but the exact replacement level varies with mortality and the sex ratio at birth.
What is the median total fertility rate in 2024?
The median across the 217 observations is 1.895 births per woman, while the simple mean is 2.35.
Does fertility below 2.1 mean the population immediately declines?
No. Population change also depends on age structure, mortality, and migration, so below-replacement fertility does not imply immediate population decline.
Related Articles
Green Map creates custom-edited map images using open geographic data sources such as geoBoundaries, Natural Earth, OpenStreetMap, and government open data. These maps are edited visual materials, not raw data files, and are provided for education, documents, presentations, and graphic reference.