World Bank indicator BM.GSR.CMCP.ZS measures communications, computer, information, and a broad group of other services as a percentage of service imports on a balance-of-payments basis. The latest non-empty file contains 199 economies, with 96 observations from 2025, the largest same-year group. Same-year rankings therefore use 2025, while the map and complete table retain each economy’s actual latest observation year.
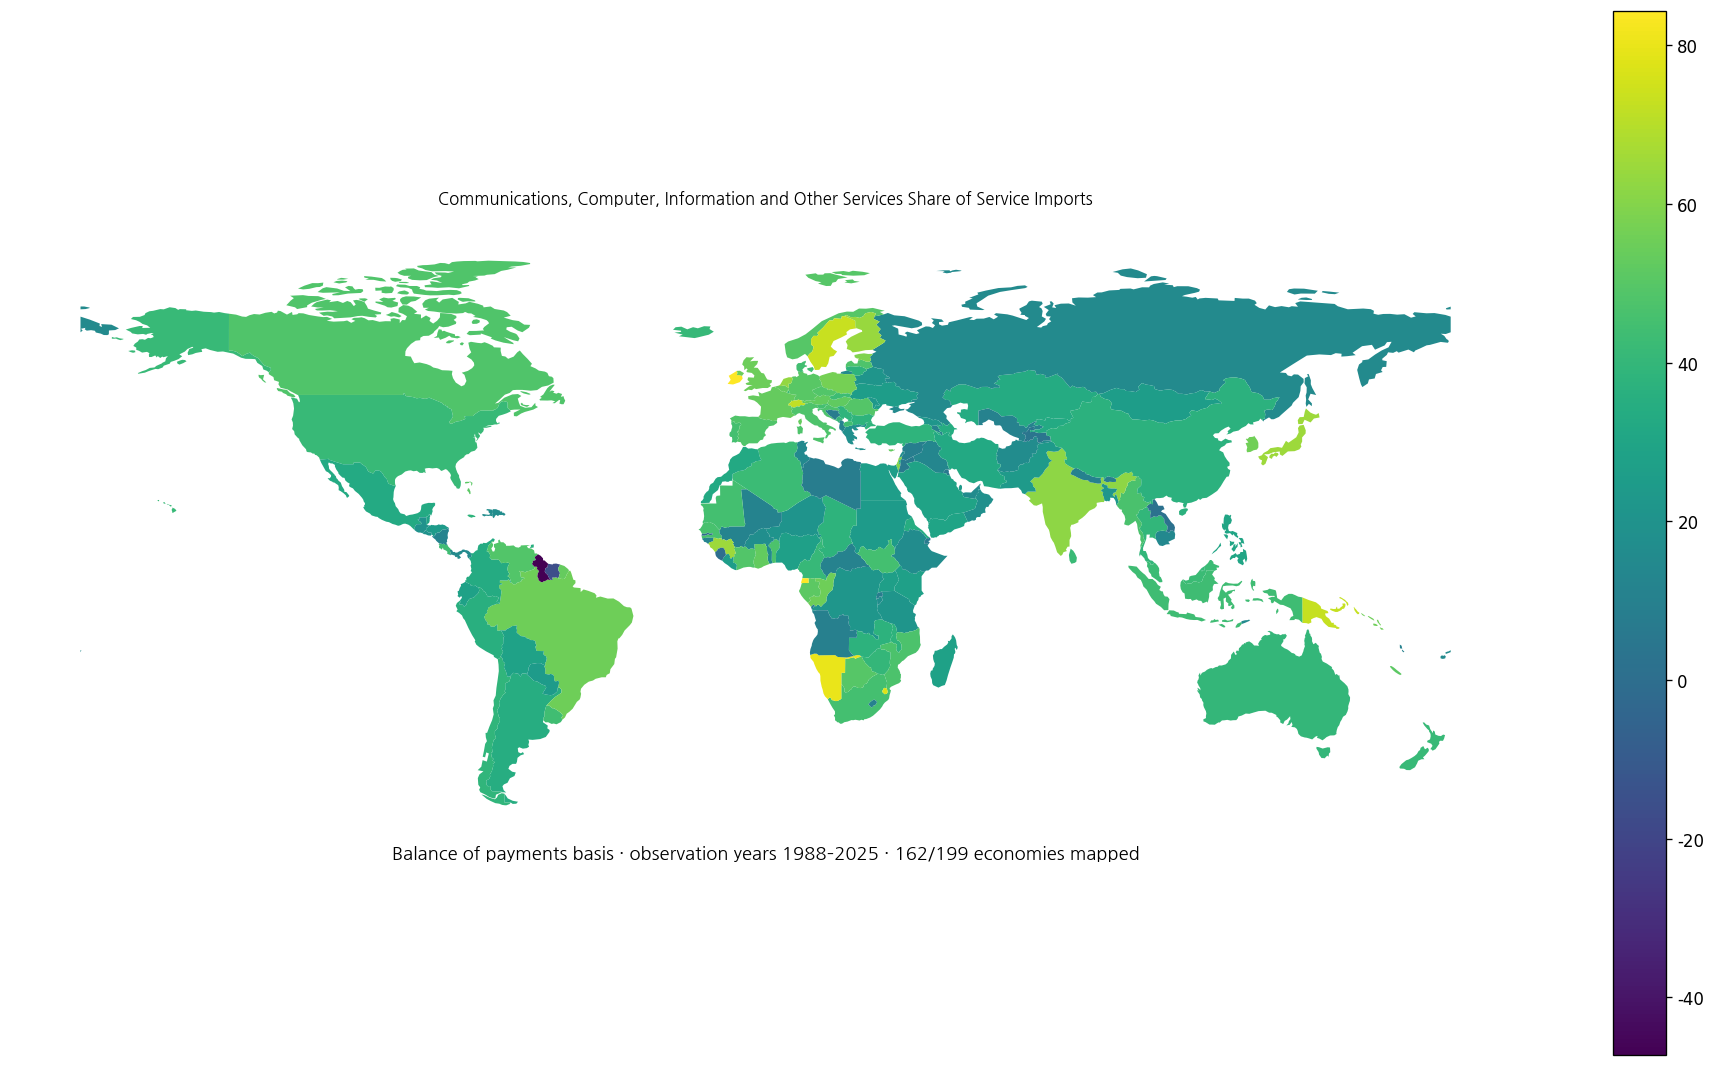
Table of Contents
The category is much broader than ICT services
Despite the communications and computer wording, the World Bank definition covers more than digital or ICT services. It includes international telecommunications, computer data and news-related transactions, but also construction, royalties and license fees, miscellaneous business, professional and technical services, personal, cultural and recreational services, manufacturing services on physical inputs owned by others, maintenance and repair, and government services not included elsewhere.
Calling the series simply an ICT-import share would therefore narrow the meaning too much. It is a broad balance-of-payments service grouping.
The denominator is service imports, not total imports
A 50% value means the combined category accounts for half of service imports. Merchandise imports are outside the denominator.
Travel, transport, insurance and financial services, and other service categories can make up the remainder. The indicator describes the composition of imported services rather than the scale of all imports.
The 2025 mean is 36.19% and the median is 37.75%
The 2025 subset contains 96 economies. Its mean is 36.19% and median 37.75%. The first quartile is 23.67% and the third quartile 48.69%, placing the middle half roughly between 23.67% and 48.69%.
78 economies are at or above 20%, 43 at or above 40%, and 5 at or above 60%. 5 are below 10%, and one 2025 observation is negative.
Sweden is highest in 2025 at 73.27%
Sweden records 73.27%, followed by Switzerland at 71.91%, Japan at 64.96%, Finland at 63.96%, India at 61.70%, Israel at 59.89%, Estonia at 58.83%, and Poland at 56.93%.
| 2025 rank | Economy/territory | Combined service category / service imports |
|---|---|---|
| 1 | Sweden | 73.27% |
| 2 | Switzerland | 71.91% |
| 3 | Japan | 64.96% |
| 4 | Finland | 63.96% |
| 5 | India | 61.70% |
| 6 | Israel | 59.89% |
| 7 | Estonia | 58.83% |
| 8 | Poland | 56.93% |
| 9 | Korea, Rep. | 55.91% |
| 10 | Grenada | 55.54% |
| 11 | Brazil | 55.27% |
| 12 | United Kingdom | 54.54% |
| 13 | France | 53.26% |
| 14 | Singapore | 53.25% |
| 15 | Belgium | 53.16% |
| 16 | Cyprus | 52.85% |
| 17 | Austria | 52.58% |
| 18 | Ghana | 52.56% |
| 19 | Hungary | 52.24% |
| 20 | St. Lucia | 51.88% |
A high share means this broad category occupies a large part of the service-import basket. It does not show that the absolute import value is among the world’s largest, and it should not be converted into a ranking of digital development or technology competitiveness.
Suriname’s -15.99% is a reported observation
Suriname is the lowest 2025 observation at -15.99%, followed by Tajikistan at 3.67%, Kuwait at 5.34%, Bosnia and Herzegovina at 7.44%, and Angola at 9.74%. The negative value is preserved as reported rather than replaced with zero or treated as missing.
| Low-order position in 2025 | Economy/territory | Combined service category / service imports |
|---|---|---|
| 1 | Suriname | -15.99% |
| 2 | Tajikistan | 3.67% |
| 3 | Kuwait | 5.34% |
| 4 | Bosnia and Herzegovina | 7.44% |
| 5 | Angola | 9.74% |
| 6 | Lesotho | 10.16% |
| 7 | Albania | 10.43% |
| 8 | Armenia | 10.61% |
| 9 | Uzbekistan | 11.24% |
| 10 | Cambodia | 14.07% |
| 11 | Panama | 15.08% |
| 12 | Russian Federation | 15.22% |
| 13 | Timor-Leste | 15.37% |
| 14 | Dominican Republic | 16.96% |
| 15 | Burundi | 17.25% |
| 16 | Kiribati | 17.42% |
| 17 | Kosovo | 18.81% |
| 18 | El Salvador | 19.39% |
| 19 | St. Vincent and the Grenadines | 20.04% |
| 20 | Georgia | 21.69% |
The supplied country-level series does not explain the accounting mechanism behind the negative ratio. Determining whether it reflects revisions, offsets, reclassifications, or other balance-of-payments entries requires underlying national documentation, so no specific cause is asserted here.
There are four negative values in the complete latest-observation file
The full file also contains Gambia, The at -1.45% in 2024, Sierra Leone at -0.41% in 2024, and Guyana at -47.25% in 2023. These different-year observations are not combined into a single current ranking.
Their presence is a reminder not to force the indicator into an assumed 0–100% range. Published values should be preserved, with unusual observations interpreted cautiously.
A share is different from an absolute import value
An economy with a small service-import bill can record a 60% share while importing fewer dollars of these services than a large economy with a 30% share.
Absolute values are needed to compare market size. BM.GSR.CMCP.ZS answers a composition question rather than a scale question.
Import and export shares point in opposite transaction directions
Service imports are supplied by nonresidents to residents. Service exports are supplied by residents to nonresidents. A high import share does not imply a high export share.
Looking at both directions can reveal whether an economy is primarily purchasing or supplying particular services internationally, but the two measures should remain separate.
Travel, transport, and financial-service shares provide useful context
Service imports are divided among several categories. Travel shares can reflect spending associated with residents abroad, while transport and insurance or financial services describe other types of cross-border service demand.
Comparing these categories helps explain the structure of a service-import basket, provided the indicators use compatible balance-of-payments definitions and years.
A high value is not a digitalization score
The grouping contains computer and information services, but also construction, professional services, cultural services, repair and maintenance, and government services. The percentage therefore cannot be treated as a direct measure of digital adoption.
Digital development is better assessed with more specific measures such as internet use, ICT service trade, cloud adoption, AI use, or digital infrastructure.
The 2025 group is the largest recent same-year comparison
Of the 199 latest non-empty observations, 96 are from 2025 and 67 from 2024. There are 14 from 2023 and smaller numbers from older years.
Because country composition changes across years, comparing the 2024 and 2025 group averages does not establish a global trend. A trend requires matched economies observed across the same sequence of years.
The 199 latest observations span 1988–2025
The observation years range from 1988 to 2025. Some economies retain very old latest observations that should not be read as direct descriptions of their current service-trade structure.
| Observation year | Economies/territories | Share of 199 |
|---|---|---|
| 2025 | 96 | 48.2% |
| 2024 | 67 | 33.7% |
| 2023 | 14 | 7.0% |
| 2022 | 2 | 1.0% |
| 2021 | 2 | 1.0% |
| 2020 | 2 | 1.0% |
| 2019 | 1 | 0.5% |
| 2018 | 1 | 0.5% |
| 2017 | 1 | 0.5% |
| 2016 | 4 | 2.0% |
| 2015 | 1 | 0.5% |
| 2014 | 1 | 0.5% |
| 2011 | 1 | 0.5% |
| 2010 | 1 | 0.5% |
| 2000 | 2 | 1.0% |
| 1994 | 2 | 1.0% |
| 1988 | 1 | 0.5% |
The complete file is therefore not a single-year 2025 ranking of 199 economies. It is an inventory of each economy’s latest non-empty value.
The featured map displays 162 of the 199 observations
The low-resolution world boundary file matches 162 of the 199 observations, about 81.4%. Small islands and territories without polygons remain available in the complete table.
The map also mixes observation years, so color differences should be read as latest-available patterns rather than a strictly synchronized 2025 comparison.
Complete list of the 199 latest observations
The table below lists each economy or territory’s latest non-empty value alphabetically, with the actual observation year displayed beside the percentage.
| Economy/territory | Observation year | Combined service category / service imports |
|---|---|---|
| Afghanistan | 2020 | 16.29% |
| Albania | 2025 | 10.43% |
| Algeria | 2024 | 42.64% |
| Andorra | 2024 | 40.56% |
| Angola | 2025 | 9.74% |
| Antigua and Barbuda | 2025 | 49.10% |
| Argentina | 2025 | 34.94% |
| Armenia | 2025 | 10.61% |
| Aruba | 2023 | 40.74% |
| Australia | 2025 | 40.06% |
| Austria | 2025 | 52.58% |
| Azerbaijan | 2025 | 34.45% |
| Bahamas, The | 2024 | 50.42% |
| Bahrain | 2024 | 20.91% |
| Bangladesh | 2025 | 22.07% |
| Barbados | 2017 | 70.53% |
| Belarus | 2021 | 21.19% |
| Belgium | 2025 | 53.16% |
| Belize | 2025 | 29.05% |
| Benin | 2023 | 47.01% |
| Bermuda | 2023 | 34.47% |
| Bhutan | 2024 | 8.36% |
| Bolivia | 2025 | 28.40% |
| Bosnia and Herzegovina | 2025 | 7.44% |
| Botswana | 2024 | 49.63% |
| Brazil | 2025 | 55.27% |
| Brunei Darussalam | 2025 | 41.03% |
| Bulgaria | 2025 | 37.95% |
| Burkina Faso | 2024 | 17.28% |
| Burundi | 2025 | 17.25% |
| Cabo Verde | 2025 | 36.80% |
| Cambodia | 2025 | 14.07% |
| Cameroon | 2024 | 40.73% |
| Canada | 2025 | 48.27% |
| Cayman Islands | 2024 | 37.79% |
| Central African Republic | 1994 | 10.44% |
| Chad | 1994 | 37.57% |
| Chile | 2025 | 38.88% |
| China | 2025 | 36.84% |
| Colombia | 2025 | 32.95% |
| Comoros | 2023 | 13.40% |
| Congo, Dem. Rep. | 2025 | 21.84% |
| Congo, Rep. | 2021 | 55.25% |
| Costa Rica | 2025 | 43.59% |
| Cote d’Ivoire | 2024 | 48.72% |
| Croatia | 2024 | 47.01% |
| Curacao | 2023 | 29.27% |
| Cyprus | 2025 | 52.85% |
| Czechia | 2025 | 48.56% |
| Denmark | 2024 | 44.66% |
| Djibouti | 2024 | 7.12% |
| Dominica | 2025 | 43.60% |
| Dominican Republic | 2025 | 16.96% |
| Ecuador | 2025 | 28.15% |
| Egypt, Arab Rep. | 2025 | 26.14% |
| El Salvador | 2025 | 19.39% |
| Equatorial Guinea | 1988 | 84.17% |
| Eritrea | 2000 | 34.56% |
| Estonia | 2025 | 58.83% |
| Eswatini | 2024 | 77.24% |
| Ethiopia | 2024 | 16.45% |
| Faroe Islands | 2011 | 50.91% |
| Fiji | 2024 | 15.28% |
| Finland | 2025 | 63.96% |
| France | 2025 | 53.26% |
| French Polynesia | 2016 | 24.20% |
| Gabon | 2015 | 51.10% |
| Gambia, The | 2024 | -1.45% |
| Georgia | 2025 | 21.69% |
| Germany | 2025 | 50.21% |
| Ghana | 2025 | 52.56% |
| Greece | 2024 | 18.05% |
| Grenada | 2025 | 55.54% |
| Guatemala | 2024 | 19.48% |
| Guinea | 2024 | 64.79% |
| Guinea-Bissau | 2024 | 12.09% |
| Guyana | 2023 | -47.25% |
| Haiti | 2024 | 16.89% |
| Honduras | 2025 | 24.24% |
| Hong Kong SAR, China | 2024 | 12.38% |
| Hungary | 2025 | 52.24% |
| Iceland | 2025 | 40.68% |
| India | 2025 | 61.70% |
| Indonesia | 2025 | 43.38% |
| Iran, Islamic Rep. | 2000 | 32.06% |
| Iraq | 2024 | 13.19% |
| Ireland | 2024 | 84.29% |
| Israel | 2025 | 59.89% |
| Italy | 2025 | 47.39% |
| Jamaica | 2024 | 38.07% |
| Japan | 2025 | 64.96% |
| Jordan | 2024 | 6.11% |
| Kazakhstan | 2025 | 33.29% |
| Kenya | 2024 | 27.19% |
| Kiribati | 2025 | 17.42% |
| Korea, Rep. | 2025 | 55.91% |
| Kosovo | 2025 | 18.81% |
| Kuwait | 2025 | 5.34% |
| Kyrgyz Republic | 2024 | 32.59% |
| Lao PDR | 2024 | 1.64% |
| Latvia | 2025 | 47.56% |
| Lebanon | 2023 | 16.68% |
| Lesotho | 2025 | 10.16% |
| Liberia | 2024 | 25.24% |
| Libya | 2023 | 7.77% |
| Lithuania | 2025 | 37.55% |
| Luxembourg | 2025 | 41.16% |
| Macao SAR, China | 2024 | 35.72% |
| Madagascar | 2024 | 28.15% |
| Malawi | 2024 | 37.54% |
| Malaysia | 2024 | 42.61% |
| Maldives | 2024 | 33.43% |
| Mali | 2024 | 11.71% |
| Malta | 2024 | 75.16% |
| Marshall Islands | 2024 | 27.50% |
| Mauritania | 2024 | 45.13% |
| Mauritius | 2024 | 39.28% |
| Mexico | 2025 | 32.60% |
| Micronesia, Fed. Sts. | 2014 | 2.26% |
| Moldova | 2025 | 22.73% |
| Mongolia | 2024 | 25.44% |
| Montenegro | 2025 | 39.66% |
| Morocco | 2025 | 31.97% |
| Mozambique | 2024 | 46.83% |
| Myanmar | 2019 | 46.27% |
| Namibia | 2024 | 79.83% |
| Naoero | 2024 | 8.10% |
| Nepal | 2024 | 9.79% |
| Netherlands | 2024 | 62.88% |
| New Caledonia | 2016 | 51.38% |
| New Zealand | 2025 | 41.50% |
| Nicaragua | 2024 | 11.51% |
| Niger | 2024 | 20.89% |
| Nigeria | 2025 | 27.11% |
| North Macedonia | 2025 | 44.18% |
| Norway | 2025 | 49.44% |
| Oman | 2024 | 18.41% |
| Pakistan | 2025 | 23.83% |
| Palau | 2023 | 8.75% |
| Panama | 2025 | 15.08% |
| Papua New Guinea | 2024 | 72.63% |
| Paraguay | 2025 | 24.33% |
| Peru | 2025 | 35.54% |
| Philippines | 2025 | 29.90% |
| Poland | 2025 | 56.93% |
| Portugal | 2024 | 45.18% |
| Qatar | 2025 | 23.17% |
| Romania | 2025 | 49.14% |
| Russian Federation | 2025 | 15.22% |
| Rwanda | 2024 | 7.87% |
| Samoa | 2025 | 34.63% |
| San Marino | 2023 | 37.27% |
| Sao Tome and Principe | 2024 | 38.93% |
| Saudi Arabia | 2025 | 29.19% |
| Senegal | 2023 | 46.16% |
| Serbia | 2025 | 38.10% |
| Seychelles | 2024 | 59.23% |
| Sierra Leone | 2024 | -0.41% |
| Singapore | 2025 | 53.25% |
| Sint Maarten (Dutch part) | 2023 | 14.89% |
| Slovak Republic | 2025 | 42.70% |
| Slovenia | 2025 | 44.74% |
| Solomon Islands | 2024 | 55.08% |
| South Africa | 2025 | 44.90% |
| South Sudan | 2023 | 44.93% |
| Spain | 2025 | 47.81% |
| Sri Lanka | 2024 | 41.84% |
| St. Kitts and Nevis | 2025 | 37.55% |
| St. Lucia | 2025 | 51.88% |
| St. Vincent and the Grenadines | 2025 | 20.04% |
| Sudan | 2022 | 24.25% |
| Suriname | 2025 | -15.99% |
| Sweden | 2025 | 73.27% |
| Switzerland | 2025 | 71.91% |
| Syrian Arab Republic | 2010 | 8.30% |
| Tajikistan | 2025 | 3.67% |
| Tanzania | 2024 | 21.21% |
| Thailand | 2025 | 39.08% |
| Timor-Leste | 2025 | 15.37% |
| Togo | 2020 | 15.75% |
| Tonga | 2024 | 31.49% |
| Trinidad and Tobago | 2025 | 35.74% |
| Tunisia | 2024 | 14.46% |
| Turkiye | 2024 | 38.49% |
| Turks and Caicos Islands | 2018 | 1.00% |
| Tuvalu | 2023 | 28.98% |
| Uganda | 2024 | 26.31% |
| Ukraine | 2024 | 25.62% |
| United Arab Emirates | 2024 | 15.85% |
| United Kingdom | 2025 | 54.54% |
| United States | 2025 | 41.29% |
| Uruguay | 2025 | 44.17% |
| Uzbekistan | 2025 | 11.24% |
| Vanuatu | 2022 | 10.23% |
| Venezuela, RB | 2016 | 48.82% |
| West Bank and Gaza | 2025 | 32.39% |
| Yemen, Rep. | 2016 | 29.51% |
| Zambia | 2024 | 37.43% |
| Zimbabwe | 2024 | 39.87% |
How to interpret the comparison
First, the category is broader than ICT services. Second, the denominator is service imports rather than all imports. Third, a percentage is not an absolute trade value. Fourth, imports and exports have opposite transaction directions.
Fifth, negative observations are preserved without unsupported accounting explanations. Sixth, the full 199-row file mixes years, so direct comparison centers on the 96 observations from 2025. Seventh, the series should not be used as a digital-development ranking.
Source and calculation
The source is World Bank World Development Indicators BM.GSR.CMCP.ZS, Communications, computer, etc. (% of service imports, BoP). The 2025 mean, median, quartiles, and rankings use only the 96 observations dated 2025. The map and complete table use each economy’s latest non-empty observation.
Frequently Asked Questions
Is this simply an ICT service-import share?
No. The category also includes construction, professional and technical services, cultural services, repair and maintenance, and other services.
What is the 2025 median?
The median across the 96 observations dated 2025 is 37.75%, while the mean is 36.19%.
Should Suriname’s negative value be replaced with zero?
No. -15.99% is the reported 2025 observation. The accounting reason requires more detailed balance-of-payments documentation.
Related Articles
Green Map creates custom-edited map images using open geographic data sources such as geoBoundaries, Natural Earth, OpenStreetMap, and government open data. These maps are edited visual materials, not raw data files, and are provided for education, documents, presentations, and graphic reference.