World Bank indicator SE.SEC.DURS reports secondary-education duration for 209 countries and economies in 2025 within a 217-economy comparison frame. Eight economies are source-missing and remain no data. Reported values range from 4 to 9 years, with a median of 6 years and an unweighted mean of 6.43. Six years is the most common structure, appearing in 92 economies (44.0%), followed by seven years in 65 (31.1%).
This is a structural education-system indicator, not the average number of years an individual student actually spends in school. The World Bank defines secondary duration as the number of grades or years in secondary school. It therefore differs from completion rates, enrollment rates, school life expectancy, and the legal duration of compulsory education.
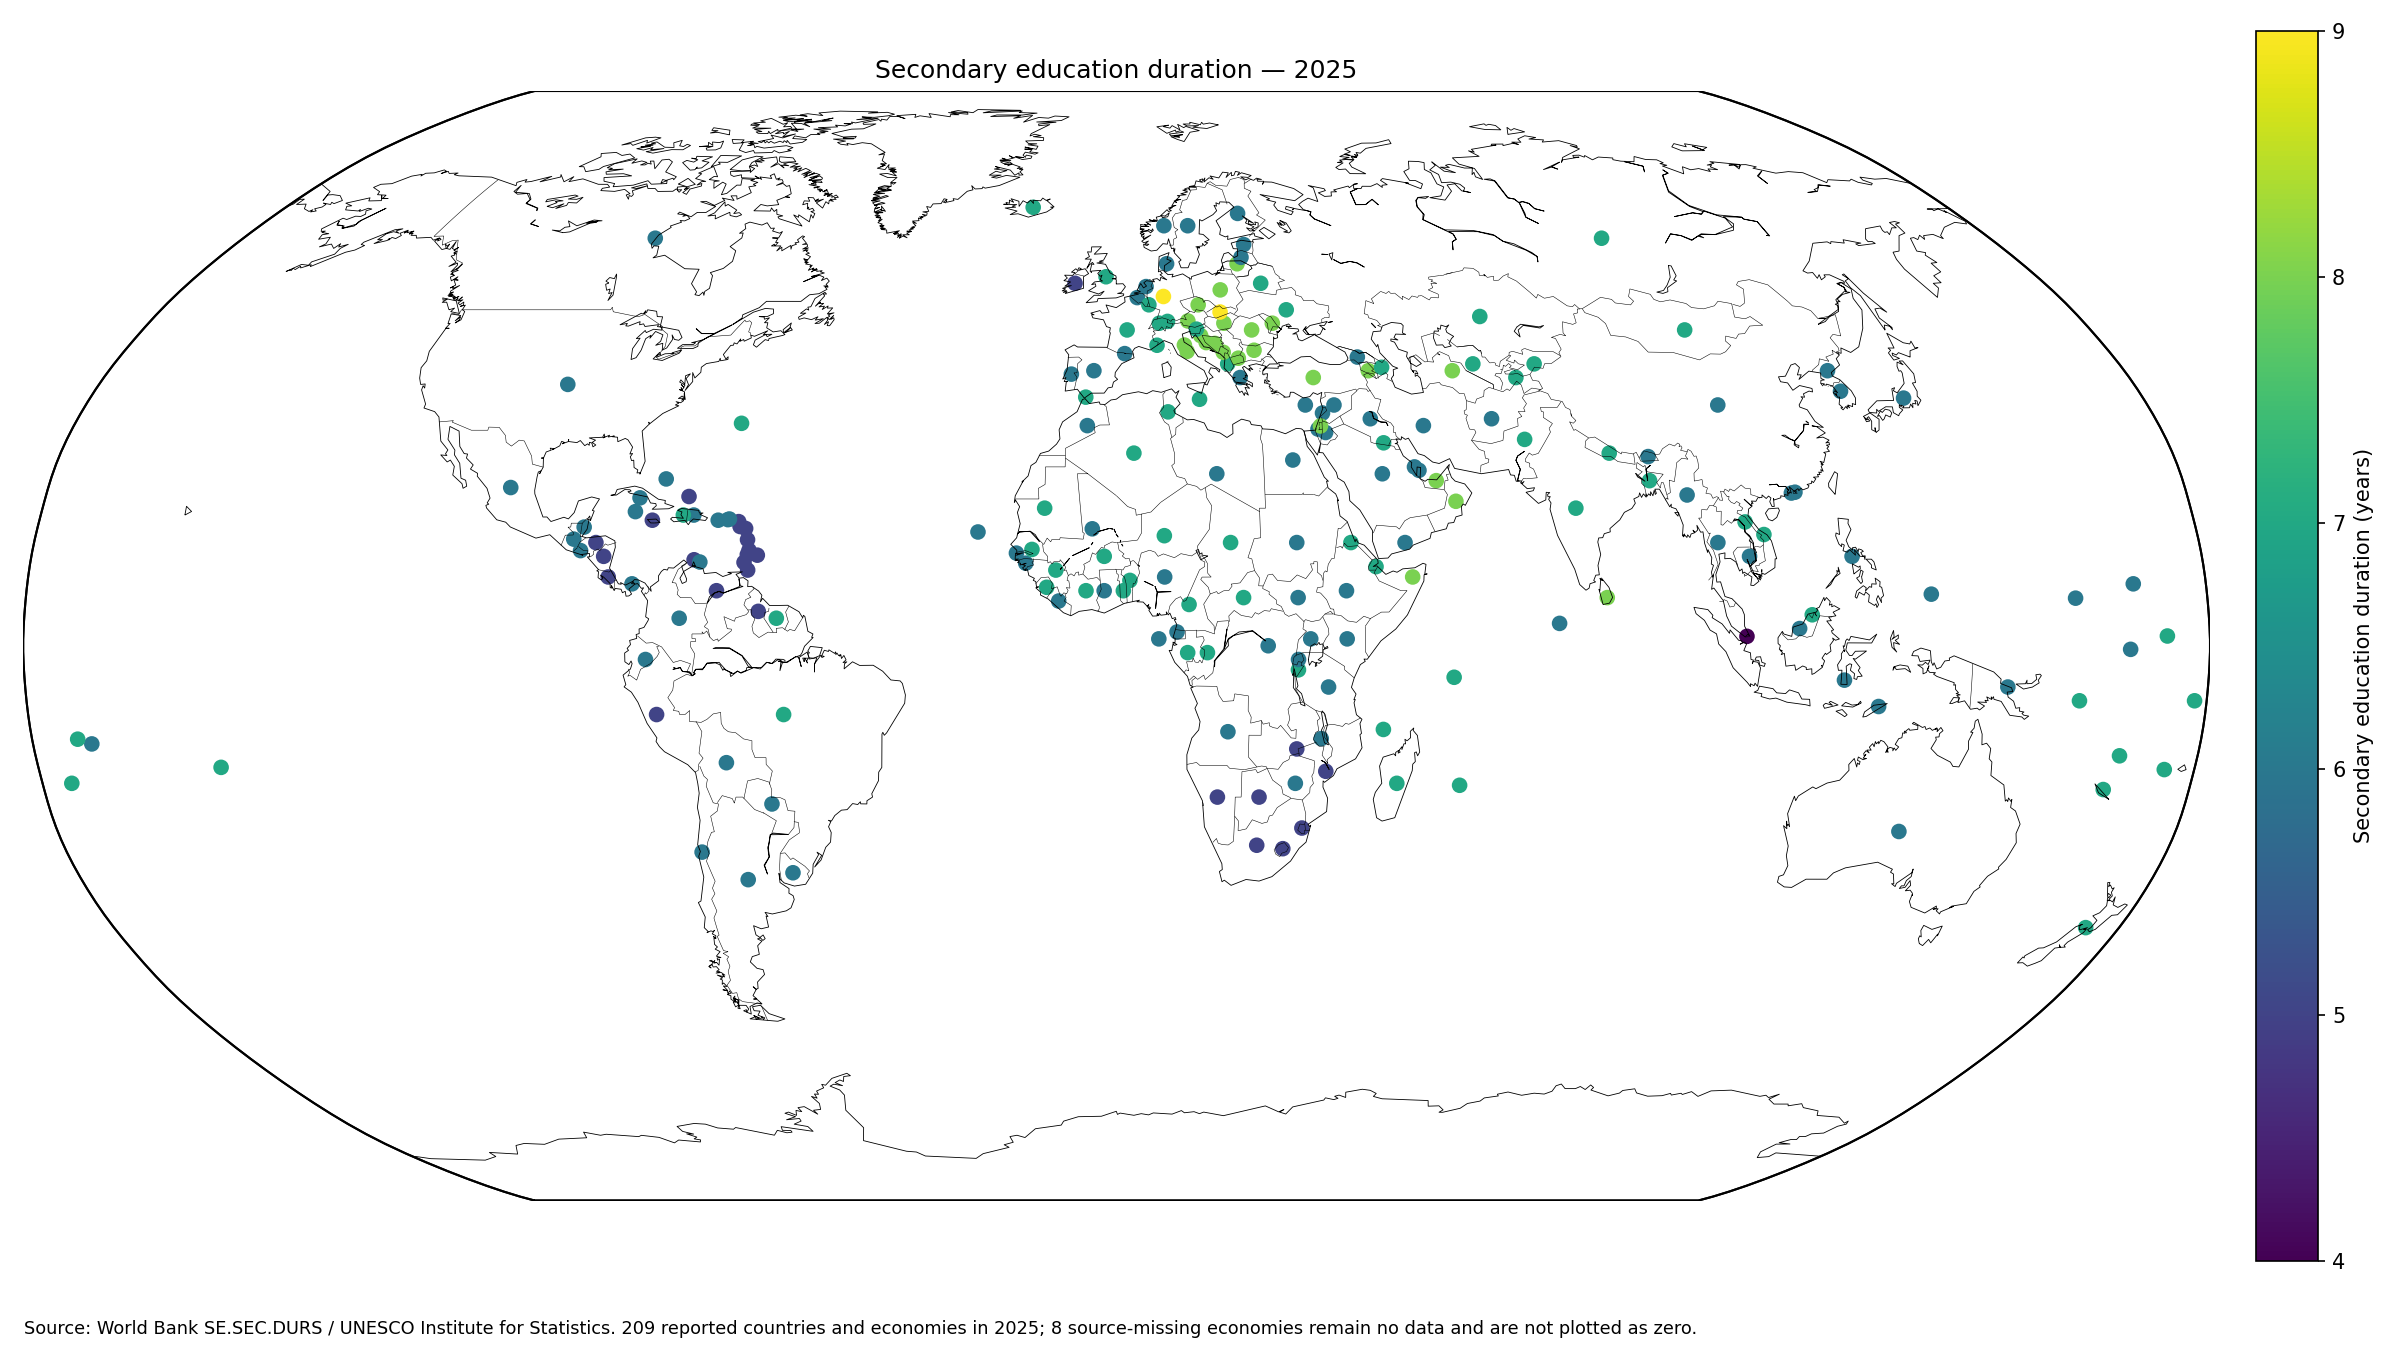
Table of Contents
What secondary education duration measures
The indicator counts the grades assigned to the secondary level in the official education structure. If a system defines six grades as secondary education, the indicator is six years. It does not measure how long a particular student takes to graduate, so repetition, dropout, late entry, or accelerated progression do not directly alter the system-level duration.
The World Bank metadata glossary defines secondary duration as the number of grades in secondary school. The source is the UNESCO Institute for Statistics, and the World Bank API provides the 2025 observations. International comparison is supported by mapping education data to ISCED categories.
Six-year systems are the most common in 2025
Among the 209 reported economies, 92 have six years of secondary education, 65 have seven, 26 have five, 23 have eight, 2 have nine, and 1 has four.
| Secondary duration | Economies | Share of reported values |
|---|---|---|
| 4년 | 1 | 0.5% |
| 5년 | 26 | 12.4% |
| 6년 | 92 | 44.0% |
| 7년 | 65 | 31.1% |
| 8년 | 23 | 11.0% |
| 9년 | 2 | 1.0% |
Six- and seven-year structures together account for 157 of the 209 observations, roughly three-quarters of reported economies. That makes six to seven years the dominant range, but identical duration does not imply identical curriculum, school names, starting ages, or graduation requirements.
Germany and the Slovak Republic report nine years
Germany and the Slovak Republic are the only two 2025 observations at nine years. Twenty-three economies report eight years, including Austria, Czechia, Hungary, Italy, Poland, Romania, Serbia, Turkiye, Armenia, Sri Lanka, and several neighboring systems.
A longer secondary stage should not be read as evidence that students necessarily receive more education overall. The boundary between primary, lower secondary, and upper secondary differs across systems, and the length of the preceding primary stage also matters.
| Country or economy | Secondary duration in 2025 |
|---|---|
| Germany | 9 |
| Slovak Republic | 9 |
| Armenia | 8 |
| Austria | 8 |
| Bosnia and Herzegovina | 8 |
| Bulgaria | 8 |
| Croatia | 8 |
| Czechia | 8 |
| Hungary | 8 |
| Italy | 8 |
| Lithuania | 8 |
| Moldova | 8 |
| Montenegro | 8 |
| North Macedonia | 8 |
| Oman | 8 |
| Poland | 8 |
| Romania | 8 |
| San Marino | 8 |
| Serbia | 8 |
| Somalia, Fed. Rep. | 8 |
| Sri Lanka | 8 |
| Turkiye | 8 |
| Turkmenistan | 8 |
| United Arab Emirates | 8 |
| West Bank and Gaza | 8 |
Singapore is the only four-year observation
Singapore is the single economy with a four-year value in this dataset. Twenty-six economies report five years, including Aruba, Antigua and Barbuda, Barbados, Costa Rica, Ireland, Jamaica, Peru, South Africa, and Zambia.
Shorter secondary duration should not be interpreted as lower educational attainment or weaker educational provision. A system can allocate more grades to primary education or organize post-secondary pathways differently.
| Country or economy | Secondary duration in 2025 |
|---|---|
| Singapore | 4 |
| Antigua and Barbuda | 5 |
| Aruba | 5 |
| Barbados | 5 |
| Botswana | 5 |
| Costa Rica | 5 |
| Dominica | 5 |
| Eswatini | 5 |
| Grenada | 5 |
| Guyana | 5 |
| Honduras | 5 |
| Ireland | 5 |
| Jamaica | 5 |
| Lesotho | 5 |
| Mozambique | 5 |
| Namibia | 5 |
| Nicaragua | 5 |
| Peru | 5 |
| Sint Maarten (Dutch part) | 5 |
| South Africa | 5 |
| St. Kitts and Nevis | 5 |
| St. Lucia | 5 |
| St. Vincent and the Grenadines | 5 |
| Trinidad and Tobago | 5 |
| Turks and Caicos Islands | 5 |
| Venezuela, RB | 5 |
| Zambia | 5 |
The median is six years
The median is 6 years, with a first quartile of 6 years and a third quartile of 7. The middle half of reported economies therefore falls within a very narrow six-to-seven-year range.
The mean of 6.43 years is mathematically useful but less intuitive than the frequency distribution because the underlying variable takes only six integer values. For education-system design, the counts of four-, five-, six-, seven-, eight-, and nine-year structures are more informative.
Secondary duration is not compulsory-education duration
Compulsory-education duration counts the years children are legally required to attend school. Secondary-education duration counts the grades assigned to the secondary level. The two can overlap but are not equivalent.
A country can require schooling through only part of secondary education, through all of it, or beyond a particular stage depending on the legal framework. Comparing the two indicators helps separate school structure from compulsory-attendance law.
It is also different from secondary completion
A seven-year secondary system does not imply that all students complete seven years. Completion indicators describe the share of a population or cohort that finishes a level, whereas duration describes how the level itself is organized.
Enrollment, completion, dropout, learning outcomes, and attainment are needed to evaluate access and performance. The number of official grades alone cannot establish whether a system is effective.
Primary duration matters for the full school structure
Secondary duration is only one part of the school sequence. A country with five years of secondary education may have a longer primary stage, while a country with eight or nine years may place the primary-secondary boundary earlier.
That makes stage definitions important in cross-country comparisons. ISCED mapping provides a common classification framework, but national school names and grade groupings can still look very different.
The indicator broadly covers lower and upper secondary education
Secondary education generally spans lower-secondary and upper-secondary levels in international education classification. National systems may use labels such as middle school, junior secondary, senior secondary, high school, lyceum, college, or other local names.
The indicator should therefore not be interpreted as the length of upper secondary or high school alone. A separate upper-secondary-duration measure would be needed for that narrower question.
A common 2025 reference year improves comparability
All 209 numeric observations in this dataset refer to 2025. Unlike latest-value datasets that mix many observation years, this package avoids the problem of comparing a decade-old school structure with a current one.
Education reforms can still be transitional. A newly enacted structure may be introduced grade by grade, so detailed policy analysis may require national education-ministry documents in addition to the annual international indicator.
Eight missing economies are not zero-year systems
Eight of the 217 master rows have no numeric 2025 observation: Channel Islands, Faroe Islands, Greenland, Guam, Isle of Man, St. Martin (French part), Northern Mariana Islands, and Kosovo.
No data does not mean no secondary education. The missing rows are excluded from the mean, median, frequency table, and mapped values rather than being converted to zero.
| Economy | 2025 status |
|---|---|
| Channel Islands | No data |
| Faroe Islands | No data |
| Greenland | No data |
| Guam | No data |
| Isle of Man | No data |
| Kosovo | No data |
| Northern Mariana Islands | No data |
| St. Martin (French part) | No data |
The map reveals regional groupings without proving a cause
Eight- and nine-year structures appear relatively often across parts of Central and Eastern Europe, while five-year structures are visible in several Caribbean economies, parts of Southern Africa, and selected Latin American systems. Six and seven years are widespread across nearly every region.
Those clusters may reflect shared institutional histories or regional education traditions, but this single indicator cannot establish why a system has a particular duration. Education laws and ISCED mapping notes are needed for causal or institutional interpretation.
Longer duration does not mean higher education spending
The number of grades says nothing directly about spending per student, teacher salaries, school infrastructure, classroom size, or vocational-program intensity. Two six-year systems can have very different resource levels.
Government education expenditure, spending per student, pupil-teacher ratios, and capital spending are better measures for questions about education investment.
Longer duration is not a learning-outcome ranking
A system with nine secondary grades is not automatically better than one with five or six. Learning depends on curriculum quality, attendance, teacher effectiveness, school resources, household conditions, and many other factors.
The map should therefore be read as a structural comparison, not as a league table of education quality. It describes how systems divide schooling into stages.
The distribution matters more than a country average
The 6.43-year mean compresses a discrete institutional variable into one decimal number. In practice, the key fact is that 92 economies use six years and 65 use seven, while only three observations sit at the extremes of four or nine years.
For structural indicators built from whole grades, the mode, median, and frequency by duration are usually more interpretable than a global mean alone.
Source and calculation notes
The source is World Bank World Development Indicators series SE.SEC.DURS, based on UNESCO Institute for Statistics data. The 2025 master frame contains 217 countries and economies, with 209 numeric observations and 8 source-missing rows. The official World Bank API provides the series.
All 209 reported country codes are joined to geographic centroids for the map, producing a 100% match. Missing economies remain no data and are not converted to zero.
Frequently Asked Questions
Does secondary education duration measure how long students actually stay in school?
No. It measures the number of official grades assigned to secondary education in the education system.
Is secondary duration the same as compulsory-education duration?
No. Secondary duration describes school structure, while compulsory duration describes the number of years children are legally required to attend school.
Are the eight missing economies counted as zero years?
No. They remain source-missing and are excluded from the statistics and mapped values.
Related Articles
Green Map creates custom-edited map images using open geographic data sources such as geoBoundaries, Natural Earth, OpenStreetMap, and government open data. These maps are edited visual materials, not raw data files, and are provided for education, documents, presentations, and graphic reference.