Medium- and high-tech manufacturing value added measures the share of total manufacturing value added generated by industries classified in the medium- and high-technology group. The World Bank NV.MNF.TECH.ZS.UN series contains 153 latest non-empty observations. 152 are dated 2022 and only Libya is from 2021, so the country comparison is effectively a same-year 2022 dataset.
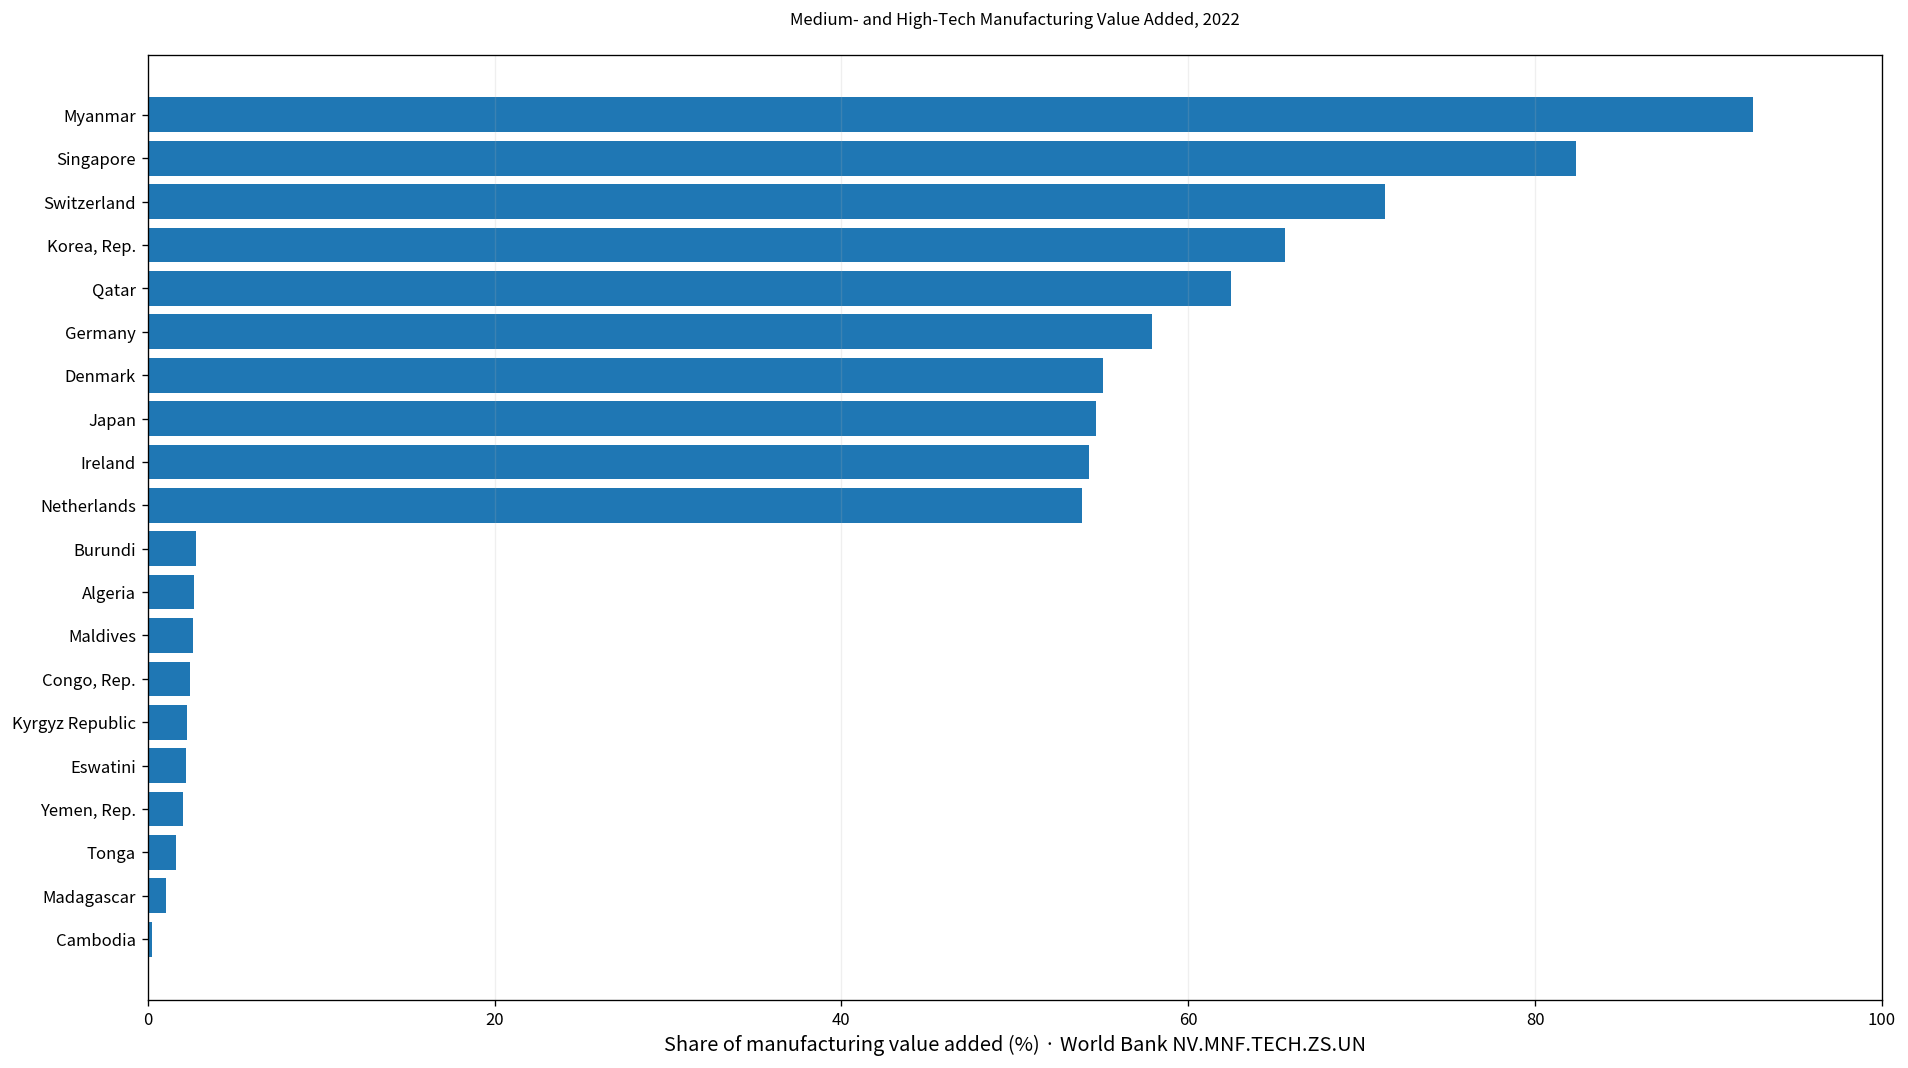
Table of Contents
What the indicator measures
The numerator is value added generated by medium- and high-tech manufacturing, while the denominator is total manufacturing value added. A value of 40% therefore means that about two-fifths of manufacturing value added comes from the medium- and high-tech group. It does not measure manufacturing as a share of GDP, the absolute size of manufacturing, or the value of high-tech exports.
The denominator matters. An economy with a relatively small manufacturing sector can still record a high percentage if its manufacturing activity is concentrated in technology-intensive industries. A large manufacturing economy can show a lower percentage when food, textiles, basic materials, or other manufacturing categories account for more of its manufacturing value added.
Almost the entire dataset is from 2022
The latest-observation set contains 153 economies and territories. 152 are from 2022, while Libya has a 2021 value of 16.06%. Because only one row is from an earlier year, year mismatch is much less important here than in many latest-value international datasets.
Across the 152 observations dated 2022, the mean is 24.56% and the median 21.67%. The first quartile is 9.50% and the third quartile 36.80%, putting the middle half of economies between roughly 9.5% and 36.8%.
Myanmar is highest in 2022 at 92.58%
Myanmar records 92.58%, followed by Singapore at 82.33% and Switzerland at 71.37%. They are the only three observations above 70%. The next group includes Korea, Rep. at 65.57%, Qatar at 62.46%, Germany at 57.92%, Denmark at 55.08%, Japan at 54.67%, Ireland at 54.26%, and the Netherlands at 53.88%.
| 2022 rank | Economy/territory | Medium- and high-tech share of manufacturing value added |
|---|---|---|
| 1 | Myanmar | 92.58% |
| 2 | Singapore | 82.33% |
| 3 | Switzerland | 71.37% |
| 4 | Korea, Rep. | 65.57% |
| 5 | Qatar | 62.46% |
| 6 | Germany | 57.92% |
| 7 | Denmark | 55.08% |
| 8 | Japan | 54.67% |
| 9 | Ireland | 54.26% |
| 10 | Netherlands | 53.88% |
| 11 | Hungary | 51.51% |
| 12 | Belgium | 51.23% |
| 13 | France | 50.39% |
| 14 | Sweden | 49.93% |
| 15 | Czechia | 49.91% |
13 observations are at least 50% and 30 are at least 40%. A high share means technology-intensive manufacturing categories account for a large part of manufacturing value added. It does not automatically mean that R&D intensity, patent output, digital competitiveness, labor productivity, or overall innovation performance is equally high.
Cambodia is lowest in 2022 at 0.26%
Cambodia records 0.26%, followed by Madagascar at 1.04%, Tonga at 1.61%, Yemen, Rep. at 2.06%, Eswatini at 2.23%, Kyrgyz Republic at 2.27%, Congo, Rep. at 2.42%, Maldives at 2.63%, Algeria at 2.69%, and Burundi at 2.79%.
| Low-order position in 2022 | Economy/territory | Medium- and high-tech share of manufacturing value added |
|---|---|---|
| 1 | Cambodia | 0.26% |
| 2 | Madagascar | 1.04% |
| 3 | Tonga | 1.61% |
| 4 | Yemen, Rep. | 2.06% |
| 5 | Eswatini | 2.23% |
| 6 | Kyrgyz Republic | 2.27% |
| 7 | Congo, Rep. | 2.42% |
| 8 | Maldives | 2.63% |
| 9 | Algeria | 2.69% |
| 10 | Burundi | 2.79% |
| 11 | Tajikistan | 2.82% |
| 12 | Brunei Darussalam | 3.32% |
| 13 | Angola | 3.56% |
| 14 | Malawi | 3.67% |
| 15 | Lao PDR | 3.77% |
40 observations are below 10% and 17 are below 5%. A low share indicates that other manufacturing categories account for most manufacturing value added. It should not be treated as proof that manufacturing is uncompetitive: food processing, textiles, resource processing, and other sectors can be economically important while falling outside the medium- and high-tech group.
The median of 21.67% is more representative than the extremes
The 2022 median is 21.67%. 68 economies are at or above 25%, and 30 are at or above 40%. Although the upper tail reaches above 90%, a large part of the distribution sits in the 10% to 40% range.
Looking at the median and quartiles prevents the very high observations from dominating the interpretation. The featured image keeps all bars on the same 0–100% scale so the distance between the highest and lowest groups can be read directly.
This is not manufacturing value added as a share of GDP
Manufacturing value added as a share of GDP asks how large manufacturing is relative to the whole economy. The current indicator asks how manufacturing value added is distributed within manufacturing, specifically how much belongs to the medium- and high-tech group. The two denominators are completely different.
A country can have a small manufacturing share of GDP but a high medium- and high-tech share within that sector. Another can have a large manufacturing sector dominated by lower-tech or resource-based activities and therefore a lower value on this indicator. Both measures are useful, but they answer different structural questions.
It is also not an absolute measure of manufacturing scale
A high percentage does not show that an economy has one of the world’s largest medium- and high-tech manufacturing sectors in absolute monetary terms. Because the denominator is each economy’s own manufacturing value added, a small manufacturing base can generate a high percentage with a comparatively small absolute amount.
To compare scale, the percentage should be paired with manufacturing value added in currency terms or with an absolute estimate of medium- and high-tech manufacturing value added. This indicator is primarily a measure of composition rather than size.
Production structure and export structure are different
The indicator describes the industrial composition of domestic manufacturing value added. High-technology exports and the technological composition of manufactured exports instead describe goods crossing borders. Domestic production structure and export structure can be related, but they are not interchangeable.
An economy can produce technology-intensive goods mainly for its domestic market, or it can export high-tech products with substantial imported intermediate inputs. Trade competitiveness therefore requires separate export, import, and domestic-value-added evidence.
Libya’s 2021 observation is kept out of the 2022 ranking
Libya is the only economy whose latest value is not from 2022; its 2021 observation is 16.06%. It remains in the complete latest-observation table but is excluded from the 2022 mean and rankings so the main comparison stays same-year.
The absence of a 2022 value is not the same as a zero. No value is interpolated or zero-filled. The original observation year is retained, which makes the comparison transparent.
Complete list of 153 latest observations
The table below lists each economy and territory in alphabetical order. All rows except Libya are dated 2022, making this one of the more temporally consistent country datasets for a manufacturing-structure comparison.
| Economy/territory | Observation year | Medium- and high-tech share of manufacturing value added |
|---|---|---|
| Afghanistan | 2022 | 8.46% |
| Albania | 2022 | 5.23% |
| Algeria | 2022 | 2.69% |
| Angola | 2022 | 3.56% |
| Argentina | 2022 | 27.71% |
| Armenia | 2022 | 6.45% |
| Australia | 2022 | 29.13% |
| Austria | 2022 | 45.95% |
| Azerbaijan | 2022 | 17.96% |
| Bahamas, The | 2022 | 27.77% |
| Bahrain | 2022 | 24.63% |
| Bangladesh | 2022 | 7.81% |
| Barbados | 2022 | 38.11% |
| Belarus | 2022 | 19.82% |
| Belgium | 2022 | 51.23% |
| Belize | 2022 | 18.46% |
| Bermuda | 2022 | 7.71% |
| Bolivia | 2022 | 11.94% |
| Bosnia and Herzegovina | 2022 | 16.92% |
| Botswana | 2022 | 28.69% |
| Brazil | 2022 | 31.34% |
| Brunei Darussalam | 2022 | 3.32% |
| Bulgaria | 2022 | 36.66% |
| Burundi | 2022 | 2.79% |
| Cabo Verde | 2022 | 27.10% |
| Cambodia | 2022 | 0.26% |
| Cameroon | 2022 | 7.61% |
| Canada | 2022 | 31.94% |
| Central African Republic | 2022 | 9.25% |
| Chile | 2022 | 20.37% |
| China | 2022 | 41.45% |
| Colombia | 2022 | 24.19% |
| Congo, Rep. | 2022 | 2.42% |
| Costa Rica | 2022 | 14.16% |
| Cote d’Ivoire | 2022 | 14.99% |
| Croatia | 2022 | 25.61% |
| Cuba | 2022 | 16.22% |
| Cyprus | 2022 | 27.68% |
| Czechia | 2022 | 49.91% |
| Denmark | 2022 | 55.08% |
| Ecuador | 2022 | 13.89% |
| Egypt, Arab Rep. | 2022 | 18.79% |
| El Salvador | 2022 | 19.13% |
| Eritrea | 2022 | 10.20% |
| Estonia | 2022 | 26.90% |
| Eswatini | 2022 | 2.23% |
| Ethiopia | 2022 | 16.07% |
| Fiji | 2022 | 8.53% |
| Finland | 2022 | 45.71% |
| France | 2022 | 50.39% |
| Gabon | 2022 | 5.39% |
| Gambia, The | 2022 | 3.90% |
| Georgia | 2022 | 13.06% |
| Germany | 2022 | 57.92% |
| Ghana | 2022 | 10.84% |
| Greece | 2022 | 25.38% |
| Guatemala | 2022 | 22.40% |
| Haiti | 2022 | 5.26% |
| Honduras | 2022 | 7.16% |
| Hong Kong SAR, China | 2022 | 39.75% |
| Hungary | 2022 | 51.51% |
| Iceland | 2022 | 13.90% |
| India | 2022 | 41.56% |
| Indonesia | 2022 | 29.82% |
| Iran, Islamic Rep. | 2022 | 36.38% |
| Iraq | 2022 | 5.25% |
| Ireland | 2022 | 54.26% |
| Israel | 2022 | 49.07% |
| Italy | 2022 | 41.91% |
| Jamaica | 2022 | 18.77% |
| Japan | 2022 | 54.67% |
| Jordan | 2022 | 20.06% |
| Kazakhstan | 2022 | 17.52% |
| Kenya | 2022 | 15.05% |
| Korea, Rep. | 2022 | 65.57% |
| Kuwait | 2022 | 31.92% |
| Kyrgyz Republic | 2022 | 2.27% |
| Lao PDR | 2022 | 3.77% |
| Latvia | 2022 | 20.93% |
| Lebanon | 2022 | 14.56% |
| Libya | 2021 | 16.06% |
| Lithuania | 2022 | 35.68% |
| Luxembourg | 2022 | 23.61% |
| Macao SAR, China | 2022 | 7.96% |
| Madagascar | 2022 | 1.04% |
| Malawi | 2022 | 3.67% |
| Malaysia | 2022 | 44.59% |
| Maldives | 2022 | 2.63% |
| Malta | 2022 | 39.09% |
| Mauritius | 2022 | 5.24% |
| Mexico | 2022 | 42.37% |
| Moldova | 2022 | 18.86% |
| Mongolia | 2022 | 4.30% |
| Montenegro | 2022 | 14.86% |
| Morocco | 2022 | 28.27% |
| Mozambique | 2022 | 10.89% |
| Myanmar | 2022 | 92.58% |
| Namibia | 2022 | 5.34% |
| Nepal | 2022 | 10.52% |
| Netherlands | 2022 | 53.88% |
| New Zealand | 2022 | 23.82% |
| Nicaragua | 2022 | 13.03% |
| Niger | 2022 | 18.25% |
| Nigeria | 2022 | 33.44% |
| North Macedonia | 2022 | 32.91% |
| Norway | 2022 | 40.86% |
| Oman | 2022 | 45.02% |
| Pakistan | 2022 | 22.90% |
| Panama | 2022 | 6.48% |
| Papua New Guinea | 2022 | 12.61% |
| Paraguay | 2022 | 21.83% |
| Peru | 2022 | 13.53% |
| Philippines | 2022 | 28.95% |
| Poland | 2022 | 32.99% |
| Portugal | 2022 | 26.52% |
| Qatar | 2022 | 62.46% |
| Romania | 2022 | 40.01% |
| Russian Federation | 2022 | 34.87% |
| Rwanda | 2022 | 7.20% |
| Saudi Arabia | 2022 | 29.05% |
| Senegal | 2022 | 26.81% |
| Serbia | 2022 | 26.84% |
| Singapore | 2022 | 82.33% |
| Slovak Republic | 2022 | 46.74% |
| Slovenia | 2022 | 37.23% |
| South Africa | 2022 | 24.43% |
| Spain | 2022 | 37.81% |
| Sri Lanka | 2022 | 9.02% |
| St. Lucia | 2022 | 7.83% |
| Suriname | 2022 | 11.53% |
| Sweden | 2022 | 49.93% |
| Switzerland | 2022 | 71.37% |
| Syrian Arab Republic | 2022 | 21.52% |
| Tajikistan | 2022 | 2.82% |
| Tanzania | 2022 | 6.64% |
| Thailand | 2022 | 41.36% |
| Tonga | 2022 | 1.61% |
| Trinidad and Tobago | 2022 | 39.38% |
| Tunisia | 2022 | 27.57% |
| Turkiye | 2022 | 33.82% |
| Uganda | 2022 | 11.07% |
| Ukraine | 2022 | 28.35% |
| United Arab Emirates | 2022 | 39.18% |
| United Kingdom | 2022 | 40.75% |
| United States | 2022 | 44.08% |
| Uruguay | 2022 | 18.23% |
| Uzbekistan | 2022 | 17.63% |
| Venezuela, RB | 2022 | 34.28% |
| Viet Nam | 2022 | 38.70% |
| West Bank and Gaza | 2022 | 7.21% |
| Yemen, Rep. | 2022 | 2.06% |
| Zambia | 2022 | 9.73% |
| Zimbabwe | 2022 | 9.59% |
How to interpret the comparison
First, the indicator is the share of manufacturing value added produced by medium- and high-tech manufacturing. Second, it is not the manufacturing share of GDP or the high-tech export share. Third, a high percentage indicates a technology-intensive manufacturing composition but is not a comprehensive innovation score.
Fourth, percentages do not reveal the absolute size of manufacturing. Fifth, country industrial statistics and classifications can be revised, so detailed country analysis should pair the ratio with updated manufacturing value-added, industry, trade, productivity, and R&D data.
Source and calculation
The source is World Bank World Development Indicators NV.MNF.TECH.ZS.UN, Medium and high-tech manufacturing value added (% manufacturing value added). The 2022 mean, median, quartiles, threshold counts, and rankings are calculated from the 152 observations dated 2022.
Frequently Asked Questions
Is this the same as manufacturing value added as a share of GDP?
No. It measures the medium- and high-tech share within manufacturing value added, not manufacturing's share of the whole economy.
What is the 2022 median?
The median across the 152 observations dated 2022 is 21.67%, while the mean is 24.56%.
Does a high share mean the absolute high-tech manufacturing sector is large?
Not necessarily. This is a within-manufacturing percentage, so an economy with a small manufacturing base can still record a high share.
Related Articles
Green Map creates custom-edited map images using open geographic data sources such as geoBoundaries, Natural Earth, OpenStreetMap, and government open data. These maps are edited visual materials, not raw data files, and are provided for education, documents, presentations, and graphic reference.