Travel services as a share of commercial service exports measures how much of an economy’s commercial service exports comes from goods and services acquired by nonresidents during visits to that economy. The World Bank TX.VAL.TRVL.ZS.WT file contains 198 latest non-empty observations. Recent coverage is strong: 96 observations are from 2025 and 67 from 2024. The map uses each economy’s latest value, while the main country comparison uses the 96 same-year observations from 2025.
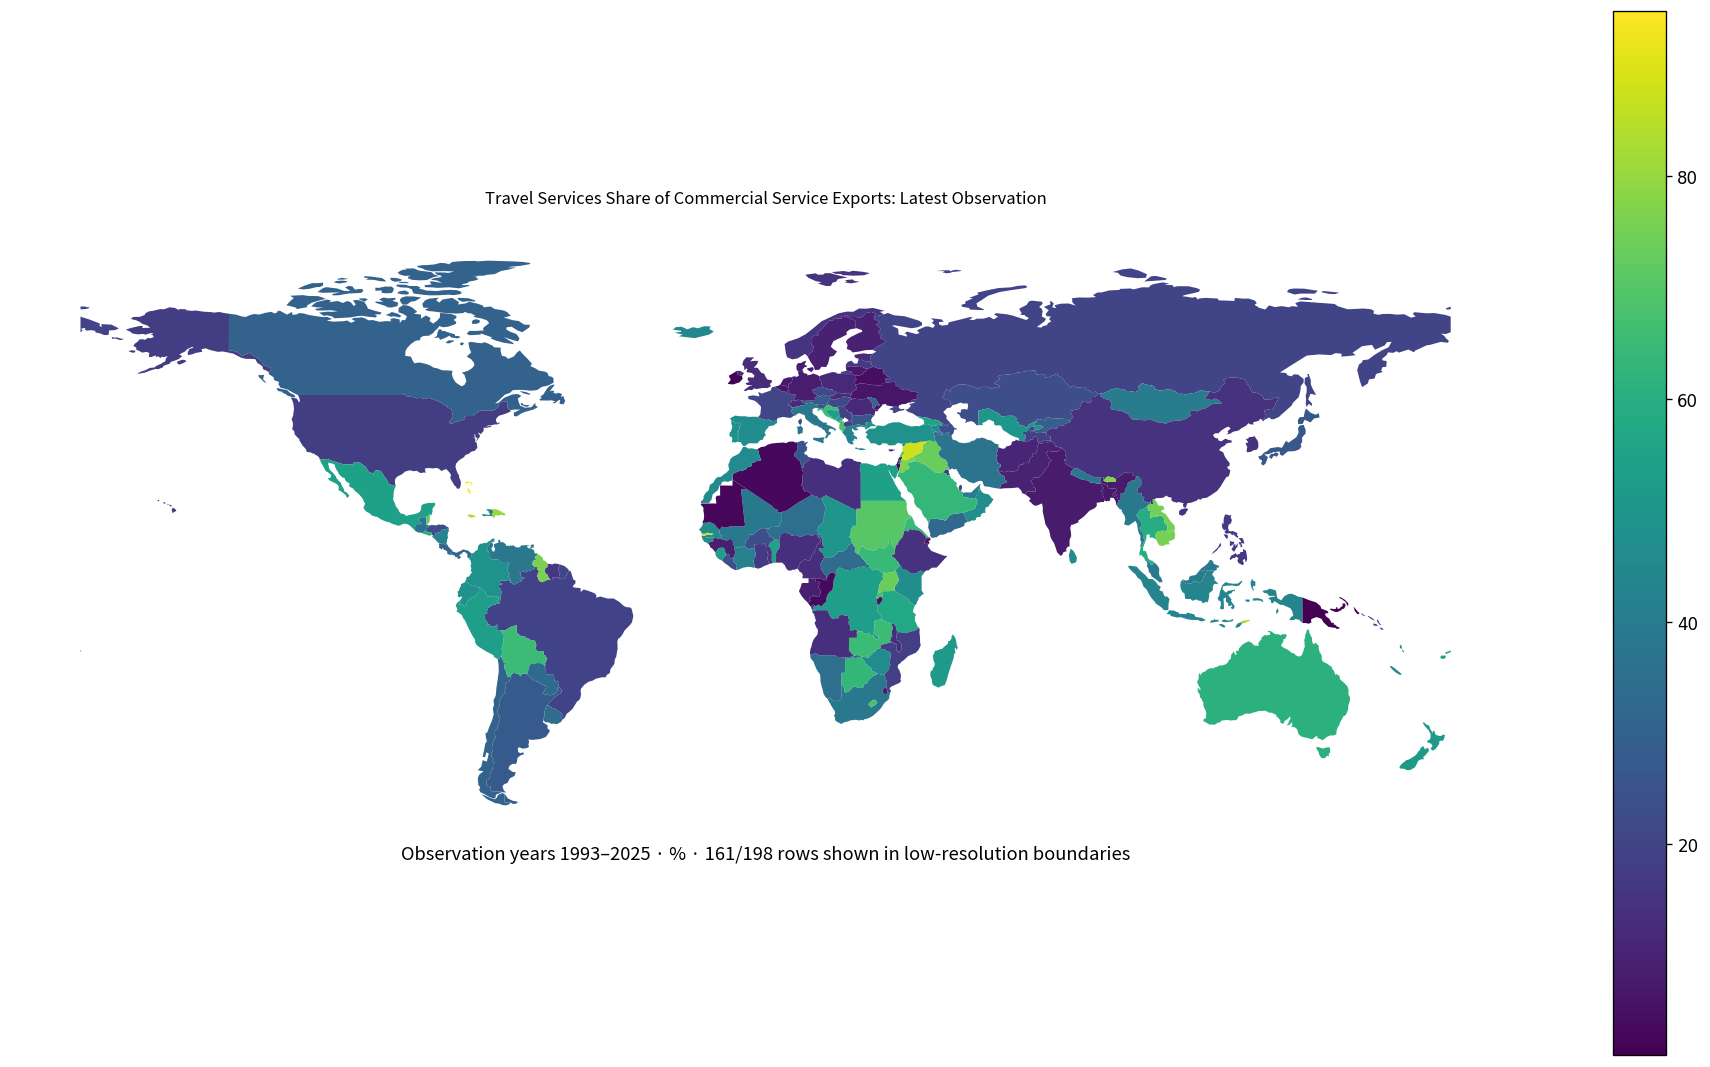
Table of Contents
The denominator is commercial service exports, not total exports
A 60% value does not mean travel accounts for 60% of all exports of goods and services. The denominator is commercial service exports. The indicator describes the composition of service trade rather than the composition of the entire export economy.
To measure tourism’s role in the whole economy, other indicators are needed, such as tourism’s contribution to GDP, tourism employment, or international tourism receipts relative to GDP. This measure answers a narrower question about the structure of exported services.
Travel-services exports are not the same as visitor arrivals
The indicator is not a count of tourists or border arrivals. It reflects travel-related goods and services acquired by nonresidents during visits. Two economies with similar visitor counts can have different travel-service export values and shares if visitors stay for different lengths of time or spend differently.
It is also a percentage rather than an absolute monetary value. A small service-exporting economy can have a very high share while exporting fewer travel services in dollar terms than a large economy with a lower share.
The 2025 mean is 36.14% and the median is 30.21%
The 2025 subset contains 96 economies. Its mean is 36.14% and median 30.21%. The first quartile is 15.61% and the third quartile 53.58%, so the middle half lies roughly between 15.6% and 53.6%.
54 observations are at least 25%, 29 are at least 50%, 10 are at least 75%, and 1 reaches 90% or more. At the lower end, 12 are below 10%.
St. Lucia is highest in 2025 at 93.46%
St. Lucia records 93.46%, followed by Grenada at 88.92%, St. Vincent and the Grenadines at 85.46%, Antigua and Barbuda at 84.41%, St. Kitts and Nevis at 83.78%, Timor-Leste at 82.69%, Cabo Verde at 80.28%, and the Dominican Republic at 80.25%.
| 2025 rank | Economy/territory | Travel services / commercial service exports |
|---|---|---|
| 1 | St. Lucia | 93.46% |
| 2 | Grenada | 88.92% |
| 3 | St. Vincent and the Grenadines | 85.46% |
| 4 | Antigua and Barbuda | 84.41% |
| 5 | St. Kitts and Nevis | 83.78% |
| 6 | Timor-Leste | 82.69% |
| 7 | Cabo Verde | 80.28% |
| 8 | Dominican Republic | 80.25% |
| 9 | Kosovo | 75.67% |
| 10 | Cambodia | 75.24% |
| 11 | Samoa | 72.90% |
| 12 | Dominica | 72.32% |
| 13 | Belize | 71.15% |
| 14 | Albania | 68.09% |
| 15 | Lesotho | 67.24% |
Several small Caribbean economies appear near the top. The indicator directly shows that travel occupies a large share of their commercial service exports. It does not by itself measure the absolute size of the tourism industry or its share of total GDP.
Israel is lowest in 2025 at 3.45%
At the lower end, Israel records 3.45%, Burundi 4.17%, Luxembourg 4.26%, Belgium 6.00%, Singapore 6.51%, Bangladesh 7.12%, Lithuania 7.16%, India 7.70%, Germany 8.37%, and Sweden 9.54%.
| Low-order position in 2025 | Economy/territory | Travel services / commercial service exports |
|---|---|---|
| 1 | Israel | 3.45% |
| 2 | Burundi | 4.17% |
| 3 | Luxembourg | 4.26% |
| 4 | Belgium | 6.00% |
| 5 | Singapore | 6.51% |
| 6 | Bangladesh | 7.12% |
| 7 | Lithuania | 7.16% |
| 8 | India | 7.70% |
| 9 | Germany | 8.37% |
| 10 | Sweden | 9.54% |
| 11 | Finland | 9.68% |
| 12 | Pakistan | 9.96% |
| 13 | Romania | 11.55% |
| 14 | Poland | 11.88% |
| 15 | Estonia | 12.06% |
A low share means travel is a small part of commercial service exports. Transport, finance, telecommunications, information, business services, or other categories may account for larger shares. It does not necessarily mean that few tourists visit the economy.
The 2024 group has a mean of 42.29%
The 2024 subset contains 67 economies, with a mean of 42.29% and a median of 41.76%. The highest values are Maldives at 95.34%, Bahamas, The at 94.84%, Sao Tome and Principe at 94.48%, Gambia, The at 89.80%, and Macao SAR, China at 89.45%.
| 2024 high-order position | Economy/territory | Travel services / commercial service exports |
|---|---|---|
| 1 | Maldives | 95.34% |
| 2 | Bahamas, The | 94.84% |
| 3 | Sao Tome and Principe | 94.48% |
| 4 | Gambia, The | 89.80% |
| 5 | Macao SAR, China | 89.45% |
| 6 | Andorra | 85.15% |
| 7 | Jamaica | 82.57% |
| 8 | Bhutan | 77.45% |
| 9 | Jordan | 76.70% |
| 10 | Lao PDR | 74.95% |
| 11 | Uganda | 73.38% |
| 12 | Iraq | 73.34% |
The higher 2024 average does not demonstrate a one-year global decline in 2025. The two annual groups contain different economies. A time trend requires repeated observations for the same countries.
The 198 latest observations span 1993–2025
The latest-observation file ranges from 1993 to 2025. Most rows are recent—96 from 2025, 67 from 2024, and 13 from 2023—but several economies retain older final observations from the 1990s or 2000s.
| Observation year | Economies/territories | Share of 198 |
|---|---|---|
| 2025 | 96 | 48.5% |
| 2024 | 67 | 33.8% |
| 2023 | 13 | 6.6% |
| 2022 | 2 | 1.0% |
| 2021 | 2 | 1.0% |
| 2020 | 3 | 1.5% |
| 2019 | 1 | 0.5% |
| 2018 | 1 | 0.5% |
| 2017 | 1 | 0.5% |
| 2016 | 4 | 2.0% |
| 2015 | 1 | 0.5% |
| 2014 | 1 | 0.5% |
| 2011 | 1 | 0.5% |
| 2010 | 1 | 0.5% |
| 2000 | 2 | 1.0% |
| 1994 | 1 | 0.5% |
| 1993 | 1 | 0.5% |
The mixed-year collection has a mean of 40.92% and a median of 38.32%, with a range from 1.06% to 95.89%. Those statistics should not be labeled a current global average because they combine different years.
Some high-share small islands are not drawn in the low-resolution map
The featured map uses all 198 latest observations, but only 161, about 81.3%, match polygons in the low-resolution world boundary file. Several small islands and territories—including economies that rank highly on this indicator—are absent from those boundaries.
The map is therefore a spatial overview rather than a complete visual ranking. The tables retain every source row and should be used for exact country comparisons.
Travel-service exports and imports point in opposite directions
Travel-service exports arise when nonresidents acquire goods and services while visiting the reporting economy. Travel-service imports arise when residents of the reporting economy acquire goods and services while visiting other economies. They are opposite directions in the balance of payments.
An economy with a high share of outbound travel spending does not necessarily have a high share of travel-service exports. Looking at both export and import shares helps separate inbound visitor spending from residents’ spending abroad.
A high share does not imply a large absolute export value
Because the measure is a share, it describes the composition of commercial service exports. An economy with a 90% travel share can still have lower travel-service exports in dollars than a much larger economy with a 20% share.
Absolute travel-service exports or total commercial service exports are required to compare monetary scale. Likewise, a large travel-export value can coexist with a low share if other service exports are even larger.
Post-pandemic recovery requires a time series
Travel services are sensitive to disruptions in international mobility. However, this file contains only the most recent non-empty observation for each economy. It cannot directly measure the fall during the pandemic or the speed of subsequent recovery.
A recovery analysis would need matched observations for 2019, the disrupted years, and recent years for the same economies. A cross-country latest-value comparison and a within-country time trend are different analytical tasks.
Complete list of the 198 latest observations
The table below lists every economy and territory’s latest non-empty observation in alphabetical order. The observation year should be read alongside the percentage. For a strict recent same-year comparison, the 96 observations from 2025 are the strongest group.
| Economy/territory | Observation year | Travel services / commercial service exports |
|---|---|---|
| Afghanistan | 2020 | 10.80% |
| Albania | 2025 | 68.09% |
| Algeria | 2024 | 3.07% |
| Andorra | 2024 | 85.15% |
| Angola | 2025 | 13.87% |
| Antigua and Barbuda | 2025 | 84.41% |
| Argentina | 2025 | 27.26% |
| Armenia | 2025 | 44.36% |
| Aruba | 2023 | 88.75% |
| Australia | 2025 | 61.01% |
| Austria | 2025 | 27.80% |
| Azerbaijan | 2025 | 23.17% |
| Bahamas, The | 2024 | 94.84% |
| Bahrain | 2024 | 31.78% |
| Bangladesh | 2025 | 7.12% |
| Barbados | 2017 | 71.95% |
| Belarus | 2021 | 4.14% |
| Belgium | 2025 | 6.00% |
| Belize | 2025 | 71.15% |
| Benin | 2023 | 55.64% |
| Bermuda | 2023 | 34.40% |
| Bhutan | 2024 | 77.45% |
| Bolivia | 2025 | 64.82% |
| Bosnia and Herzegovina | 2025 | 53.22% |
| Botswana | 2024 | 63.16% |
| Brazil | 2025 | 19.52% |
| Brunei Darussalam | 2025 | 36.38% |
| Bulgaria | 2025 | 26.23% |
| Burkina Faso | 2024 | 23.75% |
| Burundi | 2025 | 4.17% |
| Cabo Verde | 2025 | 80.28% |
| Cambodia | 2025 | 75.24% |
| Cameroon | 2024 | 12.99% |
| Canada | 2025 | 30.07% |
| Cayman Islands | 2024 | 17.78% |
| Central African Republic | 1993 | 33.89% |
| Chad | 1994 | 49.79% |
| Chile | 2025 | 30.64% |
| China | 2025 | 14.40% |
| Colombia | 2025 | 48.67% |
| Comoros | 2023 | 77.00% |
| Congo, Dem. Rep. | 2025 | 53.31% |
| Congo, Rep. | 2021 | 3.35% |
| Costa Rica | 2025 | 30.86% |
| Cote d’Ivoire | 2024 | 41.54% |
| Croatia | 2024 | 65.98% |
| Curacao | 2023 | 67.09% |
| Cyprus | 2025 | 13.42% |
| Czechia | 2025 | 21.41% |
| Denmark | 2024 | 8.79% |
| Djibouti | 2024 | 6.16% |
| Dominica | 2025 | 72.32% |
| Dominican Republic | 2025 | 80.25% |
| Ecuador | 2025 | 48.06% |
| Egypt, Arab Rep. | 2025 | 54.41% |
| El Salvador | 2025 | 60.67% |
| Eritrea | 2000 | 64.21% |
| Estonia | 2025 | 12.06% |
| Eswatini | 2024 | 8.47% |
| Ethiopia | 2024 | 14.31% |
| Faroe Islands | 2011 | 19.94% |
| Fiji | 2024 | 55.17% |
| Finland | 2025 | 9.68% |
| France | 2025 | 20.61% |
| French Polynesia | 2016 | 56.74% |
| Gabon | 2015 | 9.20% |
| Gambia, The | 2024 | 89.80% |
| Georgia | 2025 | 55.99% |
| Germany | 2025 | 8.37% |
| Ghana | 2025 | 16.77% |
| Greece | 2024 | 42.20% |
| Grenada | 2025 | 88.92% |
| Guatemala | 2024 | 36.43% |
| Guinea | 2024 | 9.16% |
| Guinea-Bissau | 2024 | 46.54% |
| Guyana | 2023 | 76.15% |
| Haiti | 2024 | 41.76% |
| Honduras | 2025 | 23.21% |
| Hong Kong SAR, China | 2024 | 20.68% |
| Hungary | 2025 | 21.69% |
| Iceland | 2025 | 44.67% |
| India | 2025 | 7.70% |
| Indonesia | 2025 | 43.22% |
| Iran, Islamic Rep. | 2000 | 36.92% |
| Iraq | 2024 | 73.34% |
| Ireland | 2024 | 1.49% |
| Israel | 2025 | 3.45% |
| Italy | 2025 | 38.63% |
| Jamaica | 2024 | 82.57% |
| Japan | 2025 | 26.40% |
| Jordan | 2024 | 76.70% |
| Kazakhstan | 2025 | 23.04% |
| Kenya | 2024 | 46.66% |
| Kiribati | 2025 | 38.20% |
| Korea, Rep. | 2025 | 14.87% |
| Kosovo | 2025 | 75.67% |
| Kuwait | 2025 | 17.47% |
| Kyrgyz Republic | 2024 | 29.05% |
| Lao PDR | 2024 | 74.95% |
| Latvia | 2025 | 17.05% |
| Lebanon | 2023 | 68.54% |
| Lesotho | 2025 | 67.24% |
| Liberia | 2024 | 23.33% |
| Libya | 2020 | 14.11% |
| Lithuania | 2025 | 7.16% |
| Luxembourg | 2025 | 4.26% |
| Macao SAR, China | 2024 | 89.45% |
| Madagascar | 2024 | 51.95% |
| Malawi | 2024 | 13.46% |
| Malaysia | 2024 | 39.36% |
| Maldives | 2024 | 95.34% |
| Mali | 2024 | 38.94% |
| Malta | 2024 | 10.69% |
| Marshall Islands | 2024 | 51.07% |
| Mauritania | 2024 | 2.79% |
| Mauritius | 2024 | 48.09% |
| Mexico | 2025 | 54.85% |
| Micronesia, Fed. Sts. | 2014 | 75.72% |
| Moldova | 2025 | 30.35% |
| Mongolia | 2024 | 39.72% |
| Montenegro | 2025 | 55.57% |
| Morocco | 2025 | 45.39% |
| Mozambique | 2024 | 18.06% |
| Myanmar | 2019 | 38.45% |
| Namibia | 2024 | 34.81% |
| Naoero | 2024 | 6.07% |
| Nepal | 2024 | 38.15% |
| Netherlands | 2024 | 7.36% |
| New Caledonia | 2016 | 46.06% |
| New Zealand | 2025 | 51.70% |
| Nicaragua | 2024 | 42.90% |
| Niger | 2024 | 34.57% |
| Nigeria | 2025 | 13.63% |
| North Macedonia | 2025 | 19.13% |
| Norway | 2025 | 15.17% |
| Oman | 2024 | 47.19% |
| Pakistan | 2025 | 9.96% |
| Palau | 2023 | 93.87% |
| Panama | 2025 | 32.85% |
| Papua New Guinea | 2024 | 1.06% |
| Paraguay | 2025 | 33.49% |
| Peru | 2025 | 53.21% |
| Philippines | 2025 | 16.95% |
| Poland | 2025 | 11.88% |
| Portugal | 2024 | 48.15% |
| Qatar | 2025 | 22.22% |
| Romania | 2025 | 11.55% |
| Russian Federation | 2025 | 19.77% |
| Rwanda | 2024 | 67.59% |
| Samoa | 2025 | 72.90% |
| San Marino | 2023 | 33.26% |
| Sao Tome and Principe | 2024 | 94.48% |
| Saudi Arabia | 2025 | 63.70% |
| Senegal | 2023 | 46.53% |
| Serbia | 2025 | 19.06% |
| Seychelles | 2024 | 54.91% |
| Sierra Leone | 2024 | 53.14% |
| Singapore | 2025 | 6.51% |
| Sint Maarten (Dutch part) | 2023 | 81.10% |
| Slovak Republic | 2025 | 12.60% |
| Slovenia | 2025 | 26.12% |
| Solomon Islands | 2024 | 22.82% |
| South Africa | 2025 | 38.50% |
| South Sudan | 2023 | 64.38% |
| Spain | 2025 | 46.83% |
| Sri Lanka | 2024 | 46.09% |
| St. Kitts and Nevis | 2025 | 83.78% |
| St. Lucia | 2025 | 93.46% |
| St. Vincent and the Grenadines | 2025 | 85.46% |
| Sudan | 2022 | 69.98% |
| Suriname | 2025 | 15.76% |
| Sweden | 2025 | 9.54% |
| Switzerland | 2025 | 12.26% |
| Syrian Arab Republic | 2010 | 87.92% |
| Tajikistan | 2025 | 19.09% |
| Tanzania | 2024 | 57.38% |
| Thailand | 2025 | 59.39% |
| Timor-Leste | 2025 | 82.69% |
| Togo | 2020 | 16.07% |
| Tonga | 2024 | 68.37% |
| Trinidad and Tobago | 2025 | 37.35% |
| Tunisia | 2024 | 25.84% |
| Turkiye | 2024 | 48.18% |
| Turks and Caicos Islands | 2018 | 95.89% |
| Tuvalu | 2023 | 85.43% |
| Uganda | 2024 | 73.38% |
| Ukraine | 2024 | 6.29% |
| United Arab Emirates | 2024 | 39.62% |
| United Kingdom | 2025 | 12.58% |
| United States | 2025 | 17.65% |
| Uruguay | 2025 | 33.85% |
| Uzbekistan | 2025 | 50.51% |
| Vanuatu | 2022 | 52.75% |
| Venezuela, RB | 2016 | 38.08% |
| West Bank and Gaza | 2025 | 32.90% |
| Yemen, Rep. | 2016 | 32.40% |
| Zambia | 2024 | 64.85% |
| Zimbabwe | 2024 | 46.24% |
How to interpret the comparison
First, the denominator is commercial service exports rather than total exports. Second, the indicator is not visitor arrivals or tourism’s share of GDP. Third, a percentage is not an absolute export value. Fourth, the complete 198-row file mixes observation years.
Fifth, the low-resolution map cannot display every small island and territory. The 2025 same-year subset is the clearest basis for direct ranking, while the complete latest-value table is best used with the observation year visible.
Source and calculation
The source is World Bank World Development Indicators TX.VAL.TRVL.ZS.WT, Travel services (% of commercial service exports). The 2025 mean, median, quartiles, threshold counts, and rankings use only the 96 observations dated 2025. The map and complete table use the latest non-empty observation for all 198 economies.
Frequently Asked Questions
Is travel services share the percentage of all exports generated by tourism?
No. The denominator is commercial service exports, not total exports of goods and services.
What is the 2025 median?
The median across the 96 observations dated 2025 is 30.21%, while the mean is 36.14%.
Does a high travel-services export share mean a country has more tourists?
Not necessarily. This is a service-export composition measure, not a visitor-count or tourism-GDP indicator.
Related Articles
Green Map creates custom-edited map images using open geographic data sources such as geoBoundaries, Natural Earth, OpenStreetMap, and government open data. These maps are edited visual materials, not raw data files, and are provided for education, documents, presentations, and graphic reference.