Transport services accounted for very different shares of commercial service imports across reporting economies in 2024. In World Bank indicator TM.VAL.TRAN.ZS.WT, Djibouti records the highest reported share at 91.89%, followed by Haiti at 76.15% and Kiribati at 73.91%. Ireland has the lowest reported value at 1.38%. The median across 163 observations is 29.53% and the mean is 33.04%. These numbers compare the composition of imported commercial services; they are not a ranking of the absolute amount of transport services imported.
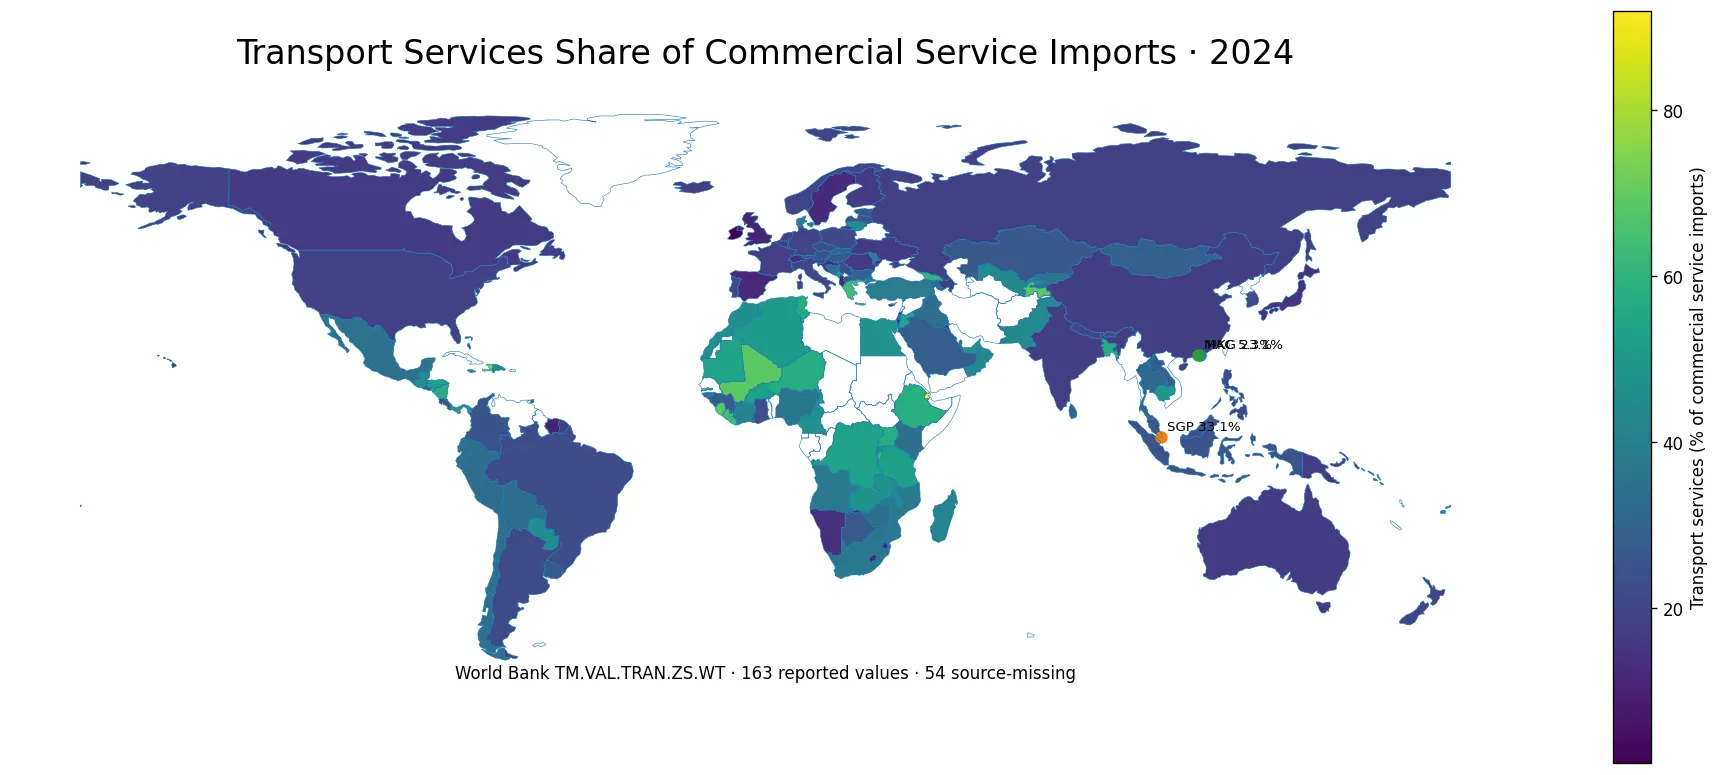
Table of Contents
What the indicator actually measures
This World Bank indicator describes the composition of imported commercial services. TM.VAL.TRAN.ZS.WT measures transport services as a percentage of commercial service imports. Transport covers the carriage of people and objects from one place to another, related supporting and auxiliary services, and postal and courier services. The denominator is commercial services supplied by non-residents to residents. A value of 40%, therefore, means that transport-related services represented about two-fifths of that economy’s commercial service imports in the reference year. It does not mean transport accounts for 40% of GDP, and it is not a measure of the economy’s share of the global transport market.
For 2024, 163 of the 217 World Bank country-and-economy entries have a reported observation and 54 are source-missing. Those missing entries are not converted to zero. The World Bank master also includes separately reported economies and territories, so 217 should not be described as a count of sovereign states. Every comparison below refers to the 163 reporting economies with a 2024 value. Keeping those boundaries clear is important because a ratio can look deceptively simple while its meaning depends heavily on both the numerator and the denominator.
Djibouti sits at the top of a very wide distribution
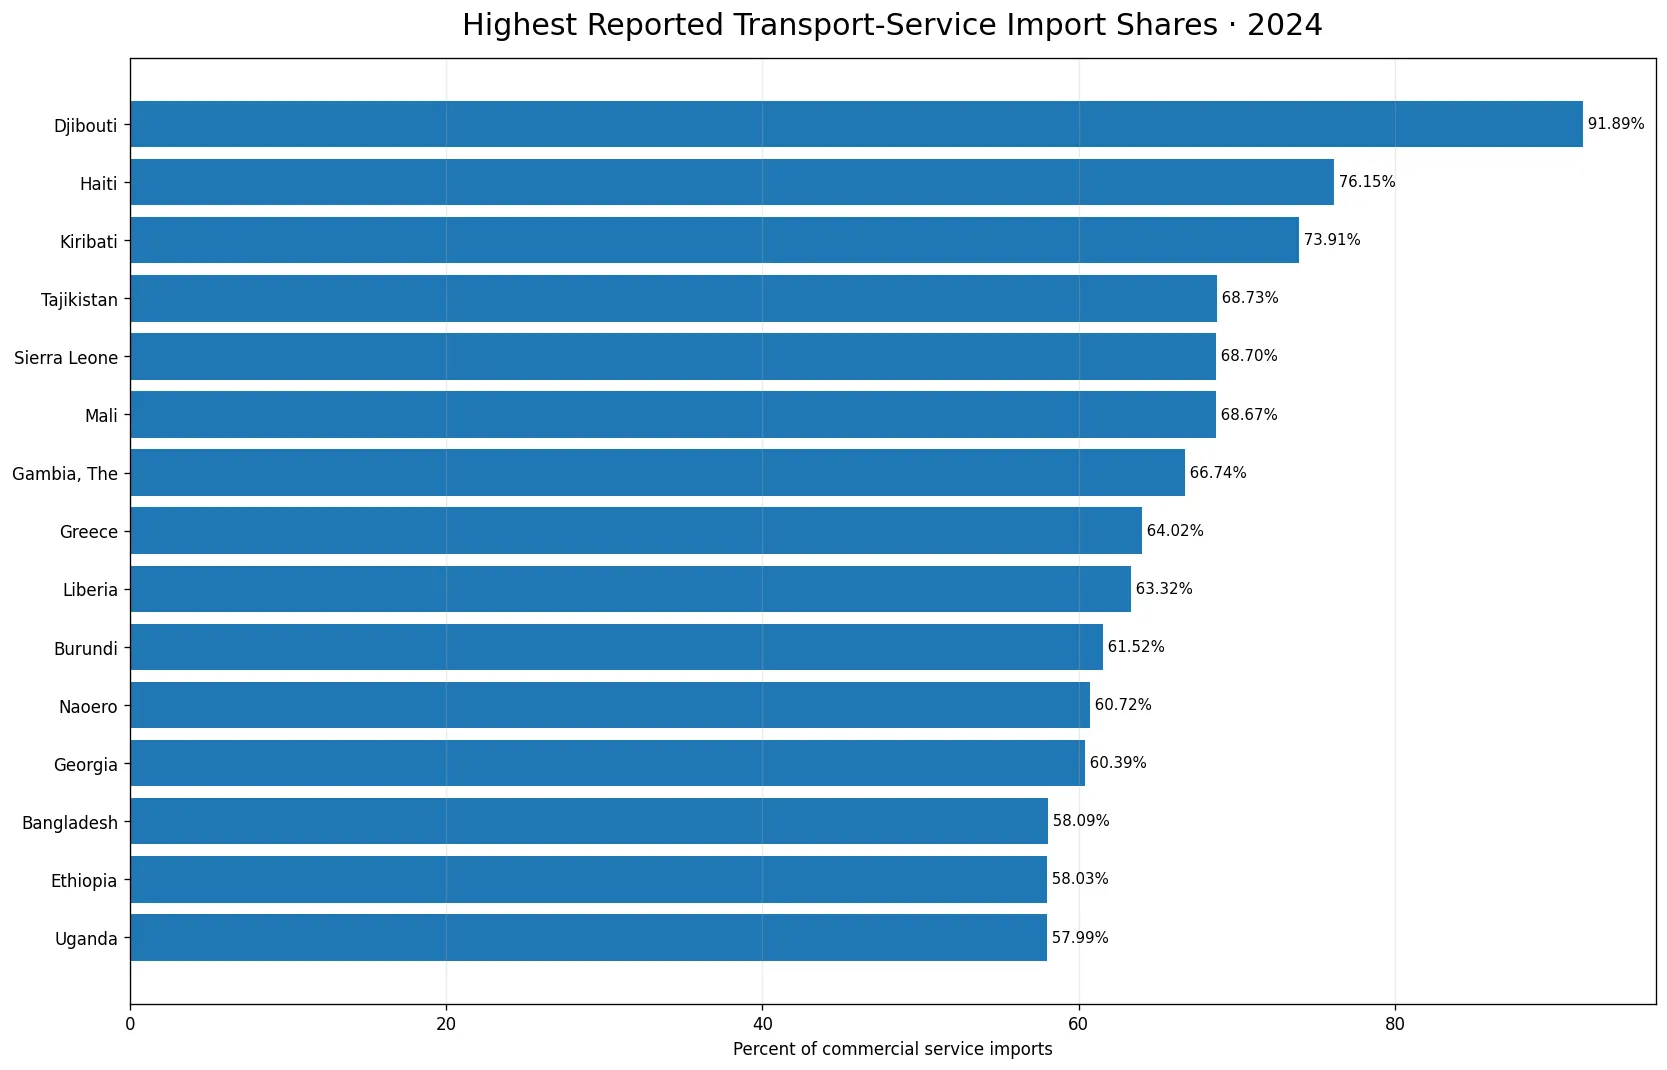
Djibouti has the highest reported 2024 share at 91.89%. Haiti follows at 76.15%, Kiribati at 73.91%, Tajikistan at 68.73%, Sierra Leone at 68.70%, Mali at 68.67%, The Gambia at 66.74%, Greece at 64.02%, Liberia at 63.32%, and Burundi at 61.52%. The leading group spans several regions and very different economic structures. That diversity is a reason to treat the ranking as a description of service-import composition rather than evidence of a single common cause.
Twenty-seven reporting economies are at or above 50%, twelve are at or above 60%, and three exceed 70%. Djibouti’s value is more than three times the reported median. A high ratio indicates that transport-related services occupy a large place in the commercial-service import basket, but it does not by itself reveal whether freight charges are high, logistics are inefficient, or physical trade volumes are large. Prices, geography, trade patterns, travel, finance, digital services, professional services, and other components of the denominator can all change the ratio. The indicator does not separate those mechanisms.
The median is 29.53%, while the mean is 33.04%
Across the 163 reported observations, the median is 29.53% and the arithmetic mean is 33.04%. The mean being higher than the median reflects the influence of the upper tail. The first quartile is 20.43% and the third quartile is 45.67%, so the middle half of reporting economies stretches across more than 25 percentage points. Eighty-one economies are at or above 30%, 48 are at or above 40%, and 27 are at or above 50%. The distribution is therefore broad rather than clustered tightly around one typical value.
For a ratio like this, the median and quartiles often describe the cross-country pattern better than a single average. An average near one-third could suggest a fairly uniform world, yet the observations actually range from 1.38% to 91.89%. The map helps locate where high and low shares occur, but similar colors should not be treated as proof that neighboring economies share the same economic explanation. A map is a comparison tool; identifying causes requires additional variables and country-specific evidence.
Low shares do not imply that transport is unimportant
Ireland reports the lowest 2024 value at 1.38%. Macao SAR, China is next at 5.32%, followed by Andorra at 9.17%, Suriname at 9.56%, the United Kingdom at 10.45%, Albania at 10.50%, Luxembourg at 10.84%, and Eswatini at 10.91%. Forty reporting economies are below 20%. A low share should not be read as evidence that transport infrastructure matters less to those economies. The denominator is all commercial service imports, so strong imports of finance, information services, travel, professional services, or other service categories can reduce transport’s percentage even when transport imports are substantial in absolute terms.
This denominator effect is essential when comparing economies of different sizes and structures. Two economies could import the same dollar amount of transport services but show very different percentages if one imports far more services in other categories. The opposite is also possible: a relatively modest absolute amount of transport imports can form a high percentage when the total commercial-service import basket is small or concentrated. To answer questions about market size or spending, the percentage series needs to be paired with monetary service-import data.
The regional pattern is a prompt for further analysis, not a verdict
Several African economies appear near the upper end, including Djibouti, Sierra Leone, Mali, The Gambia, Liberia, Burundi, Ethiopia, Uganda, Niger, and Mauritania. Yet the upper group also contains Greece, Georgia, Tajikistan, Kiribati, Haiti, Nicaragua, and Jordan. The pattern is therefore not confined to one continent or income group. Geography, land and sea access, the role of freight and passenger transport, the composition of merchandise trade, and the size of other imported services may all be relevant, but the 2024 share alone cannot identify which explanation dominates in any economy.
The lower end is similarly mixed. European economies are prominent among some of the smallest values, but low observations also occur elsewhere. It would be a mistake to convert the color pattern into a direct ranking of competitiveness, logistics quality, or policy success. Those concepts require measures designed for those purposes. This indicator is strongest when used to identify unusual service-import structures and then guide a second stage of research.
A single-year snapshot cannot establish a trend
All values in this comparison refer to 2024. A cross-section is useful because it places reporting economies on the same time reference, but it does not show whether a country’s transport-service share has been rising or falling. Year-to-year changes could reflect freight rates, energy prices, merchandise trade, travel flows, exchange-rate movements, or changes in other commercial service imports. A trend analysis would need repeated observations from the same indicator and careful attention to gaps or revisions.
The distinction matters when interpreting an unusually high or low observation. A 55% share could be persistent, temporary, or the result of a one-year change in the denominator. The 2024 map cannot distinguish those possibilities. It can show where the ratio was high or low in 2024 and how far an observation stood from the cross-country median. Claims about momentum, policy impact, or structural change need a time series rather than a single point.
Fifty-four missing observations limit the global comparison
Fifty-four World Bank country-and-economy entries have no 2024 value in the series. Missing is not the same as 0%. In fact, there are no reported zero values among the 163 observations; the minimum reported value is Ireland’s 1.38%. A blank area on the map therefore means no 2024 observation was available in this series, not that transport represented none of that economy’s commercial service imports.
This also changes how rankings should be described. Djibouti is the highest among the 163 reporting economies, not necessarily among every economy in the world. An unreported economy could in principle fall anywhere in the distribution. Reporting the coverage beside the ranking prevents a common mistake in international data analysis: treating a partial cross-section as if it were a complete census. The missing entries remain missing throughout the visualizations and calculations.
Five questions make the ratio easier to read correctly
A useful reading checklist starts with five questions. First, is the number a share or an absolute amount? Here it is a share. Second, what is the denominator? It is commercial service imports, so changes in other service categories can move the ratio. Third, what is included in transport? The definition covers passenger and freight carriage, supporting and auxiliary services, and postal and courier services. Fourth, is the observation a single year or a trend? This comparison is only 2024. Fifth, is the comparison complete? No: 163 entries have values and 54 do not.
Following that checklist helps prevent evaluative claims that the indicator cannot support. A difference between 60% and 20% clearly signals different service-import composition, but it does not identify which economy has better logistics, lower transport costs, stronger infrastructure, or more efficient trade. Those questions call for additional indicators such as logistics performance, freight rates, port and air traffic, merchandise trade, and service-import values in currency terms.
The main 2024 result is dispersion, not one universal pattern
The clearest feature of the 2024 data is the breadth of the distribution. Reported values run from 1.38% to 91.89%, with a median of 29.53%. Twenty-seven economies are at or above 50%, while 40 are below 20%. That spread makes it difficult to describe a single normal structure for commercial service imports across countries and economies. Transport is a dominant component in some cases and a relatively small component in others.
The most productive use of the indicator is therefore comparative and diagnostic. It can identify economies where transport-related services occupy an unusually large or small share of imported commercial services, after which other data can be used to investigate why. The map and ranking create those questions; they do not settle the causal explanation. Keeping that distinction in view makes the cross-country comparison both more useful and more accurate.
Frequently Asked Questions
What does the transport-services import share measure?
It measures transport services, including related supporting services and postal and courier services, as a percentage of commercial service imports.
Does a high share mean transport costs are high?
Not necessarily. The ratio depends on both transport-service imports and the size and composition of all other commercial service imports.
Were the 54 missing 2024 observations treated as zero?
No. Source-missing observations remain missing and are not included as zero values.
Can this indicator rank logistics performance?
No. Logistics performance requires additional evidence such as freight costs, infrastructure, port and air traffic, and dedicated logistics indicators.
Related Articles
Green Map creates custom-edited map images using open geographic data sources such as geoBoundaries, Natural Earth, OpenStreetMap, and government open data. These maps are edited visual materials, not raw data files, and are provided for education, documents, presentations, and graphic reference.