Carbon dioxide emissions from Building (Energy) measure annual CO₂ emissions associated with the building-related energy category used by the World Bank indicator EN.GHG.CO2.BU.MT.CE.AR5. The 2024 frame contains 217 economies and territories, with 193 numeric observations and 24 source-missing rows. Values are reported in Mt CO₂e, or million tonnes of carbon-dioxide equivalent.
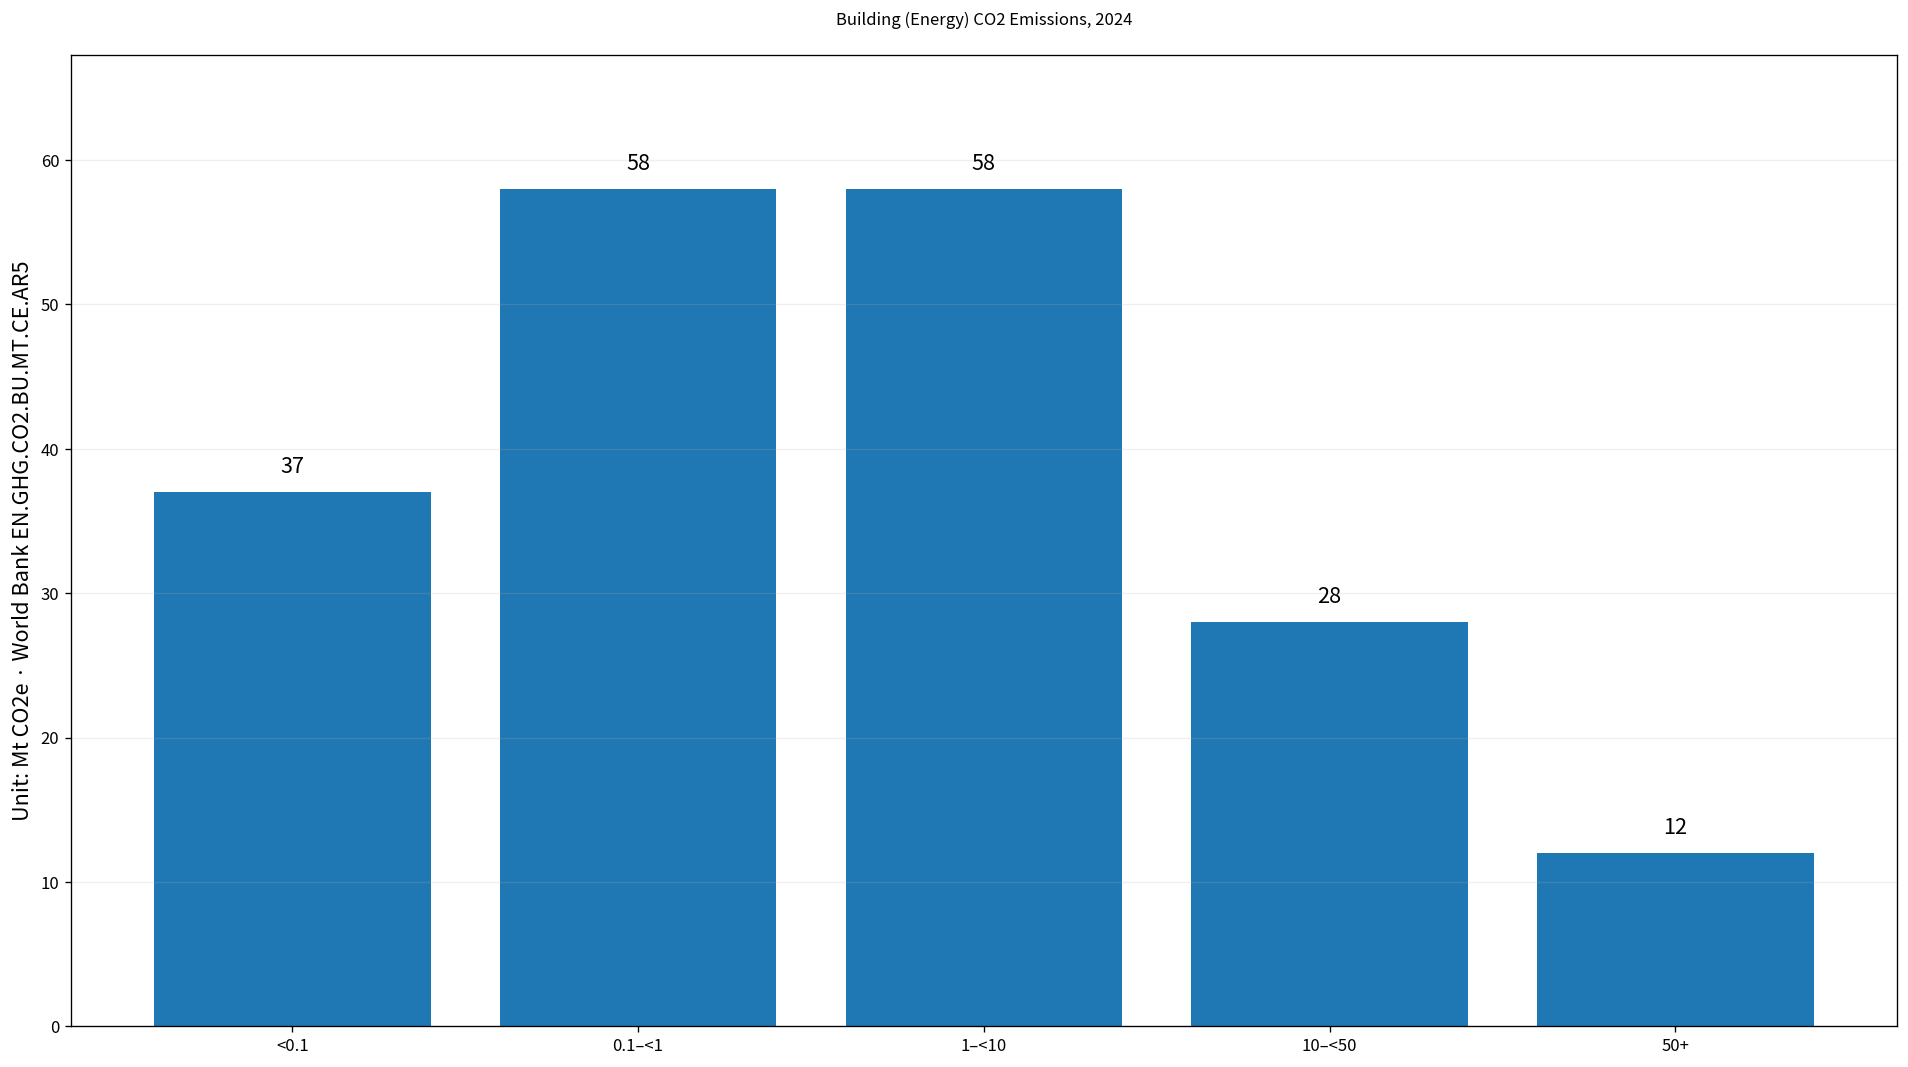
Table of Contents
What Building (Energy) CO₂ emissions include
The source description identifies this as annual CO₂ emissions from the building subsector of energy and references IPCC 2006 categories 1.A.4 Residential and other sectors and 1.A.5 Non-Specified. It should therefore not be reduced to household heating alone. The indicator follows the sector boundary used by the World Bank source.
It is also not a measure of all national CO₂ emissions. Transport, electricity generation, industrial processes, and other emitting activities are represented in other categories. A country with high building-energy emissions does not necessarily have buildings as its largest overall source of carbon emissions.
The 2024 frame has 193 numeric values and 24 missing rows
The same-year frame contains 217 economies and territories. 193 have numeric observations and 24 have no 2024 source value. Missing values are left missing rather than converted to zero, and they are excluded from averages, rankings, and distribution counts.
Across the numeric observations, the simple mean is 16.92 Mt CO₂e while the median is only 1.076 Mt CO₂e. The first quartile is 0.1833 and the third quartile 7.19 Mt CO₂e. The large difference between the mean and median reflects a strongly right-skewed distribution.
China and the United States each exceed 500 Mt CO₂e
China records 586.64 Mt CO₂e and the United States 557.85 Mt CO₂e. The Russian Federation follows at 249.23, India at 210.24, and Iran, Islamic Rep. at 175.71 Mt CO₂e. Germany reaches 118.92 and Japan 103.80 Mt CO₂e, the other two observations above 100.
| Rank | Economy/territory | 2024 Building (Energy) CO₂ emissions |
|---|---|---|
| 1 | China | 586.64 Mt CO₂e |
| 2 | United States | 557.85 Mt CO₂e |
| 3 | Russian Federation | 249.23 Mt CO₂e |
| 4 | India | 210.24 Mt CO₂e |
| 5 | Iran, Islamic Rep. | 175.71 Mt CO₂e |
| 6 | Germany | 118.92 Mt CO₂e |
| 7 | Japan | 103.80 Mt CO₂e |
| 8 | Canada | 89.27 Mt CO₂e |
| 9 | United Kingdom | 74.58 Mt CO₂e |
| 10 | Turkiye | 72.69 Mt CO₂e |
| 11 | Italy | 56.91 Mt CO₂e |
| 12 | France | 56.34 Mt CO₂e |
| 13 | Korea, Rep. | 49.28 Mt CO₂e |
| 14 | Brazil | 42.32 Mt CO₂e |
| 15 | Poland | 40.62 Mt CO₂e |
| 16 | Argentina | 39.40 Mt CO₂e |
| 17 | Kazakhstan | 38.14 Mt CO₂e |
| 18 | Uzbekistan | 36.66 Mt CO₂e |
| 19 | Mexico | 31.50 Mt CO₂e |
| 20 | Indonesia | 31.28 Mt CO₂e |
The sum of the 193 observed values is 3,264.77 Mt CO₂e. That is not a complete global total because 24 rows lack values. Within the observed sum, China accounts for about 18.0% and China plus the United States for about 35.1%.
The top five observations represent about 54.5% of the observed sum, and the top ten about 68.6%. This shows a high concentration of observed building-energy CO₂ emissions. These percentages use the 193-row observed sum as the denominator and should not be presented as shares of a fully complete world total.
The median is only 1.076 Mt CO₂e
The median of 1.076 Mt CO₂e is the middle value among the 193 numeric observations. It is far below the mean of 16.92 Mt CO₂e because a small number of very large emitters stretch the upper tail into the hundreds of megatonnes.
By band, 37 observations are below 0.1 Mt CO₂e, 58 are from 0.1 to below 1, 58 are from 1 to below 10, 28 are from 10 to below 50, and 12 are at least 50. The featured chart uses these bands so smaller economies remain visible despite the extreme scale difference.
The smallest observations are measured in thousandths of a megatonne
Dominica is lowest at 0.0067 Mt CO₂e, followed by British Virgin Islands at 0.0074, St. Vincent and the Grenadines at 0.0106, Kiribati and St. Kitts and Nevis at 0.0108, Grenada at 0.0141, and Sao Tome and Principe at 0.0152 Mt CO₂e.
| Low-order position | Economy/territory | 2024 Building (Energy) CO₂ emissions |
|---|---|---|
| 1 | Dominica | 0.0067 Mt CO₂e |
| 2 | British Virgin Islands | 0.0074 Mt CO₂e |
| 3 | St. Vincent and the Grenadines | 0.0106 Mt CO₂e |
| 4 | Kiribati | 0.0108 Mt CO₂e |
| 5 | St. Kitts and Nevis | 0.0108 Mt CO₂e |
| 6 | Grenada | 0.0141 Mt CO₂e |
| 7 | Sao Tome and Principe | 0.0152 Mt CO₂e |
| 8 | Turks and Caicos Islands | 0.0184 Mt CO₂e |
| 9 | Bermuda | 0.0214 Mt CO₂e |
| 10 | Tonga | 0.023 Mt CO₂e |
| 11 | St. Lucia | 0.0246 Mt CO₂e |
| 12 | Eswatini | 0.0265 Mt CO₂e |
| 13 | Antigua and Barbuda | 0.0286 Mt CO₂e |
| 14 | Cayman Islands | 0.0298 Mt CO₂e |
| 15 | Belize | 0.0307 Mt CO₂e |
| 16 | Central African Republic | 0.0336 Mt CO₂e |
| 17 | Guinea-Bissau | 0.0348 Mt CO₂e |
| 18 | Vanuatu | 0.0386 Mt CO₂e |
| 19 | Solomon Islands | 0.0425 Mt CO₂e |
| 20 | Aruba | 0.0446 Mt CO₂e |
Small absolute emissions can reflect population size, building stock, climate, energy demand, and fuel mix. Comparing small island economies with very large economies on an absolute-volume basis naturally embeds differences in scale. The ranking should therefore not be treated as a ranking of building efficiency.
Absolute emissions are different from per-capita emissions
This indicator is a national total. A large population can produce a high total even when emissions per person are moderate. A small economy can have a low total even if its buildings use carbon-intensive energy. Total volume and emissions intensity answer different questions.
A more direct comparison of building performance would need indicators such as building-energy CO₂ per person, energy use per square meter, heating and cooling demand, building-efficiency standards, and the carbon intensity of energy supply. The current measure is best used to compare the scale of the recorded sectoral emissions.
Direct fuel use and electricity-related emissions require careful scope matching
Building carbon emissions can be accounted for differently depending on whether direct on-site fuel combustion and indirect emissions from electricity are assigned to buildings or to electricity generation. The World Bank series follows its own Building (Energy) boundary, so it should not be assumed to include every indirect electricity emission associated with building use.
When comparing this series with another buildings dataset, the accounting boundary should be checked first. A dataset labeled ‘operational building emissions’ or ‘building electricity emissions’ can include a different combination of direct and indirect sources.
Why the source reports Mt CO₂e and references AR5
The source description states that the greenhouse-gas series is standardized to carbon-dioxide-equivalent values using Global Warming Potential factors from the IPCC Fifth Assessment Report. This particular indicator measures CO₂, but it is presented within that harmonized greenhouse-gas reporting framework in Mt CO₂e.
For comparisons with methane or nitrous-oxide indicators, the gas and the Global Warming Potential basis matter because equal physical masses do not translate into equal CO₂-equivalent values.
Complete 2024 frame of 217 economies and territories
The table below lists all 217 rows in the 2024 frame. The 24 source-missing rows are marked ‘No value’. Missing values are not replaced with zero and do not enter the numerical ranking or descriptive statistics.
| Economy/territory | 2024 Building (Energy) CO₂ emissions |
|---|---|
| Afghanistan | 1.143 Mt CO₂e |
| Albania | 0.7557 Mt CO₂e |
| Algeria | 29.61 Mt CO₂e |
| American Samoa | No value |
| Andorra | No value |
| Angola | 7.258 Mt CO₂e |
| Antigua and Barbuda | 0.0286 Mt CO₂e |
| Argentina | 39.40 Mt CO₂e |
| Armenia | 2.296 Mt CO₂e |
| Aruba | 0.0446 Mt CO₂e |
| Australia | 29.86 Mt CO₂e |
| Austria | 6.674 Mt CO₂e |
| Azerbaijan | 10.18 Mt CO₂e |
| Bahamas, The | 0.1172 Mt CO₂e |
| Bahrain | 0.2639 Mt CO₂e |
| Bangladesh | 11.44 Mt CO₂e |
| Barbados | 0.0501 Mt CO₂e |
| Belarus | 7.187 Mt CO₂e |
| Belgium | 20.01 Mt CO₂e |
| Belize | 0.0307 Mt CO₂e |
| Benin | 0.2307 Mt CO₂e |
| Bermuda | 0.0214 Mt CO₂e |
| Bhutan | 0.0709 Mt CO₂e |
| Bolivia | 3.353 Mt CO₂e |
| Bosnia and Herzegovina | 0.8072 Mt CO₂e |
| Botswana | 0.1395 Mt CO₂e |
| Brazil | 42.32 Mt CO₂e |
| British Virgin Islands | 0.0074 Mt CO₂e |
| Brunei Darussalam | 0.0796 Mt CO₂e |
| Bulgaria | 1.076 Mt CO₂e |
| Burkina Faso | 0.5354 Mt CO₂e |
| Burundi | 0.0855 Mt CO₂e |
| Cabo Verde | 0.0695 Mt CO₂e |
| Cambodia | 1.662 Mt CO₂e |
| Cameroon | 0.7574 Mt CO₂e |
| Canada | 89.27 Mt CO₂e |
| Cayman Islands | 0.0298 Mt CO₂e |
| Central African Republic | 0.0336 Mt CO₂e |
| Chad | 0.2243 Mt CO₂e |
| Channel Islands | No value |
| Chile | 8.168 Mt CO₂e |
| China | 586.64 Mt CO₂e |
| Colombia | 8.099 Mt CO₂e |
| Comoros | 0.0458 Mt CO₂e |
| Congo, Dem. Rep. | 0.065 Mt CO₂e |
| Congo, Rep. | 0.0796 Mt CO₂e |
| Costa Rica | 0.5188 Mt CO₂e |
| Cote d’Ivoire | 2.043 Mt CO₂e |
| Croatia | 2.589 Mt CO₂e |
| Cuba | 2.066 Mt CO₂e |
| Curacao | No value |
| Cyprus | 0.4793 Mt CO₂e |
| Czechia | 8.43 Mt CO₂e |
| Denmark | 3.704 Mt CO₂e |
| Djibouti | 0.0724 Mt CO₂e |
| Dominica | 0.0067 Mt CO₂e |
| Dominican Republic | 1.887 Mt CO₂e |
| Ecuador | 6.873 Mt CO₂e |
| Egypt, Arab Rep. | 17.67 Mt CO₂e |
| El Salvador | 0.7746 Mt CO₂e |
| Equatorial Guinea | 0.1278 Mt CO₂e |
| Eritrea | 0.0541 Mt CO₂e |
| Estonia | 0.5519 Mt CO₂e |
| Eswatini | 0.0265 Mt CO₂e |
| Ethiopia | 1.473 Mt CO₂e |
| Faroe Islands | No value |
| Fiji | 0.1976 Mt CO₂e |
| Finland | 2.947 Mt CO₂e |
| France | 56.34 Mt CO₂e |
| French Polynesia | 0.132 Mt CO₂e |
| Gabon | 0.1629 Mt CO₂e |
| Gambia, The | 0.0502 Mt CO₂e |
| Georgia | 3.159 Mt CO₂e |
| Germany | 118.92 Mt CO₂e |
| Ghana | 0.7595 Mt CO₂e |
| Gibraltar | No value |
| Greece | 5.465 Mt CO₂e |
| Greenland | 0.3418 Mt CO₂e |
| Grenada | 0.0141 Mt CO₂e |
| Guam | No value |
| Guatemala | 1.386 Mt CO₂e |
| Guinea | 0.4636 Mt CO₂e |
| Guinea-Bissau | 0.0348 Mt CO₂e |
| Guyana | 0.2257 Mt CO₂e |
| Haiti | 0.272 Mt CO₂e |
| Honduras | 0.6354 Mt CO₂e |
| Hong Kong SAR, China | 1.831 Mt CO₂e |
| Hungary | 9.334 Mt CO₂e |
| Iceland | 0.562 Mt CO₂e |
| India | 210.24 Mt CO₂e |
| Indonesia | 31.28 Mt CO₂e |
| Iran, Islamic Rep. | 175.71 Mt CO₂e |
| Iraq | 10.30 Mt CO₂e |
| Ireland | 7.258 Mt CO₂e |
| Isle of Man | No value |
| Israel | 2.501 Mt CO₂e |
| Italy | 56.91 Mt CO₂e |
| Jamaica | 0.7391 Mt CO₂e |
| Japan | 103.80 Mt CO₂e |
| Jordan | 2.976 Mt CO₂e |
| Kazakhstan | 38.14 Mt CO₂e |
| Kenya | 2.072 Mt CO₂e |
| Kiribati | 0.0108 Mt CO₂e |
| Korea, Dem. People’s Rep. | 11.68 Mt CO₂e |
| Korea, Rep. | 49.28 Mt CO₂e |
| Kosovo | No value |
| Kuwait | 1.171 Mt CO₂e |
| Kyrgyz Republic | 4.586 Mt CO₂e |
| Lao PDR | 0.0836 Mt CO₂e |
| Latvia | 1.268 Mt CO₂e |
| Lebanon | 0.4305 Mt CO₂e |
| Lesotho | 0.1025 Mt CO₂e |
| Liberia | 0.0689 Mt CO₂e |
| Libya | 1.201 Mt CO₂e |
| Liechtenstein | No value |
| Lithuania | 1.331 Mt CO₂e |
| Luxembourg | 1.49 Mt CO₂e |
| Macao SAR, China | 0.2163 Mt CO₂e |
| Madagascar | 0.4358 Mt CO₂e |
| Malawi | 0.2689 Mt CO₂e |
| Malaysia | 8.473 Mt CO₂e |
| Maldives | 0.2545 Mt CO₂e |
| Mali | 0.6755 Mt CO₂e |
| Malta | 0.1367 Mt CO₂e |
| Marshall Islands | No value |
| Mauritania | 0.4733 Mt CO₂e |
| Mauritius | 0.2417 Mt CO₂e |
| Mexico | 31.50 Mt CO₂e |
| Micronesia, Fed. Sts. | No value |
| Moldova | 1.383 Mt CO₂e |
| Monaco | No value |
| Mongolia | 3.328 Mt CO₂e |
| Montenegro | No value |
| Morocco | 12.07 Mt CO₂e |
| Mozambique | 0.2824 Mt CO₂e |
| Myanmar | 1.939 Mt CO₂e |
| Namibia | 1.022 Mt CO₂e |
| Naoero | No value |
| Nepal | 2.122 Mt CO₂e |
| Netherlands | 22.60 Mt CO₂e |
| New Caledonia | 0.328 Mt CO₂e |
| New Zealand | 3.293 Mt CO₂e |
| Nicaragua | 0.8141 Mt CO₂e |
| Niger | 0.2248 Mt CO₂e |
| Nigeria | 4.461 Mt CO₂e |
| North Macedonia | 0.1833 Mt CO₂e |
| Northern Mariana Islands | No value |
| Norway | 2.576 Mt CO₂e |
| Oman | 22.16 Mt CO₂e |
| Pakistan | 20.82 Mt CO₂e |
| Palau | 0.105 Mt CO₂e |
| Panama | 0.5374 Mt CO₂e |
| Papua New Guinea | 0.6052 Mt CO₂e |
| Paraguay | 0.1999 Mt CO₂e |
| Peru | 4.978 Mt CO₂e |
| Philippines | 10.71 Mt CO₂e |
| Poland | 40.62 Mt CO₂e |
| Portugal | 3.436 Mt CO₂e |
| Puerto Rico (US) | 0.7224 Mt CO₂e |
| Qatar | 0.4706 Mt CO₂e |
| Romania | 12.45 Mt CO₂e |
| Russian Federation | 249.23 Mt CO₂e |
| Rwanda | 0.1806 Mt CO₂e |
| Samoa | 0.0473 Mt CO₂e |
| San Marino | No value |
| Sao Tome and Principe | 0.0152 Mt CO₂e |
| Saudi Arabia | 5.304 Mt CO₂e |
| Senegal | 0.6541 Mt CO₂e |
| Serbia | No value |
| Seychelles | 0.0902 Mt CO₂e |
| Sierra Leone | 0.1346 Mt CO₂e |
| Singapore | 0.7827 Mt CO₂e |
| Sint Maarten (Dutch part) | No value |
| Slovak Republic | 4.146 Mt CO₂e |
| Slovenia | 1.092 Mt CO₂e |
| Solomon Islands | 0.0425 Mt CO₂e |
| Somalia, Fed. Rep. | 0.0858 Mt CO₂e |
| South Africa | 22.67 Mt CO₂e |
| South Sudan | No value |
| Spain | 28.60 Mt CO₂e |
| Sri Lanka | 1.235 Mt CO₂e |
| St. Kitts and Nevis | 0.0108 Mt CO₂e |
| St. Lucia | 0.0246 Mt CO₂e |
| St. Martin (French part) | No value |
| St. Vincent and the Grenadines | 0.0106 Mt CO₂e |
| Sudan | 1.366 Mt CO₂e |
| Suriname | 0.5905 Mt CO₂e |
| Sweden | 1.967 Mt CO₂e |
| Switzerland | 9.669 Mt CO₂e |
| Syrian Arab Republic | 2.968 Mt CO₂e |
| Tajikistan | 2.297 Mt CO₂e |
| Tanzania | 0.9175 Mt CO₂e |
| Thailand | 13.79 Mt CO₂e |
| Timor-Leste | 0.0895 Mt CO₂e |
| Togo | 0.1614 Mt CO₂e |
| Tonga | 0.023 Mt CO₂e |
| Trinidad and Tobago | 0.3901 Mt CO₂e |
| Tunisia | 4.717 Mt CO₂e |
| Turkiye | 72.69 Mt CO₂e |
| Turkmenistan | 29.53 Mt CO₂e |
| Turks and Caicos Islands | 0.0184 Mt CO₂e |
| Tuvalu | No value |
| Uganda | 0.675 Mt CO₂e |
| Ukraine | 18.16 Mt CO₂e |
| United Arab Emirates | 0.662 Mt CO₂e |
| United Kingdom | 74.58 Mt CO₂e |
| United States | 557.85 Mt CO₂e |
| Uruguay | 0.9998 Mt CO₂e |
| Uzbekistan | 36.66 Mt CO₂e |
| Vanuatu | 0.0386 Mt CO₂e |
| Venezuela, RB | 3.618 Mt CO₂e |
| Viet Nam | 16.78 Mt CO₂e |
| Virgin Islands (U.S.) | No value |
| West Bank and Gaza | No value |
| Yemen, Rep. | 2.547 Mt CO₂e |
| Zambia | 0.4714 Mt CO₂e |
| Zimbabwe | 1.658 Mt CO₂e |
How to interpret the comparison
First, this is a specific building-related energy CO₂ category rather than total national CO₂. Second, the measure is an absolute volume and is strongly affected by country scale. Third, the 24 missing rows must remain missing rather than being treated as zero. Fourth, the observed sum is not a complete global total.
Fifth, the indicator alone cannot identify why one country emits more than another. Climate, building stock, heating and cooling demand, energy efficiency, fuel mix, electricity systems, and economic structure can all matter. Sectoral energy-use and building-efficiency data are needed for a causal or policy analysis.
Source and calculation
The source is World Bank World Development Indicators EN.GHG.CO2.BU.MT.CE.AR5, Carbon dioxide (CO2) emissions from Building (Energy) (Mt CO2e). The mean, median, quartiles, emission bands, and rankings are calculated from the 193 numeric observations in the fixed 2024 frame; 24 source-missing rows are excluded.
Frequently Asked Questions
Is Building (Energy) CO₂ the same as total national CO₂ emissions?
No. It covers the World Bank's building-related energy category; transport, industry, and other sources are separate.
What is the 2024 median?
The median across the 193 numeric observations is 1.076 Mt CO₂e, while the mean is 16.92 Mt CO₂e.
Were the 24 missing rows treated as zero?
No. Rows without a 2024 source value remain missing and are excluded from the numeric statistics, ranking, and observed sum.
Related Articles
Green Map creates custom-edited map images using open geographic data sources such as geoBoundaries, Natural Earth, OpenStreetMap, and government open data. These maps are edited visual materials, not raw data files, and are provided for education, documents, presentations, and graphic reference.