Agriculture, forestry and fishing value added per worker differed enormously across reporting countries and territories in 2025. In the World Bank NV.AGR.EMPL.KD series, 151 country-level observations had a reported value for the year. Canada was highest at about $150,632 per worker in constant 2015 U.S. dollars, while Burundi was lowest at about $211. The measure is not a wage or farm-income statistic. It links the value added generated by agriculture, forestry and fishing to workers in that sector, with prices held at a 2015 reference level so that inflation does not dominate the comparison.
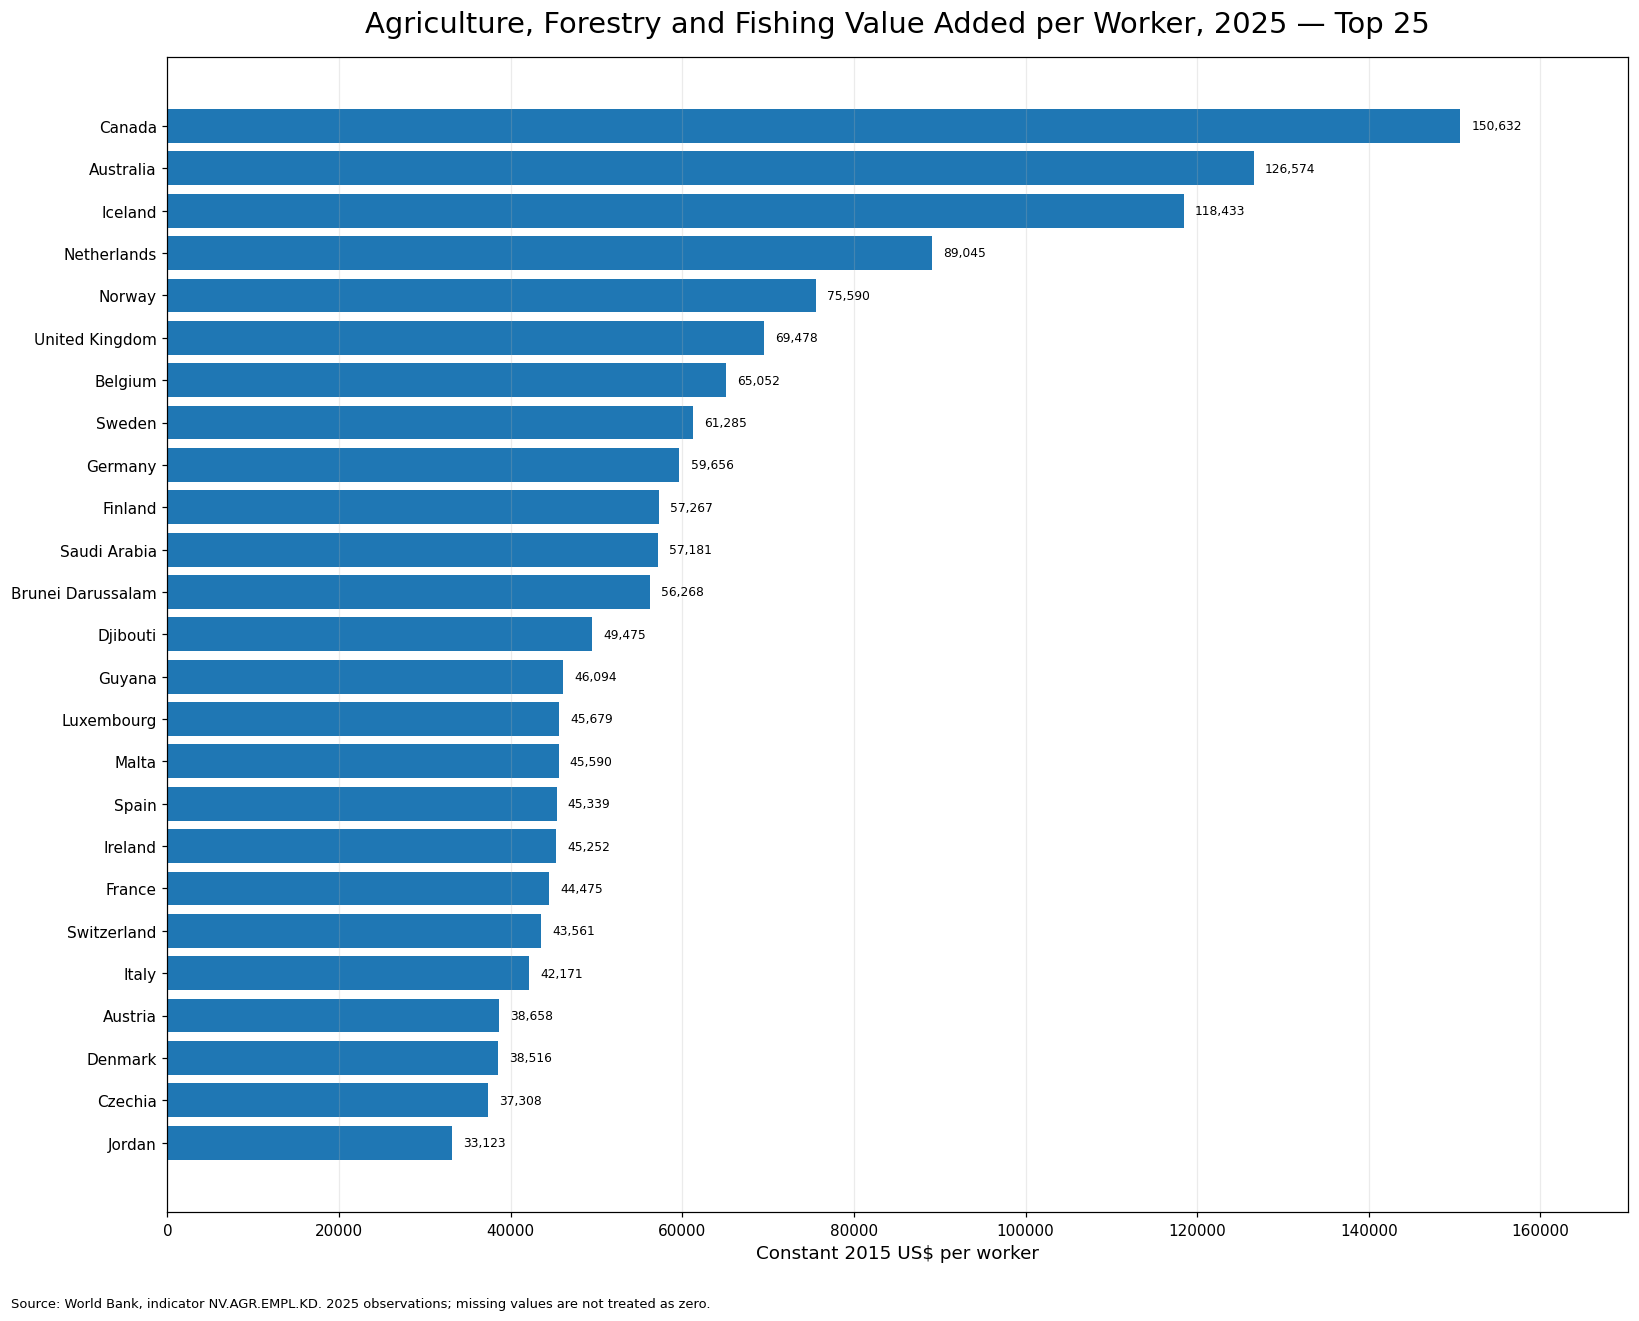
Table of Contents
What value added per worker actually measures
The World Bank indicator is Agriculture, forestry, and fishing, value added per worker (constant 2015 US$). Value added refers to the economic value created by the sector after intermediate inputs are accounted for. Dividing that result by workers gives a labor-productivity style measure for the sector. Because the series is expressed in constant 2015 dollars, it is designed to make real comparisons more meaningful than a current-dollar series would be. A high value does not mean that individual farm, forestry or fishing workers receive that amount as pay, and it should not be read as average earnings.
The sector is also broad. Countries can reach similar values through very different combinations of crop farming, livestock, forestry and fishing. The statistic does not tell us which activity generated the result, nor does it separate capital intensity, land endowments, technology, market access or workforce composition. Its strength is narrower and useful: it provides one consistent basis for comparing sectoral value added per worker across many national statistical systems.
The median was far below the mean
Across the 151 reported observations, the simple mean was about $16,901 per worker, while the median was only about $6,742. That gap shows a strongly right-skewed distribution. A relatively small group of very high values pulls the arithmetic average upward, so the mean alone can make the typical country look more productive than the middle observation actually is. The first quartile was about $2,446 and the third quartile about $20,488, meaning that the middle half of reporting countries spanned a very wide range even before the most extreme observations are considered.
Only three observations reached at least $100,000 per worker, five reached $75,000, and twelve reached $50,000. Forty were at or above $20,000, 64 at or above $10,000, and 87 at or above $5,000. At the other end, 15 observations were below $1,000. These counts make the shape of the distribution clearer than a single global average. There is a long upper tail, a broad middle, and a distinct group of very low values.
Canada, Australia and Iceland formed the top tier
Canada ranked first at $150,632 per worker, followed by Australia at $126,574 and Iceland at $118,433. They were the only three observations above $100,000. The Netherlands followed at $89,045 and Norway at $75,590. The United Kingdom, Belgium, Sweden, Germany and Finland completed the top ten, all above roughly $57,000. Saudi Arabia and Brunei Darussalam also exceeded $56,000, while Djibouti, Guyana, Luxembourg, Malta, Spain, Ireland, France and Switzerland filled out the next portion of the upper ranking.
The upper group is geographically mixed. Northern and western European countries are prominent, but the list also includes North America, Oceania, the Middle East, Southeast Asia, South America and the Horn of Africa. That geographic variety is a warning against explaining high values with a single regional story. Mechanization, production mix, capital use, land quality, labor-force size, commodity values, irrigation, market access and the relative importance of forestry or fishing may all matter, but the indicator itself does not identify the causal contribution of those factors.
Rank is most useful when read together with the actual distance between values
The middle of the ranking contains many countries separated by comparatively small dollar differences. In that part of the distribution, moving several places up or down does not necessarily represent a major productivity gap. By contrast, differences near the top can be tens of thousands of dollars per worker. The median of $6,742 and the interquartile range from roughly $2,446 to $20,488 provide useful reference points when reading the table because they show where a country sits relative to the bulk of observations, not just its ordinal position.
This per-worker measure also answers a different question from total agriculture, forestry and fishing value added. A very populous country with a large agricultural workforce can generate a large total amount of value added while recording a modest value per worker. A smaller country with a relatively small workforce and capital-intensive production can rank much higher on the per-worker measure even if its sector is smaller in total dollars. Total size, share of GDP and value added per worker should therefore be treated as complementary indicators rather than substitutes.
Fifteen reported observations were below $1,000 per worker
At the lower end, Burundi recorded about $211 per worker, the Democratic Republic of the Congo about $286, Zambia $304, Madagascar $306, Malawi $495 and Mozambique $498. The Central African Republic was about $548, Lesotho $602, Equatorial Guinea $724, Niger $756 and Burkina Faso $778. Uganda, Zimbabwe, Tanzania and Haiti were also below $1,000. The ratio between the highest and lowest reported values was roughly 715 to one, which illustrates the extraordinary spread in the series.
That ratio should not be converted directly into a claim about household welfare, farmer income or national living standards. The numerator is sectoral value added and the denominator is workers. Differences in production systems, employment structures, capital, technology, land and water resources, commodity mix, prices and statistical measurement can all influence the result. The dataset documents the outcome, but it does not by itself explain why one country is hundreds of times higher than another.
Complete 2025 ranking for 151 reported countries and territories
The table below ranks every 2025 observation with a reported value. Amounts are rounded to the nearest constant 2015 U.S. dollar per worker for readability. Missing source values are excluded from the ranking rather than replaced with zero.
| Rank | Country or territory | Constant 2015 US$ per worker |
|---|---|---|
| 1 | Canada | 150,632 |
| 2 | Australia | 126,574 |
| 3 | Iceland | 118,433 |
| 4 | Netherlands | 89,045 |
| 5 | Norway | 75,590 |
| 6 | United Kingdom | 69,478 |
| 7 | Belgium | 65,052 |
| 8 | Sweden | 61,285 |
| 9 | Germany | 59,656 |
| 10 | Finland | 57,267 |
| 11 | Saudi Arabia | 57,181 |
| 12 | Brunei Darussalam | 56,268 |
| 13 | Djibouti | 49,475 |
| 14 | Guyana | 46,094 |
| 15 | Luxembourg | 45,679 |
| 16 | Malta | 45,590 |
| 17 | Spain | 45,339 |
| 18 | Ireland | 45,252 |
| 19 | France | 44,475 |
| 20 | Switzerland | 43,561 |
| 21 | Italy | 42,171 |
| 22 | Austria | 38,658 |
| 23 | Denmark | 38,516 |
| 24 | Czechia | 37,308 |
| 25 | Jordan | 33,123 |
| 26 | Singapore | 32,757 |
| 27 | Slovak Republic | 30,452 |
| 28 | Uruguay | 30,148 |
| 29 | Portugal | 27,607 |
| 30 | Croatia | 26,140 |
| 31 | Slovenia | 23,973 |
| 32 | Hong Kong SAR, China | 23,547 |
| 33 | Hungary | 22,156 |
| 34 | Lithuania | 22,070 |
| 35 | Algeria | 21,681 |
| 36 | Cyprus | 21,668 |
| 37 | Mauritius | 20,796 |
| 38 | Argentina | 20,489 |
| 39 | Chile | 20,488 |
| 40 | Oman | 20,237 |
| 41 | Montenegro | 19,315 |
| 42 | Bulgaria | 18,626 |
| 43 | Estonia | 18,594 |
| 44 | Korea, Rep. | 18,552 |
| 45 | Bahrain | 17,610 |
| 46 | Qatar | 17,057 |
| 47 | Russian Federation | 16,787 |
| 48 | Malaysia | 16,359 |
| 49 | Kuwait | 15,745 |
| 50 | Latvia | 15,095 |
| 51 | Greece | 15,024 |
| 52 | Brazil | 14,203 |
| 53 | Turkiye | 13,845 |
| 54 | Dominican Republic | 13,406 |
| 55 | Iran, Islamic Rep. | 12,863 |
| 56 | Turkmenistan | 12,672 |
| 57 | Iraq | 12,375 |
| 58 | North Macedonia | 12,078 |
| 59 | Poland | 11,727 |
| 60 | Kazakhstan | 11,439 |
| 61 | Costa Rica | 11,286 |
| 62 | Romania | 10,834 |
| 63 | South Africa | 10,818 |
| 64 | Tunisia | 10,315 |
| 65 | Uzbekistan | 9,913 |
| 66 | Belarus | 9,357 |
| 67 | Belize | 9,344 |
| 68 | Egypt, Arab Rep. | 8,942 |
| 69 | Maldives | 8,672 |
| 70 | China | 8,631 |
| 71 | Libya | 8,540 |
| 72 | St. Vincent and the Grenadines | 8,102 |
| 73 | Paraguay | 7,663 |
| 74 | St. Lucia | 7,235 |
| 75 | Sao Tome and Principe | 7,165 |
| 76 | Panama | 6,742 |
| 77 | Colombia | 6,622 |
| 78 | Gabon | 6,503 |
| 79 | Mexico | 6,490 |
| 80 | Eswatini | 6,090 |
| 81 | Albania | 5,888 |
| 82 | Bosnia and Herzegovina | 5,250 |
| 83 | Jamaica | 5,189 |
| 84 | Cabo Verde | 5,127 |
| 85 | Mauritania | 5,080 |
| 86 | Nepal | 5,039 |
| 87 | Mongolia | 5,004 |
| 88 | Samoa | 4,454 |
| 89 | Peru | 4,348 |
| 90 | Armenia | 4,070 |
| 91 | Serbia | 3,977 |
| 92 | Indonesia | 3,936 |
| 93 | Morocco | 3,898 |
| 94 | Comoros | 3,895 |
| 95 | Namibia | 3,836 |
| 96 | Ecuador | 3,802 |
| 97 | Ghana | 3,747 |
| 98 | Fiji | 3,699 |
| 99 | Thailand | 3,669 |
| 100 | Philippines | 3,499 |
| 101 | Nigeria | 3,495 |
| 102 | El Salvador | 3,482 |
| 103 | Guatemala | 3,459 |
| 104 | Viet Nam | 3,418 |
| 105 | Sri Lanka | 3,334 |
| 106 | Honduras | 3,256 |
| 107 | Pakistan | 3,186 |
| 108 | Azerbaijan | 2,755 |
| 109 | Kyrgyz Republic | 2,741 |
| 110 | Nicaragua | 2,673 |
| 111 | Angola | 2,574 |
| 112 | Sierra Leone | 2,550 |
| 113 | Georgia | 2,459 |
| 114 | Senegal | 2,432 |
| 115 | Cote d'Ivoire | 2,368 |
| 116 | Gambia, The | 2,218 |
| 117 | India | 2,159 |
| 118 | Benin | 1,994 |
| 119 | Bhutan | 1,990 |
| 120 | Botswana | 1,899 |
| 121 | Kenya | 1,633 |
| 122 | Rwanda | 1,615 |
| 123 | Moldova | 1,612 |
| 124 | Guinea | 1,608 |
| 125 | Togo | 1,577 |
| 126 | Cameroon | 1,574 |
| 127 | Cambodia | 1,553 |
| 128 | Chad | 1,539 |
| 129 | Liberia | 1,424 |
| 130 | Lao PDR | 1,301 |
| 131 | Mali | 1,277 |
| 132 | Congo, Rep. | 1,271 |
| 133 | Bangladesh | 1,236 |
| 134 | Myanmar | 1,206 |
| 135 | Ethiopia | 1,154 |
| 136 | Guinea-Bissau | 1,149 |
| 137 | Haiti | 944 |
| 138 | Tanzania | 855 |
| 139 | Zimbabwe | 826 |
| 140 | Uganda | 804 |
| 141 | Burkina Faso | 778 |
| 142 | Niger | 756 |
| 143 | Equatorial Guinea | 724 |
| 144 | Lesotho | 602 |
| 145 | Central African Republic | 548 |
| 146 | Mozambique | 498 |
| 147 | Malawi | 495 |
| 148 | Madagascar | 306 |
| 149 | Zambia | 304 |
| 150 | Congo, Dem. Rep. | 286 |
| 151 | Burundi | 211 |
Sixty-six source-missing entries are not zero values
The country master used for this dataset contains 217 country or territory rows. Of those, 151 had a 2025 value and 66 were source-missing. A missing observation does not mean that agriculture, forestry and fishing produced no value added, and treating missing entries as zero would artificially push those locations to the bottom of the ranking. The clean comparison is therefore restricted to places with an actual 2025 observation, while the missing group remains explicitly unranked.
Coverage also matters when describing the result. The 151 observations offer broad global reach, but they are not a complete census of every sovereign state and territory. World Bank country-level reporting can include separately reported territories and other statistical entities. It is more precise to say that 151 countries and territories had a reported 2025 observation than to describe the table as a ranking of 151 sovereign states.
What this dataset can and cannot support
The data support comparisons of the 2025 level, rank, median, quartiles, upper and lower groups, and the size of the cross-country spread. They do not by themselves establish which country has the “best” agricultural system, whether workers are better paid, or whether a specific policy caused a higher value. A causal assessment would need additional evidence on employment, capital stock, land productivity, crop and livestock mix, forestry and fishing output, input costs, trade, climate, irrigation and institutions.
Time comparisons also require discipline. The constant-price basis should remain the same, and the same indicator code should be followed across years. Mixing current-dollar values with constant-dollar values can make inflation or exchange-rate changes look like real productivity change. A 2025 cross-section is useful for locating countries within the current distribution, while a historical series would be needed to determine whether those positions are persistent or temporary.
Source and calculation method
The source is the World Bank World Development Indicators series NV.AGR.EMPL.KD for 2025. Aggregate regional groups were excluded so that the comparison contains country- and territory-level observations only. Rankings and summary statistics were calculated from the 151 reported values. The simple mean is unweighted, the median is the middle observation, and the quartiles divide the ordered observations into four parts. No imputation, interpolation or zero-filling was applied to the 66 missing entries.
When using this indicator alongside other agriculture measures, the denominator should always be checked. Total value added describes the economic size of the sector. Agriculture, forestry and fishing value added as a share of GDP describes the sector’s relative importance in the national economy. Value added per worker instead focuses on labor productivity. All three may be useful, but they answer different questions and can lead to very different country rankings.
Frequently Asked Questions
Which country had the highest agriculture, forestry and fishing value added per worker in 2025?
Canada ranked highest among reported 2025 observations at about $150,632 per worker in constant 2015 U.S. dollars, followed by Australia and Iceland.
Is value added per worker the same as an agricultural worker’s wage?
No. It is a sectoral productivity measure that relates value added in agriculture, forestry and fishing to workers. It is not an average wage or household-income measure.
Should countries without a 2025 observation be treated as zero?
No. Sixty-six country or territory rows were source-missing for 2025. Missing values were kept as missing and excluded from the 151-observation ranking.
Related Articles
Green Map creates custom-edited map images using open geographic data sources such as geoBoundaries, Natural Earth, OpenStreetMap, and government open data. These maps are edited visual materials, not raw data files, and are provided for education, documents, presentations, and graphic reference.