The share of GDP generated by services varies widely across countries and territories. World Bank indicator NV.SRV.TOTL.ZS expresses services value added as a percentage of gross domestic product. The dataset used here contains 205 latest non-empty country or territory observations. Of those, 158 are dated 2025 and 31 are dated 2024; the remaining 16 are the most recent reported values from 2011 through 2023. The world map therefore answers a “latest available observation” question rather than pretending that all 205 places are measured in the same year.
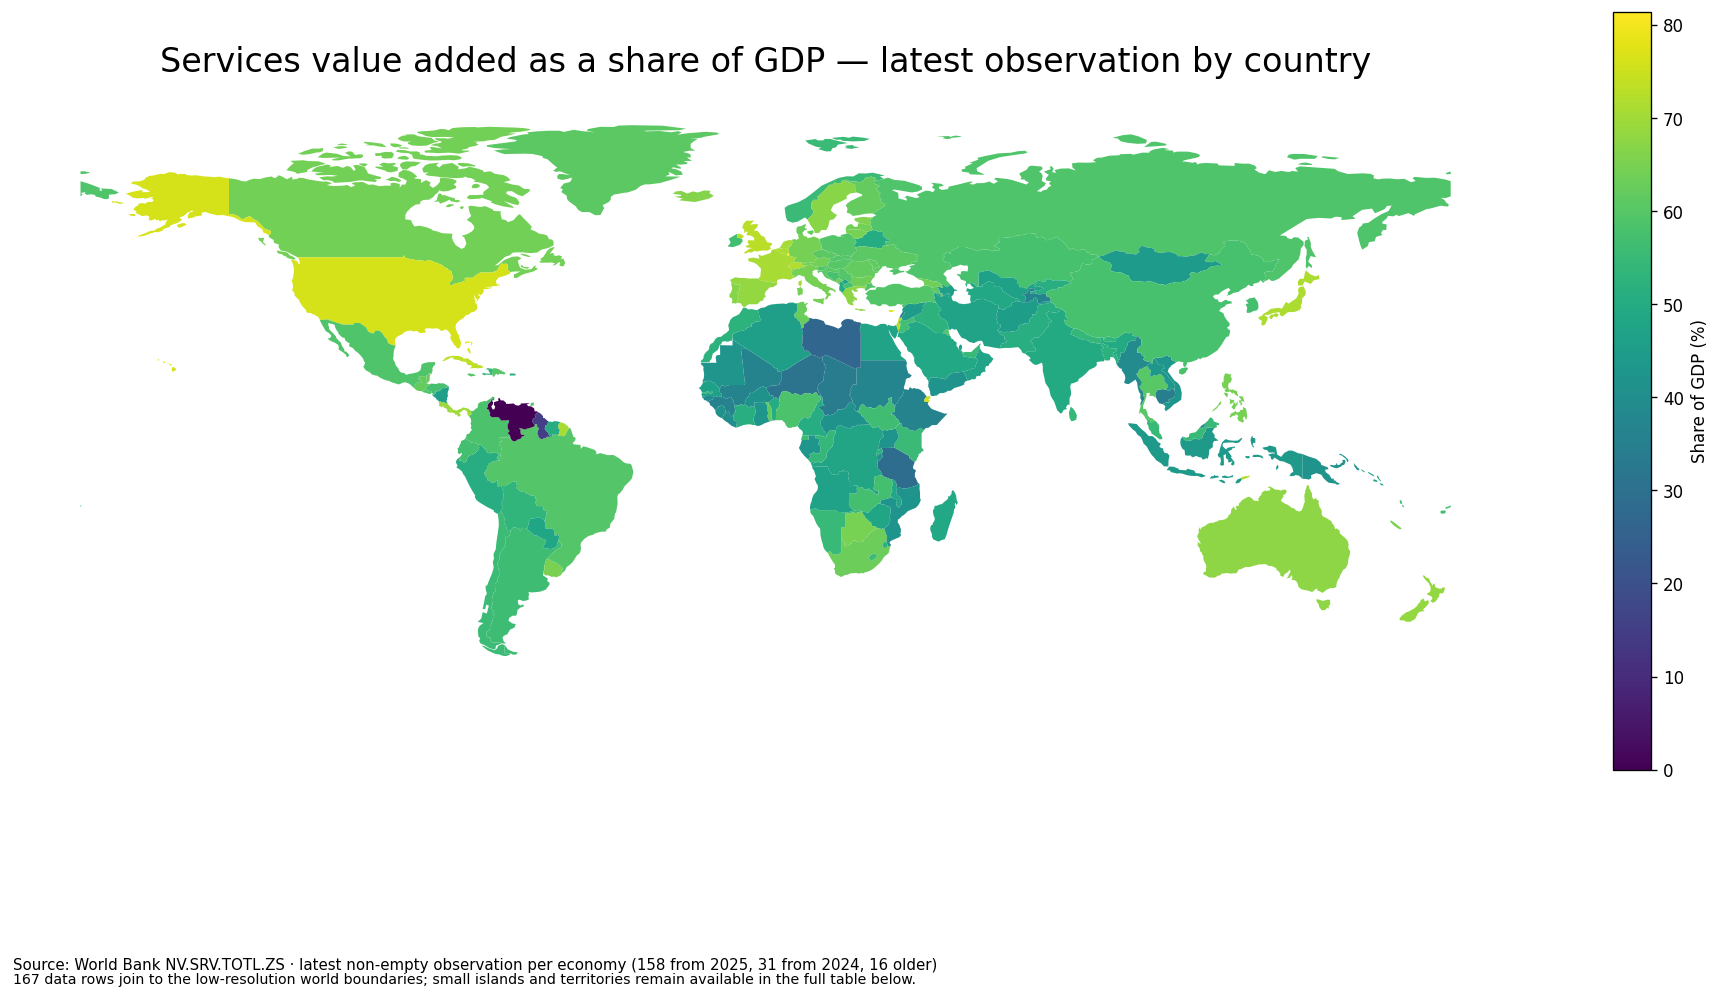
Table of Contents
What services value added as a share of GDP measures
The numerator is the value added generated in services and the denominator is GDP. Value added is the new economic value created after intermediate inputs are taken into account; it is not the sector’s gross sales. A reading of 70% therefore does not mean that 70% of people work in services, that 70% of household income comes from services, or that services employ seven out of ten workers. It means that services account for roughly seven-tenths of the economy’s measured value added relative to GDP under this indicator.
The percentage is best read as an economic-structure measure. A high services share does not automatically mean that an economy is larger, richer or more productive overall. A country with a large mining, manufacturing, agriculture or construction sector can have a lower services share even while maintaining a substantial services industry in absolute terms. Conversely, a small economy can have a very high services share without having a large services sector in dollar terms. Absolute GDP, GDP per capita, employment and sector-specific productivity answer different questions.
More than nine in ten latest observations are from 2024 or 2025
Of the 205 latest non-empty observations, 189 are from 2024 or 2025, equal to 92.2% of the dataset. There are 158 observations from 2025 and 31 from 2024. Seven are from 2023, two each from 2022 and 2021, and one each from 2020, 2019, 2018, 2015 and 2011. That freshness profile matters because sorting the latest values without showing the year can make an older observation look directly comparable with a 2025 value.
| Observation year | Countries/territories | Share of 205 rows |
|---|---|---|
| 2025 | 158 | 77.1% |
| 2024 | 31 | 15.1% |
| 2023 | 7 | 3.4% |
| 2022 | 2 | 1.0% |
| 2021 | 2 | 1.0% |
| 2020 | 1 | 0.5% |
| 2019 | 1 | 0.5% |
| 2018 | 1 | 0.5% |
| 2015 | 1 | 0.5% |
| 2011 | 1 | 0.5% |
Venezuela illustrates the problem clearly. Its latest non-empty row in this extract is 0.00% and is dated 2011. The value is present in the source data, so it is not treated as missing, but it should not be interpreted as a current 2025 description of Venezuela’s economic structure. It remains visible in the full latest-observation table with its year attached, while all same-year distribution statistics below use only the 158 observations actually dated 2025.
The 2025 median is 56.96% across 158 observations
Among the 158 observations dated 2025, the simple mean is 55.74% and the median is 56.96%. The first quartile is 48.10% and the third quartile is 63.92%, placing the middle half of reported economies between about 48.1% and 63.9%. A total of 109 observations are at or above 50%, 58 are at or above 60%, and 15 are at or above 70%. Thirteen are below 40%. The mean and median are close, so the 2025 distribution is not dominated by only a handful of extremely high observations.
Those thresholds help put individual values in context. A services share around 50% lies within a broad central range rather than representing an unusually service-heavy economy. Values above 60% are common enough to include more than one-third of the 2025 sample, while 70% or more is much less frequent. This is more informative than attaching a binary label such as “service economy” to every country above an arbitrary cutoff.
Luxembourg, São Tomé and Príncipe, and Malta lead the 2025 observations
Luxembourg has the highest 2025 observation at 81.45%, followed extremely closely by São Tomé and Príncipe at 81.39% and Malta at 81.33%. Andorra is at 77.79%, Cyprus at 76.85%, Djibouti at 75.66%, Saint Lucia at 73.81%, and the United Kingdom at 73.10%. Samoa, Switzerland, Singapore, Belgium, France, the Netherlands and Panama complete the set of 15 economies at or above 70% in 2025.
| 2025 rank | Country/territory | Services value added / GDP |
|---|---|---|
| 1 | Luxembourg | 81.45% |
| 2 | Sao Tome and Principe | 81.39% |
| 3 | Malta | 81.33% |
| 4 | Andorra | 77.79% |
| 5 | Cyprus | 76.85% |
| 6 | Djibouti | 75.66% |
| 7 | St. Lucia | 73.81% |
| 8 | United Kingdom | 73.10% |
| 9 | Samoa | 72.09% |
| 10 | Switzerland | 71.75% |
| 11 | Singapore | 71.59% |
| 12 | Belgium | 71.23% |
| 13 | France | 70.85% |
| 14 | Netherlands | 70.41% |
| 15 | Panama | 70.02% |
| 16 | Maldives | 69.86% |
| 17 | Costa Rica | 69.22% |
| 18 | Antigua and Barbuda | 68.66% |
| 19 | Spain | 68.36% |
| 20 | Seychelles | 67.93% |
| 21 | Cabo Verde | 67.92% |
| 22 | Australia | 67.49% |
| 23 | Greece | 67.45% |
| 24 | Sweden | 67.03% |
| 25 | Portugal | 66.55% |
The upper end is geographically diverse. Several European economies appear, but so do small island economies, a major Asian services hub and countries in Africa and the Americas. The same percentage can also arise from different mixes of activities. Finance and professional services may matter more in one economy, tourism and transport in another, and public or personal services elsewhere. NV.SRV.TOTL.ZS does not decompose those components, so the map shows where the services share is high but cannot, by itself, establish why.
The lowest 2025 shares are concentrated below 40% in 13 economies
Guyana records the lowest 2025 observation at 14.85%, followed by Libya at 26.91% and Tanzania at 28.76%. Niger is at 31.09%, Chad at 33.89%, Cambodia at 34.98%, Guinea at 35.73%, Mali at 36.56%, Ethiopia at 36.57%, and Sudan at 36.99%. Myanmar, Guinea-Bissau and Liberia bring the count below 40% to 13 economies.
| 2025 rank | Country/territory | Services value added / GDP |
|---|---|---|
| 20 | Guyana | 14.85% |
| 19 | Libya | 26.91% |
| 18 | Tanzania | 28.76% |
| 17 | Niger | 31.09% |
| 16 | Chad | 33.89% |
| 15 | Cambodia | 34.98% |
| 14 | Guinea | 35.73% |
| 13 | Mali | 36.56% |
| 12 | Ethiopia | 36.57% |
| 11 | Sudan | 36.99% |
| 10 | Myanmar | 38.50% |
| 9 | Guinea-Bissau | 39.07% |
| 8 | Liberia | 39.97% |
| 7 | Brunei Darussalam | 40.24% |
| 6 | Central African Republic | 41.38% |
| 5 | Burkina Faso | 41.52% |
| 4 | Sierra Leone | 41.60% |
| 3 | Mozambique | 42.02% |
| 2 | Burundi | 42.05% |
| 1 | Uganda | 42.09% |
A low percentage should not be read as an absence of services. It means that other sectors occupy a larger share of GDP. Resource extraction, agriculture, manufacturing or construction can all reduce the services percentage mechanically when their own value added is large. The indicator therefore describes the composition of output; it is not a score of economic quality, institutional strength or living standards.
The map shows broad spatial patterns, while the table retains small territories
The low-resolution world boundaries match 167 of the 205 data rows by country code after standard code reconciliation. That gives good coverage of large sovereign-country polygons, but a number of small islands and separately reported territories do not have their own polygon in this boundary layer. Their data are not discarded: the complete 205-row table below preserves the value and observation year even when the territory is too small or absent from the map geometry.
This limitation matters because several of the highest latest observations belong to places that are difficult to show on a low-resolution world map. The Isle of Man is 95.17% in 2023, Macao SAR is 92.03% in 2024, Hong Kong SAR is 91.45% in 2024, Bermuda is 91.31% in 2024, and the Channel Islands are 91.18% in 2023. These values are useful as latest available observations, but they should not be mixed into a 2025 ranking without keeping their dates visible.
Complete table of 205 latest available observations
The table below sorts every latest non-empty observation from highest to lowest and keeps the observation year beside the value. “Order” is therefore an ordering of latest values, not a same-year league table. For a strict 2025 comparison, use the 2025 sections above. For a question such as “what is the latest services share reported for each economy?”, the full table is the appropriate view.
| Value order | Country/territory | Observation year | Services value added / GDP |
|---|---|---|---|
| 1 | Isle of Man | 2023 | 95.17% |
| 2 | Macao SAR, China | 2024 | 92.03% |
| 3 | Hong Kong SAR, China | 2024 | 91.45% |
| 4 | Bermuda | 2024 | 91.31% |
| 5 | Channel Islands | 2023 | 91.18% |
| 6 | Sint Maarten (Dutch part) | 2021 | 89.34% |
| 7 | Monaco | 2024 | 87.20% |
| 8 | Cayman Islands | 2024 | 86.54% |
| 9 | Luxembourg | 2025 | 81.45% |
| 10 | Sao Tome and Principe | 2025 | 81.39% |
| 11 | Malta | 2025 | 81.33% |
| 12 | Andorra | 2025 | 77.79% |
| 13 | Bahamas, The | 2024 | 77.19% |
| 14 | Cyprus | 2025 | 76.85% |
| 15 | Aruba | 2023 | 76.28% |
| 16 | United States | 2021 | 76.26% |
| 17 | French Polynesia | 2020 | 75.90% |
| 18 | Barbados | 2024 | 75.84% |
| 19 | Djibouti | 2025 | 75.66% |
| 20 | St. Lucia | 2025 | 73.81% |
| 21 | Cuba | 2024 | 73.39% |
| 22 | United Kingdom | 2025 | 73.10% |
| 23 | Palau | 2024 | 73.08% |
| 24 | Israel | 2024 | 72.85% |
| 25 | Turks and Caicos Islands | 2024 | 72.64% |
| 26 | Curacao | 2024 | 72.30% |
| 27 | Samoa | 2025 | 72.09% |
| 28 | Switzerland | 2025 | 71.75% |
| 29 | Timor-Leste | 2024 | 71.63% |
| 30 | Singapore | 2025 | 71.59% |
| 31 | Japan | 2024 | 71.43% |
| 32 | Belgium | 2025 | 71.23% |
| 33 | France | 2025 | 70.85% |
| 34 | Netherlands | 2025 | 70.41% |
| 35 | Kiribati | 2024 | 70.28% |
| 36 | Panama | 2025 | 70.02% |
| 37 | Maldives | 2025 | 69.86% |
| 38 | Costa Rica | 2025 | 69.22% |
| 39 | Antigua and Barbuda | 2025 | 68.66% |
| 40 | Spain | 2025 | 68.36% |
| 41 | New Zealand | 2023 | 68.23% |
| 42 | Marshall Islands | 2024 | 68.19% |
| 43 | Seychelles | 2025 | 67.93% |
| 44 | Cabo Verde | 2025 | 67.92% |
| 45 | Australia | 2025 | 67.49% |
| 46 | Greece | 2025 | 67.45% |
| 47 | Sweden | 2025 | 67.03% |
| 48 | Portugal | 2025 | 66.55% |
| 49 | St. Vincent and the Grenadines | 2025 | 66.36% |
| 50 | Iceland | 2025 | 66.23% |
| 51 | St. Kitts and Nevis | 2025 | 66.16% |
| 52 | Estonia | 2025 | 65.82% |
| 53 | Micronesia, Fed. Sts. | 2025 | 65.26% |
| 54 | New Caledonia | 2019 | 65.19% |
| 55 | Uruguay | 2025 | 65.17% |
| 56 | Grenada | 2025 | 64.94% |
| 57 | Lithuania | 2025 | 64.80% |
| 58 | Botswana | 2025 | 64.63% |
| 59 | Italy | 2025 | 64.51% |
| 60 | Germany | 2025 | 64.46% |
| 61 | Philippines | 2025 | 64.42% |
| 62 | Latvia | 2025 | 64.25% |
| 63 | Canada | 2022 | 64.11% |
| 64 | Austria | 2025 | 64.05% |
| 65 | Georgia | 2025 | 63.94% |
| 66 | Mauritius | 2025 | 63.87% |
| 67 | Montenegro | 2025 | 63.38% |
| 68 | Bulgaria | 2025 | 63.31% |
| 69 | South Africa | 2025 | 63.07% |
| 70 | Tunisia | 2025 | 62.69% |
| 71 | Denmark | 2025 | 62.66% |
| 72 | Belize | 2024 | 62.44% |
| 73 | Guatemala | 2025 | 62.13% |
| 74 | Finland | 2025 | 62.09% |
| 75 | Romania | 2025 | 61.74% |
| 76 | Togo | 2025 | 61.71% |
| 77 | Moldova | 2025 | 61.46% |
| 78 | Armenia | 2025 | 61.34% |
| 79 | Ukraine | 2025 | 60.99% |
| 80 | Greenland | 2023 | 60.99% |
| 81 | Croatia | 2025 | 60.93% |
| 82 | Czechia | 2025 | 60.80% |
| 83 | West Bank and Gaza | 2024 | 60.21% |
| 84 | Thailand | 2025 | 60.18% |
| 85 | Dominican Republic | 2025 | 60.10% |
| 86 | Hungary | 2025 | 60.06% |
| 87 | Jamaica | 2025 | 59.84% |
| 88 | Slovak Republic | 2025 | 59.81% |
| 89 | Poland | 2025 | 59.74% |
| 90 | Brazil | 2025 | 59.74% |
| 91 | Serbia | 2025 | 59.73% |
| 92 | Kuwait | 2025 | 59.62% |
| 93 | Turkiye | 2025 | 59.42% |
| 94 | Trinidad and Tobago | 2024 | 59.18% |
| 95 | Mexico | 2025 | 58.90% |
| 96 | Russian Federation | 2025 | 58.88% |
| 97 | El Salvador | 2025 | 58.87% |
| 98 | Slovenia | 2025 | 58.64% |
| 99 | Colombia | 2025 | 58.51% |
| 100 | Nigeria | 2025 | 58.23% |
| 101 | Kazakhstan | 2025 | 57.70% |
| 102 | China | 2025 | 57.70% |
| 103 | Bosnia and Herzegovina | 2025 | 57.69% |
| 104 | Honduras | 2025 | 57.57% |
| 105 | Liechtenstein | 2023 | 57.43% |
| 106 | Korea, Rep. | 2025 | 57.23% |
| 107 | Dominica | 2025 | 57.22% |
| 108 | Zambia | 2025 | 57.03% |
| 109 | Ecuador | 2025 | 56.97% |
| 110 | Fiji | 2025 | 56.96% |
| 111 | North Macedonia | 2025 | 56.95% |
| 112 | San Marino | 2023 | 56.90% |
| 113 | Jordan | 2025 | 56.77% |
| 114 | Vanuatu | 2024 | 56.77% |
| 115 | Ireland | 2025 | 56.74% |
| 116 | South Sudan | 2015 | 56.55% |
| 117 | Argentina | 2025 | 56.15% |
| 118 | Lesotho | 2025 | 55.60% |
| 119 | Equatorial Guinea | 2025 | 55.51% |
| 120 | Chile | 2025 | 55.51% |
| 121 | Kenya | 2025 | 55.05% |
| 122 | Norway | 2025 | 55.05% |
| 123 | Namibia | 2025 | 54.98% |
| 124 | United Arab Emirates | 2024 | 54.90% |
| 125 | Malaysia | 2025 | 54.83% |
| 126 | Sri Lanka | 2025 | 54.63% |
| 127 | Nepal | 2025 | 54.37% |
| 128 | Bahrain | 2025 | 54.32% |
| 129 | Congo, Rep. | 2025 | 54.28% |
| 130 | Haiti | 2025 | 54.19% |
| 131 | Faroe Islands | 2024 | 53.83% |
| 132 | Bolivia | 2024 | 53.36% |
| 133 | Bhutan | 2025 | 53.16% |
| 134 | Gambia, The | 2025 | 53.07% |
| 135 | Eswatini | 2025 | 52.43% |
| 136 | Rwanda | 2025 | 52.33% |
| 137 | Morocco | 2025 | 52.31% |
| 138 | Iraq | 2025 | 52.27% |
| 139 | Bangladesh | 2025 | 52.13% |
| 140 | Puerto Rico (US) | 2025 | 51.90% |
| 141 | Kyrgyz Republic | 2025 | 51.19% |
| 142 | Cote d'Ivoire | 2025 | 51.17% |
| 143 | Pakistan | 2025 | 50.93% |
| 144 | Peru | 2024 | 50.87% |
| 145 | Suriname | 2024 | 50.85% |
| 146 | Cameroon | 2025 | 50.36% |
| 147 | Benin | 2025 | 50.06% |
| 148 | Belarus | 2025 | 49.98% |
| 149 | Albania | 2025 | 49.72% |
| 150 | Tonga | 2024 | 49.54% |
| 151 | India | 2025 | 49.34% |
| 152 | Saudi Arabia | 2025 | 48.93% |
| 153 | Turkmenistan | 2025 | 48.88% |
| 154 | Madagascar | 2025 | 48.83% |
| 155 | Comoros | 2025 | 48.81% |
| 156 | Malawi | 2025 | 48.66% |
| 157 | Zimbabwe | 2025 | 48.17% |
| 158 | Paraguay | 2025 | 48.07% |
| 159 | Congo, Dem. Rep. | 2025 | 47.96% |
| 160 | Egypt, Arab Rep. | 2025 | 47.31% |
| 161 | Oman | 2025 | 47.21% |
| 162 | Iran, Islamic Rep. | 2025 | 47.09% |
| 163 | Qatar | 2025 | 47.01% |
| 164 | Solomon Islands | 2024 | 46.92% |
| 165 | Angola | 2025 | 46.83% |
| 166 | Uzbekistan | 2025 | 46.49% |
| 167 | Senegal | 2025 | 46.33% |
| 168 | Kosovo | 2025 | 46.19% |
| 169 | Algeria | 2025 | 45.68% |
| 170 | Azerbaijan | 2025 | 45.29% |
| 171 | Nicaragua | 2025 | 45.20% |
| 172 | Afghanistan | 2024 | 45.16% |
| 173 | Syrian Arab Republic | 2022 | 44.72% |
| 174 | Mongolia | 2025 | 44.34% |
| 175 | Indonesia | 2025 | 43.94% |
| 176 | Lao PDR | 2025 | 43.57% |
| 177 | Ghana | 2025 | 42.87% |
| 178 | Viet Nam | 2025 | 42.74% |
| 179 | Mauritania | 2025 | 42.37% |
| 180 | Gabon | 2025 | 42.34% |
| 181 | Uganda | 2025 | 42.09% |
| 182 | Burundi | 2025 | 42.05% |
| 183 | Mozambique | 2025 | 42.02% |
| 184 | Papua New Guinea | 2024 | 41.96% |
| 185 | Yemen, Rep. | 2018 | 41.81% |
| 186 | Sierra Leone | 2025 | 41.60% |
| 187 | Burkina Faso | 2025 | 41.52% |
| 188 | Central African Republic | 2025 | 41.38% |
| 189 | Brunei Darussalam | 2025 | 40.24% |
| 190 | Liberia | 2025 | 39.97% |
| 191 | Guinea-Bissau | 2025 | 39.07% |
| 192 | Myanmar | 2025 | 38.50% |
| 193 | Sudan | 2025 | 36.99% |
| 194 | Ethiopia | 2025 | 36.57% |
| 195 | Mali | 2025 | 36.56% |
| 196 | Tajikistan | 2024 | 36.45% |
| 197 | Lebanon | 2024 | 35.73% |
| 198 | Guinea | 2025 | 35.73% |
| 199 | Cambodia | 2025 | 34.98% |
| 200 | Chad | 2025 | 33.89% |
| 201 | Niger | 2025 | 31.09% |
| 202 | Tanzania | 2025 | 28.76% |
| 203 | Libya | 2025 | 26.91% |
| 204 | Guyana | 2025 | 14.85% |
| 205 | Venezuela, RB | 2011 | 0.00% |
Three cautions make the indicator more useful
First, a share is not an absolute amount. A large economy can generate vastly more services value added in dollar terms while posting a lower percentage than a small economy. Second, value-added share is not employment share. Differences in productivity and capital intensity mean the two can diverge substantially. Third, a changing services share does not necessarily mean services themselves rose or fell at the same rate, because changes in the GDP denominator and in other sectors also affect the ratio.
The time dimension is equally important. The latest-observation map maximizes geographic coverage but includes mixed years. Analysts who need a clean cross-section should restrict comparisons to the 158 rows dated 2025 or choose an earlier year with broader common coverage. Readers who simply want the freshest non-empty figure reported for each place can use the 205-row table, provided they keep the year column in view.
Source and calculation method
The source is the World Bank World Development Indicators series NV.SRV.TOTL.ZS, Services, value added (% of GDP). The source extract supplies the most recent non-empty value for 205 real economies or separately reported territories. The latest-observation map and complete table use all 205 rows. The same-year statistics, thresholds and 2025 rankings are calculated only from the 158 rows whose observation year is 2025. No missing value is converted to zero and no older observation is relabeled as a 2025 value.
For the map, country codes are joined to a low-resolution world boundary layer. Small territories that have a valid World Bank observation but no separate polygon remain available in the table. This separation between spatial overview and full numerical listing avoids implying that a territory is missing from the data merely because it cannot be drawn clearly at world-map scale.
Frequently Asked Questions
Which economy has the highest services share of GDP among 2025 observations?
Luxembourg is highest among the 158 observations dated 2025 at 81.45%, followed very closely by São Tomé and Príncipe and Malta.
Are all 205 values on the map from 2025?
No. There are 158 observations from 2025, 31 from 2024 and 16 latest non-empty observations from 2011–2023. The latest-observation map should be distinguished from the strict 2025 comparison.
Does a higher services share mean an economy is more developed?
Not by itself. The indicator describes the composition of GDP. It does not directly measure economic size, income, employment, productivity or living standards.
Related Articles
Green Map creates custom-edited map images using open geographic data sources such as geoBoundaries, Natural Earth, OpenStreetMap, and government open data. These maps are edited visual materials, not raw data files, and are provided for education, documents, presentations, and graphic reference.