Water productivity links economic output to the volume of freshwater withdrawn. The World Bank indicator ER.GDP.FWTL.M3.KD divides GDP measured in constant 2015 U.S. dollars by total freshwater withdrawal, producing a value in constant dollars per cubic meter. The fixed-year 2022 dataset contains 217 country and territory rows. 175 have numeric observations and 42 are source-missing. The map and ranking below therefore compare the 175 observed values and preserve missing entries as missing rather than converting them to zero.
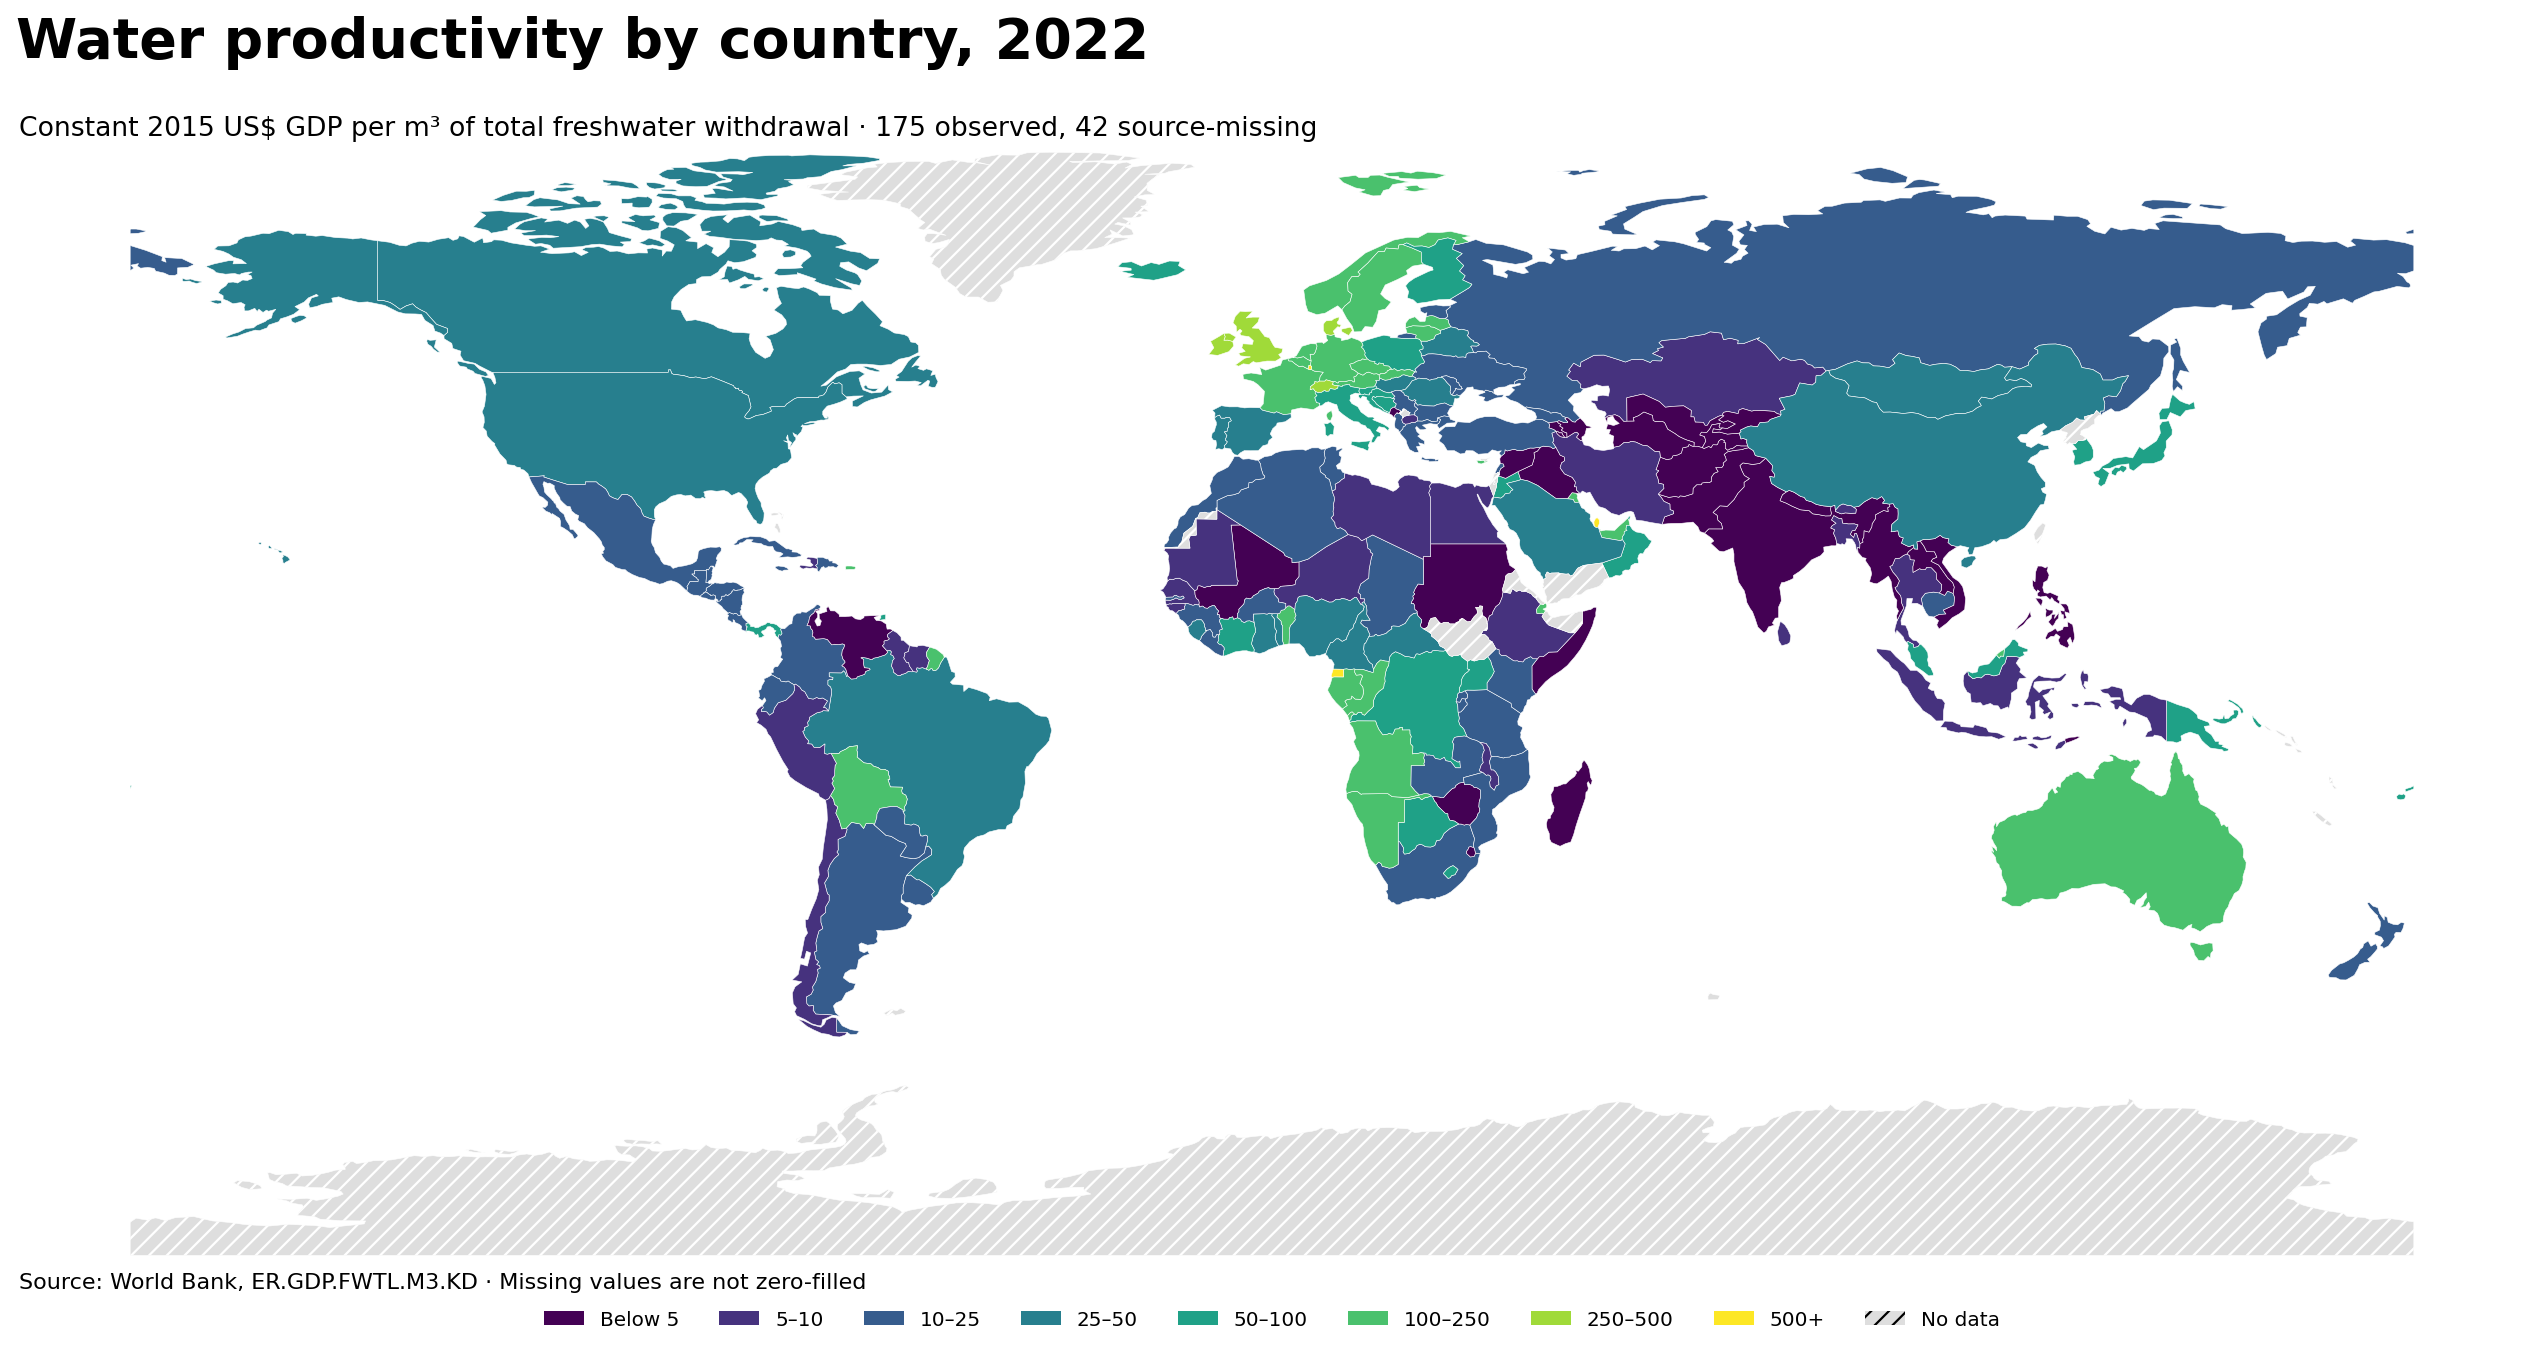
Table of Contents
What the water productivity indicator measures
The numerator is real GDP at constant 2015 prices and the denominator is total annual freshwater withdrawal. A value of 50 means that roughly 50 constant-2015 U.S. dollars of GDP correspond to each cubic meter of freshwater withdrawn within the economy. The indicator is useful because it puts economic activity and direct freshwater abstraction on a common scale, but it is not a direct measure of water quality, household access, renewable water availability, or the ecological condition of rivers and aquifers.
A high figure should not automatically be read as superior water management. Economies with large service sectors can generate substantial GDP while withdrawing comparatively little freshwater directly. Small economies may also import a large share of food and manufactured goods, which means some of the water used to support consumption is withdrawn abroad and does not appear in the domestic denominator. Conversely, economies with extensive irrigated agriculture or water-intensive industry can record a lower ratio even when water use is economically important. The safest interpretation is therefore “GDP per cubic meter of direct total freshwater withdrawal,” not an all-purpose efficiency score.
The 2022 distribution is strongly right-skewed
Across the 175 observed economies, the simple mean is 99.33 constant-2015 US$/m³, while the median is only 23.50. The first quartile is 9.35, the third quartile is 81.25, and the 90th percentile is 178.62. The large gap between mean and median is a warning that a small set of extremely high observations pulls the average upward. The median is therefore a better description of a typical country in this cross-section.
| Range (constant 2015 US$/m³) | Economies |
|---|---|
| Below 5 | 25 |
| 5–10 | 22 |
| 10–25 | 45 |
| 25–50 | 19 |
| 50–100 | 24 |
| 100–250 | 28 |
| 250–500 | 6 |
| 500 or more | 6 |
The largest group is the 10–25 range, with 45 observations. Forty economies reach at least 100 US$/m³, twelve reach 250 or more, and only four exceed 1,000. At the other end, twenty-five observations are below 5. This wide spread is why a logarithmic or grouped visual treatment is more informative than a single linear color scale dominated by the top few values. It also means that a world average on its own hides substantial differences in how GDP and freshwater withdrawal interact across economies.
The top of the ranking is dominated by a few extreme values
Singapore records the highest 2022 value at 1,928.75 US$/m³. Monaco follows at 1,669.05, Luxembourg at 1,470.19, and Maldives at 1,219.94. Qatar is fifth at 683.63, followed by Equatorial Guinea at 503.19, Switzerland at 480.89, Malta at 455.56, the United Kingdom at 388.91, and Denmark at 373.44. Because the first four observations are above 1,000, they have a disproportionate effect on the arithmetic mean.
| Rank | Economy | US$/m³ |
|---|---|---|
| 1 | Singapore | 1,928.75 |
| 2 | Monaco | 1,669.05 |
| 3 | Luxembourg | 1,470.19 |
| 4 | Maldives | 1,219.94 |
| 5 | Qatar | 683.63 |
| 6 | Equatorial Guinea | 503.19 |
| 7 | Switzerland | 480.89 |
| 8 | Malta | 455.56 |
| 9 | United Kingdom | 388.91 |
| 10 | Denmark | 373.44 |
| 11 | Antigua and Barbuda | 366.28 |
| 12 | Ireland | 304.71 |
| 13 | Bahrain | 248.06 |
| 14 | Sweden | 229.35 |
| 15 | Congo, Rep. | 221.20 |
These high values do not imply that the countries have solved every water problem. The ratio does not include the water embodied in imported products, and it does not show whether domestic withdrawals are sustainable relative to available resources. A service-heavy economy can sit near the top because the numerator is large compared with direct abstraction, while an arid high-income economy can still face severe supply constraints. The indicator should therefore be paired with measures such as water stress, renewable freshwater resources, groundwater trends, and sectoral withdrawal shares before drawing conclusions about resilience or sustainability.
The lowest values combine small GDP per withdrawal with diverse local conditions
Afghanistan has the lowest observed value at 0.76 US$/m³, followed by Madagascar at 0.99, the Kyrgyz Republic at 1.10, the Syrian Arab Republic at 1.15, and Tajikistan at 1.27. Venezuela is at 1.72, Sudan at 1.78, Timor-Leste at 1.85, Myanmar at 1.90, and Turkmenistan at 2.08. A low ratio can result from a large withdrawal denominator, a small real-GDP numerator, or both. The indicator itself does not tell us which component is responsible.
| Overall rank | Economy | US$/m³ |
|---|---|---|
| 175 | Afghanistan | 0.76 |
| 174 | Madagascar | 0.99 |
| 173 | Kyrgyz Republic | 1.10 |
| 172 | Syrian Arab Republic | 1.15 |
| 171 | Tajikistan | 1.27 |
| 170 | Venezuela, RB | 1.72 |
| 169 | Sudan | 1.78 |
| 168 | Timor-Leste | 1.85 |
| 167 | Myanmar | 1.90 |
| 166 | Turkmenistan | 2.08 |
| 165 | Montenegro | 2.20 |
| 164 | Pakistan | 2.23 |
| 163 | Somalia, Fed. Rep. | 2.48 |
| 162 | Lao PDR | 2.66 |
| 161 | Uzbekistan | 3.35 |
Several low observations occur in economies where irrigated agriculture is important, but the pattern should not be reduced to agriculture alone. Total freshwater withdrawal also includes municipal and industrial abstraction, and the GDP side of the ratio varies enormously across countries. Climate, infrastructure, cropping systems, industrial composition, water pricing, leakage, and measurement practices can all affect the underlying components. A causal explanation requires additional data rather than inference from this single cross-sectional ratio.
Large economies also occupy very different positions
The contrast is not limited to microstates. Germany records 144.53 US$/m³, Japan 58.79, the United States 48.35, China 29.39, Brazil 27.96, South Africa 17.10, and India 4.62. Korea, Rep. is at 63.37 and ranks 55th among the 175 observed entries. These differences show why GDP size alone does not determine the indicator. Water withdrawals, sector mix, irrigation intensity, industrial processes, urban structure, and the relative weight of services all affect the final ratio.
Two countries can have comparable levels of real output and still report very different water productivity if one withdraws substantially more freshwater. Likewise, a country can raise the ratio through faster real-GDP growth, lower freshwater withdrawal, or a combination of the two. Without looking at the numerator and denominator separately, the cross-country ranking cannot identify the mechanism. This is especially important when the ratio is used to discuss policy, because the same headline improvement can emerge from different economic or hydrological changes.
How to read the map without overstating precision
First, withdrawal is not identical to consumptive use. Some abstracted water is returned to rivers, lakes, or aquifers after use, so a consumption-based indicator can tell a different story. Second, this series does not measure how scarce water is relative to renewable supply. Two economies with the same GDP-per-withdrawal ratio can face very different drought or scarcity risks. Third, national statistics are compiled from different administrative and sectoral systems, so small differences between neighboring ranks should not be treated as exact performance gaps.
There is also a cartographic limitation. The World Bank table contains 175 numeric observations, while the low-resolution world boundary used for the figure can directly join about 158 of them after correcting the France and Norway ISO-code exceptions in that boundary file. Several small islands and city-states are too small to appear as separate polygons at this resolution. Their values are retained in the table below. The 42 source-missing rows remain missing and are never displayed as zero.
Complete ranking of the 175 observed economies
The table lists every numeric 2022 observation from highest to lowest. Values are rounded to two decimal places for readability, while the source dataset contains additional decimal precision. The unit is constant 2015 U.S. dollars of GDP per cubic meter of total freshwater withdrawal.
| Rank | Economy | Code | US$/m³ |
|---|---|---|---|
| 1 | Singapore | SGP | 1,928.75 |
| 2 | Monaco | MCO | 1,669.05 |
| 3 | Luxembourg | LUX | 1,470.19 |
| 4 | Maldives | MDV | 1,219.94 |
| 5 | Qatar | QAT | 683.63 |
| 6 | Equatorial Guinea | GNQ | 503.19 |
| 7 | Switzerland | CHE | 480.89 |
| 8 | Malta | MLT | 455.56 |
| 9 | United Kingdom | GBR | 388.91 |
| 10 | Denmark | DNK | 373.44 |
| 11 | Antigua and Barbuda | ATG | 366.28 |
| 12 | Ireland | IRL | 304.71 |
| 13 | Bahrain | BHR | 248.06 |
| 14 | Sweden | SWE | 229.35 |
| 15 | Congo, Rep. | COG | 221.20 |
| 16 | United Arab Emirates | ARE | 186.07 |
| 17 | Slovak Republic | SVK | 182.77 |
| 18 | Latvia | LVA | 179.08 |
| 19 | Lithuania | LTU | 177.93 |
| 20 | Djibouti | DJI | 177.13 |
| 21 | Norway | NOR | 170.05 |
| 22 | Seychelles | SYC | 164.22 |
| 23 | Kuwait | KWT | 158.41 |
| 24 | Czechia | CZE | 152.34 |
| 25 | Germany | DEU | 144.53 |
| 26 | Brunei Darussalam | BRN | 141.31 |
| 27 | Angola | AGO | 141.29 |
| 28 | Australia | AUS | 137.04 |
| 29 | Austria | AUT | 136.30 |
| 30 | Cyprus | CYP | 132.72 |
| 31 | Benin | BEN | 128.97 |
| 32 | Belgium | BEL | 120.92 |
| 33 | Gabon | GAB | 114.07 |
| 34 | Comoros | COM | 114.03 |
| 35 | Netherlands | NLD | 111.30 |
| 36 | St. Vincent and the Grenadines | VCT | 110.22 |
| 37 | Namibia | NAM | 109.61 |
| 38 | Puerto Rico (US) | PRI | 109.09 |
| 39 | France | FRA | 108.49 |
| 40 | Bolivia | BOL | 103.58 |
| 41 | Croatia | HRV | 94.37 |
| 42 | Barbados | BRB | 85.97 |
| 43 | Finland | FIN | 85.22 |
| 44 | Botswana | BWA | 81.91 |
| 45 | St. Kitts and Nevis | KNA | 80.60 |
| 46 | Grenada | GRD | 77.99 |
| 47 | Congo, Dem. Rep. | COD | 76.92 |
| 48 | Iceland | ISL | 75.91 |
| 49 | Uganda | UGA | 69.30 |
| 50 | Poland | POL | 67.89 |
| 51 | Bosnia and Herzegovina | BIH | 64.98 |
| 52 | Slovenia | SVN | 64.55 |
| 53 | Papua New Guinea | PNG | 64.20 |
| 54 | Trinidad and Tobago | TTO | 63.83 |
| 55 | Korea, Rep. | KOR | 63.37 |
| 56 | Italy | ITA | 59.20 |
| 57 | Japan | JPN | 58.79 |
| 58 | Cote d’Ivoire | CIV | 58.25 |
| 59 | Panama | PAN | 57.97 |
| 60 | Malaysia | MYS | 57.89 |
| 61 | Fiji | FJI | 57.30 |
| 62 | Oman | OMN | 54.40 |
| 63 | Jordan | JOR | 51.07 |
| 64 | Lesotho | LSO | 50.50 |
| 65 | Canada | CAN | 49.47 |
| 66 | United States | USA | 48.35 |
| 67 | Ghana | GHA | 47.31 |
| 68 | St. Lucia | LCA | 46.92 |
| 69 | Spain | ESP | 46.44 |
| 70 | Sierra Leone | SLE | 42.01 |
| 71 | Belarus | BLR | 40.51 |
| 72 | Nigeria | NGA | 40.33 |
| 73 | Portugal | PRT | 37.52 |
| 74 | Cameroon | CMR | 37.03 |
| 75 | Saudi Arabia | SAU | 36.75 |
| 76 | Togo | TGO | 35.12 |
| 77 | Hungary | HUN | 33.73 |
| 78 | Mongolia | MNG | 31.23 |
| 79 | China | CHN | 29.39 |
| 80 | Dominica | DMA | 28.70 |
| 81 | Romania | ROU | 28.22 |
| 82 | Central African Republic | CAF | 28.05 |
| 83 | Brazil | BRA | 27.96 |
| 84 | Belize | BLZ | 24.97 |
| 85 | Guatemala | GTM | 23.54 |
| 86 | Estonia | EST | 23.52 |
| 87 | Kenya | KEN | 23.51 |
| 88 | Liberia | LBR | 23.50 |
| 89 | Russian Federation | RUS | 22.90 |
| 90 | New Zealand | NZL | 21.98 |
| 91 | Mauritius | MUS | 21.38 |
| 92 | Greece | GRC | 21.35 |
| 93 | Rwanda | RWA | 20.94 |
| 94 | Costa Rica | CRI | 20.54 |
| 95 | Burkina Faso | BFA | 20.37 |
| 96 | Algeria | DZA | 20.08 |
| 97 | Turkiye | TUR | 18.81 |
| 98 | Lebanon | LBN | 18.73 |
| 99 | Gambia, The | GMB | 18.44 |
| 100 | Chad | TCD | 18.10 |
| 101 | Albania | ALB | 18.05 |
| 102 | Paraguay | PRY | 17.38 |
| 103 | South Africa | ZAF | 17.10 |
| 104 | Zambia | ZMB | 16.65 |
| 105 | Georgia | GEO | 16.47 |
| 106 | Honduras | HND | 16.16 |
| 107 | Argentina | ARG | 16.00 |
| 108 | Cambodia | KHM | 15.84 |
| 109 | Guinea | GIN | 15.59 |
| 110 | Ukraine | UKR | 14.88 |
| 111 | Colombia | COL | 14.62 |
| 112 | Mexico | MEX | 14.34 |
| 113 | El Salvador | SLV | 14.11 |
| 114 | Uruguay | URY | 13.73 |
| 115 | Dominican Republic | DOM | 13.69 |
| 116 | Mozambique | MOZ | 13.22 |
| 117 | Tanzania | TZA | 12.96 |
| 118 | Jamaica | JAM | 12.64 |
| 119 | Burundi | BDI | 12.54 |
| 120 | Tunisia | TUN | 12.50 |
| 121 | Cuba | CUB | 12.00 |
| 122 | Morocco | MAR | 11.95 |
| 123 | Cabo Verde | CPV | 11.60 |
| 124 | Nicaragua | NIC | 11.50 |
| 125 | Bulgaria | BGR | 11.40 |
| 126 | Ecuador | ECU | 10.98 |
| 127 | Moldova | MDA | 10.79 |
| 128 | Serbia | SRB | 10.29 |
| 129 | Haiti | HTI | 9.97 |
| 130 | Guyana | GUY | 9.88 |
| 131 | Ethiopia | ETH | 9.64 |
| 132 | Guinea-Bissau | GNB | 9.05 |
| 133 | Kazakhstan | KAZ | 8.87 |
| 134 | Libya | LBY | 8.84 |
| 135 | Peru | PER | 8.62 |
| 136 | Bangladesh | BGD | 8.52 |
| 137 | Malawi | MWI | 8.50 |
| 138 | Senegal | SEN | 8.26 |
| 139 | Chile | CHL | 7.89 |
| 140 | Thailand | THA | 7.86 |
| 141 | Sao Tome and Principe | STP | 7.76 |
| 142 | Bhutan | BTN | 7.74 |
| 143 | Suriname | SUR | 7.16 |
| 144 | Sri Lanka | LKA | 6.91 |
| 145 | Egypt, Arab Rep. | EGY | 5.86 |
| 146 | Mauritania | MRT | 5.72 |
| 147 | Niger | NER | 5.54 |
| 148 | North Macedonia | MKD | 5.27 |
| 149 | Iran, Islamic Rep. | IRN | 5.26 |
| 150 | Indonesia | IDN | 5.04 |
| 151 | Armenia | ARM | 4.63 |
| 152 | India | IND | 4.62 |
| 153 | Iraq | IRQ | 4.58 |
| 154 | Zimbabwe | ZWE | 4.48 |
| 155 | Philippines | PHL | 4.48 |
| 156 | Viet Nam | VNM | 4.41 |
| 157 | Azerbaijan | AZE | 4.36 |
| 158 | Eswatini | SWZ | 4.22 |
| 159 | Mali | MLI | 3.91 |
| 160 | Nepal | NPL | 3.48 |
| 161 | Uzbekistan | UZB | 3.35 |
| 162 | Lao PDR | LAO | 2.66 |
| 163 | Somalia, Fed. Rep. | SOM | 2.48 |
| 164 | Pakistan | PAK | 2.23 |
| 165 | Montenegro | MNE | 2.20 |
| 166 | Turkmenistan | TKM | 2.08 |
| 167 | Myanmar | MMR | 1.90 |
| 168 | Timor-Leste | TLS | 1.85 |
| 169 | Sudan | SDN | 1.78 |
| 170 | Venezuela, RB | VEN | 1.72 |
| 171 | Tajikistan | TJK | 1.27 |
| 172 | Syrian Arab Republic | SYR | 1.15 |
| 173 | Kyrgyz Republic | KGZ | 1.10 |
| 174 | Madagascar | MDG | 0.99 |
| 175 | Afghanistan | AFG | 0.76 |
What this comparison can and cannot answer
Water productivity is most useful as a screening indicator. It identifies places where the relationship between economic output and direct freshwater abstraction differs sharply, helping readers decide where deeper investigation is warranted. For a low value, useful follow-up questions include whether irrigation dominates withdrawals, whether network losses are high, whether water-intensive industry is important, and how real GDP per person compares. For a high value, it is still necessary to ask about water stress, imported water footprints, groundwater depletion, drought exposure, and the distribution of withdrawals across sectors.
The main 2022 result is the scale of dispersion. The median is 23.50 US$/m³, yet a handful of observations exceed several hundred or even one thousand, while many others sit below 5. No single global average captures that structure well. A country-specific assessment should therefore combine this ratio with the underlying GDP and withdrawal series and with independent hydrological indicators. Used that way, the map is a compact comparison tool rather than a verdict on which country manages water “best.”
Frequently Asked Questions
Which economy had the highest water productivity in 2022?
Among the 175 observed values, Singapore was highest at 1,928.75 constant-2015 US$/m³, followed by Monaco, Luxembourg, and Maldives.
Does higher water productivity mean lower water scarcity?
No. The indicator divides real GDP by total freshwater withdrawal; it does not directly measure renewable water availability, water stress, drought risk, or ecosystem condition.
Were missing observations treated as zero?
No. Of 217 country and territory rows, 175 have numeric 2022 values and 42 are source-missing. Missing entries remain missing.
Related Articles
Green Map creates custom-edited map images using open geographic data sources such as geoBoundaries, Natural Earth, OpenStreetMap, and government open data. These maps are edited visual materials, not raw data files, and are provided for education, documents, presentations, and graphic reference.