The World Bank’s TT.PRI.MRCH.XD.WD series measures the net barter terms of trade index, with 2015 set equal to 100. It compares an export unit value index with an import unit value index, so the 2024 figure shows how the relative price of exports versus imports stands against each economy’s own 2015 baseline. The common-year table contains 217 economies and territories. 203 have numeric values and 14 are source-missing. Missing entries remain missing rather than being converted to zero.
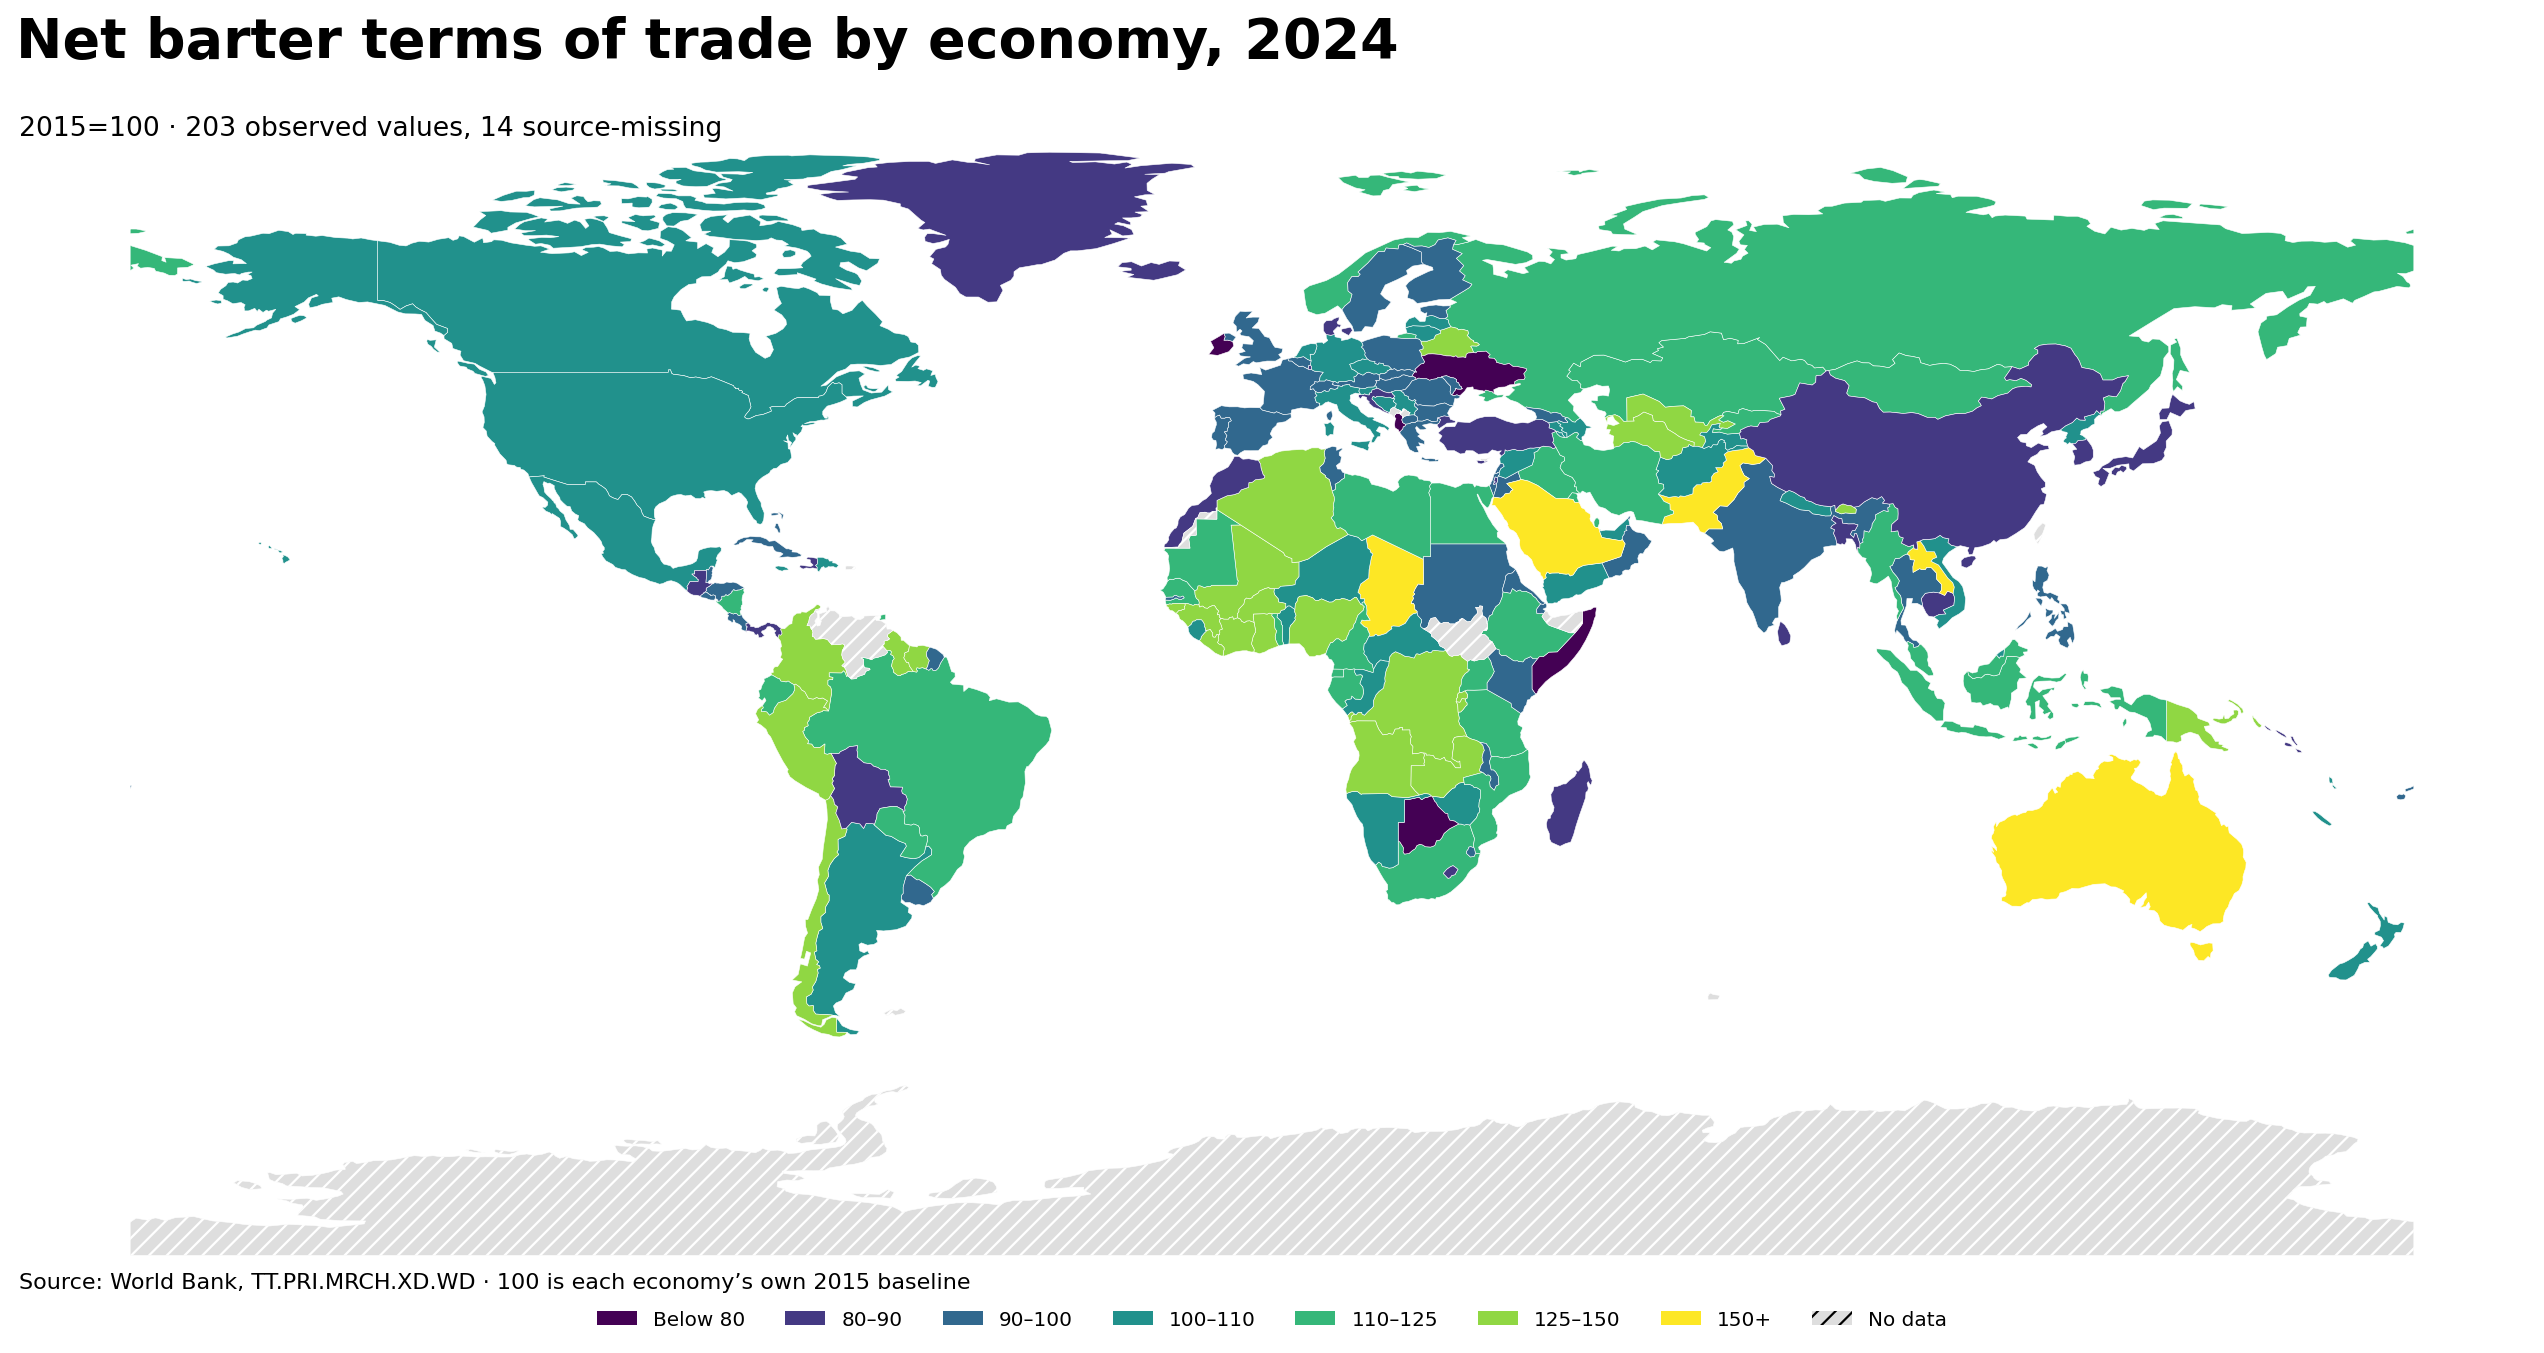
Table of Contents
The baseline is country-specific, so 100 is not a world average
A reading of 120 means that the export-unit-value to import-unit-value ratio is about 20 percent above that economy’s 2015 reference level. A reading of 80 places the ratio about 20 percent below its own 2015 baseline. This does not mean that a country at 120 has an absolute terms-of-trade level that is 40 points better than a country at 80. Every economy is indexed to its own starting point. Cross-country rankings therefore compare the size and direction of movement from 2015, not a common international price level.
The indicator is also not the trade balance, export growth, import dependence, or the volume of trade. An economy can experience a favorable movement in relative export prices while export volumes fall, or it can record a lower index while total export receipts rise because quantities expand. The series is best used to understand a price relationship: how the prices of what an economy sells abroad have moved relative to the prices of what it buys from abroad.
More observations were above the 2015 baseline than below it
Among the 203 observed economies and territories, 110 have values above 100 and 93 are below 100; none is exactly 100. The median is 101.1 and the simple mean is 105.5. The first quartile is 93.4 and the third quartile is 118.0. The median being only slightly above 100 indicates that the middle of the distribution remained relatively close to the base-year position even though a smaller group moved much farther in either direction.
| Index range | Economies |
|---|---|
| Below 80 | 10 |
| 80–90 | 29 |
| 90–100 | 54 |
| 100–110 | 44 |
| 110–125 | 34 |
| 125–150 | 26 |
| 150 or more | 6 |
Most observations cluster around the baseline rather than at the extremes. The 90–100 and 100–110 bands contain a large share of the dataset, while only a small group reaches 150 or more and another small group falls below 80. For this reason the most useful reading of the map is not simply “top versus bottom.” It is whether economies sit near their 2015 position or have experienced a large relative-price shift away from it.
The highest readings include commodity exporters and several unusual cases
Saudi Arabia has the highest 2024 value at 168.9. American Samoa is at 167.2, Australia at 160.5, Pakistan at 155.7, Lao PDR at 155.0, and Chad at 150.6. Ghana records 148.8, Mali and Peru 145.0, the Democratic Republic of the Congo 142.4, Colombia 140.1, and Guyana 139.5. These values mean the export-to-import unit-value ratio is substantially higher than in 2015 for each economy, but they do not reveal which price component caused the movement.
| Rank | Economy or territory | Index |
|---|---|---|
| 1 | Saudi Arabia | 168.9 |
| 2 | American Samoa | 167.2 |
| 3 | Australia | 160.5 |
| 4 | Pakistan | 155.7 |
| 5 | Lao PDR | 155.0 |
| 6 | Chad | 150.6 |
| 7 | Ghana | 148.8 |
| 8 | Mali | 145.0 |
| 9 | Peru | 145.0 |
| 10 | Congo, Dem. Rep. | 142.4 |
| 11 | Colombia | 140.1 |
| 12 | Guyana | 139.5 |
| 13 | Algeria | 138.2 |
| 14 | Suriname | 137.9 |
| 15 | Cote d’Ivoire | 136.2 |
The presence of resource exporters near the top is a useful geographic clue, not a complete explanation. Oil, metals, agricultural commodities, manufactured goods, and imported energy or capital equipment all enter national trade baskets with different weights. A rise in one major export commodity can lift the index for some economies while a rise in the same commodity as an import can push another economy in the opposite direction. The data should therefore motivate a commodity-level follow-up rather than a single causal claim.
The lowest readings indicate a weaker relative-price position than in 2015
St. Vincent and the Grenadines has the lowest observed value at 52.9, followed by the British Virgin Islands at 59.5, Gibraltar at 67.5, Ireland at 67.6, Comoros at 69.7, Dominica at 71.8, Somalia at 75.1, Ukraine at 75.7, Botswana at 76.7, and Albania at 77.0. A value below 100 can result from export unit values falling, import unit values rising, or both. The indicator does not separate those mechanisms.
| Overall rank | Economy or territory | Index |
|---|---|---|
| 203 | St. Vincent and the Grenadines | 52.9 |
| 202 | British Virgin Islands | 59.5 |
| 201 | Gibraltar | 67.5 |
| 200 | Ireland | 67.6 |
| 199 | Comoros | 69.7 |
| 198 | Dominica | 71.8 |
| 197 | Somalia, Fed. Rep. | 75.1 |
| 196 | Ukraine | 75.7 |
| 195 | Botswana | 76.7 |
| 194 | Albania | 77.0 |
| 193 | French Polynesia | 81.0 |
| 192 | West Bank and Gaza | 81.4 |
| 191 | Solomon Islands | 81.5 |
| 190 | Cayman Islands | 81.6 |
| 189 | Lesotho | 81.9 |
Small island economies can be especially sensitive to changes in a limited set of imports and exports, while a large diversified economy may average across many more products. That difference is one reason not to interpret the index as a direct measure of resilience or competitiveness. A complete diagnosis requires product-level trade prices, trade volumes, exchange rates, and the structure of imports and exports.
Large economies also moved in different directions
The United States is at 105.4, Germany at 102.1, Canada at 109.9, Mexico at 104.4, Brazil at 120.8, the Russian Federation at 116.1, and South Africa at 117.1. China is at 84.7, Japan at 89.6, India at 91.3, France at 95.6, and the United Kingdom at 99.2. Korea, Rep. is at 88.3. The contrast shows that economic size alone does not determine the index; the composition and prices of traded goods matter much more directly.
It is also important not to describe the 2024 values as year-over-year improvements or declines. The index level is referenced to 2015, not to 2023. To say whether an economy improved during 2024 itself, a time series would be needed. The cross-section answers a different question: where did the 2024 export-to-import price ratio stand relative to the economy’s own 2015 benchmark?
Three limitations matter when reading the map
First, the World Bank table includes countries and separately reported economies, so the 203 numeric observations are not a count of sovereign states. Second, the 14 missing 2024 rows remain missing. Third, the low-resolution world boundary can directly join about 165 of the numeric observations. Several microstates, city economies, and island territories are too small or are absent as separate polygons at this scale. Their values are still included in the complete ranking below.
A fourth limitation concerns the ranking itself. The gap between 168.9 and 120.0 is not a 48.9-point difference in a common absolute international terms-of-trade level. Each number is an index relative to a different national 2015 base. A country comparison is therefore most defensible when framed as the magnitude of relative change from the base year. Absolute comparisons require additional price-level information and trade-basket context.
Complete ranking of the 203 observed values
The table lists every numeric 2024 observation from highest to lowest. Values are shown to one decimal place, consistent with the source table. An index above 100 means the export-unit-value to import-unit-value ratio is above its 2015 reference; an index below 100 means it is below that reference. The ordering should not be read as a composite ranking of economic performance or welfare.
| Rank | Economy or territory | Code | Index |
|---|---|---|---|
| 1 | Saudi Arabia | SAU | 168.9 |
| 2 | American Samoa | ASM | 167.2 |
| 3 | Australia | AUS | 160.5 |
| 4 | Pakistan | PAK | 155.7 |
| 5 | Lao PDR | LAO | 155.0 |
| 6 | Chad | TCD | 150.6 |
| 7 | Ghana | GHA | 148.8 |
| 8 | Mali | MLI | 145.0 |
| 9 | Peru | PER | 145.0 |
| 10 | Congo, Dem. Rep. | COD | 142.4 |
| 11 | Colombia | COL | 140.1 |
| 12 | Guyana | GUY | 139.5 |
| 13 | Algeria | DZA | 138.2 |
| 14 | Suriname | SUR | 137.9 |
| 15 | Cote d’Ivoire | CIV | 136.2 |
| 16 | Uzbekistan | UZB | 135.1 |
| 17 | Chile | CHL | 134.9 |
| 18 | Curacao | CUW | 134.6 |
| 19 | Liberia | LBR | 134.3 |
| 20 | Guinea | GIN | 132.0 |
| 21 | Burkina Faso | BFA | 131.6 |
| 22 | Belarus | BLR | 131.4 |
| 23 | Papua New Guinea | PNG | 131.2 |
| 24 | Guinea-Bissau | GNB | 130.5 |
| 25 | Sao Tome and Principe | STP | 130.3 |
| 26 | Rwanda | RWA | 129.9 |
| 27 | Angola | AGO | 128.3 |
| 28 | Turkmenistan | TKM | 127.5 |
| 29 | Nigeria | NGA | 127.1 |
| 30 | Zambia | ZMB | 126.4 |
| 31 | Bhutan | BTN | 126.1 |
| 32 | Burundi | BDI | 125.4 |
| 33 | Cameroon | CMR | 123.7 |
| 34 | Bahrain | BHR | 123.4 |
| 35 | Kuwait | KWT | 123.3 |
| 36 | Uganda | UGA | 123.2 |
| 37 | Mauritania | MRT | 123.0 |
| 38 | Iraq | IRQ | 122.9 |
| 39 | Nicaragua | NIC | 122.8 |
| 40 | Trinidad and Tobago | TTO | 122.8 |
| 41 | Qatar | QAT | 121.6 |
| 42 | Myanmar | MMR | 121.3 |
| 43 | Bermuda | BMU | 120.9 |
| 44 | Brazil | BRA | 120.8 |
| 45 | Timor-Leste | TLS | 120.2 |
| 46 | Tanzania | TZA | 120.1 |
| 47 | Iran, Islamic Rep. | IRN | 119.8 |
| 48 | Kazakhstan | KAZ | 119.4 |
| 49 | Libya | LBY | 119.3 |
| 50 | Kyrgyz Republic | KGZ | 118.6 |
| 51 | Ethiopia | ETH | 118.5 |
| 52 | Mozambique | MOZ | 117.5 |
| 53 | South Africa | ZAF | 117.1 |
| 54 | Paraguay | PRY | 116.2 |
| 55 | Russian Federation | RUS | 116.1 |
| 56 | Malaysia | MYS | 116.1 |
| 57 | Togo | TGO | 115.6 |
| 58 | Norway | NOR | 115.5 |
| 59 | Northern Mariana Islands | MNP | 114.6 |
| 60 | Equatorial Guinea | GNQ | 114.1 |
| 61 | Senegal | SEN | 112.4 |
| 62 | Egypt, Arab Rep. | EGY | 112.2 |
| 63 | Ecuador | ECU | 112.0 |
| 64 | Gabon | GAB | 111.7 |
| 65 | Mongolia | MNG | 111.3 |
| 66 | Indonesia | IDN | 110.2 |
| 67 | Canada | CAN | 109.9 |
| 68 | Niger | NER | 109.2 |
| 69 | Guam | GUM | 109.0 |
| 70 | Zimbabwe | ZWE | 108.9 |
| 71 | Azerbaijan | AZE | 108.4 |
| 72 | Armenia | ARM | 108.3 |
| 73 | Slovenia | SVN | 108.3 |
| 74 | Congo, Rep. | COG | 108.2 |
| 75 | United Arab Emirates | ARE | 107.8 |
| 76 | Vanuatu | VUT | 107.7 |
| 77 | New Zealand | NZL | 107.6 |
| 78 | Namibia | NAM | 107.4 |
| 79 | Yemen, Rep. | YEM | 107.4 |
| 80 | Afghanistan | AFG | 107.3 |
| 81 | Syrian Arab Republic | SYR | 107.3 |
| 82 | Tajikistan | TJK | 107.2 |
| 83 | Argentina | ARG | 107.0 |
| 84 | Dominican Republic | DOM | 107.0 |
| 85 | Central African Republic | CAF | 106.9 |
| 86 | Viet Nam | VNM | 106.5 |
| 87 | Bosnia and Herzegovina | BIH | 106.0 |
| 88 | United States | USA | 105.4 |
| 89 | New Caledonia | NCL | 105.1 |
| 90 | Mexico | MEX | 104.4 |
| 91 | Latvia | LVA | 103.7 |
| 92 | Korea, Dem. People’s Rep. | PRK | 103.6 |
| 93 | Italy | ITA | 103.6 |
| 94 | Brunei Darussalam | BRN | 103.2 |
| 95 | Sierra Leone | SLE | 103.0 |
| 96 | Benin | BEN | 103.0 |
| 97 | St. Kitts and Nevis | KNA | 102.6 |
| 98 | Serbia | SRB | 102.5 |
| 99 | Germany | DEU | 102.1 |
| 100 | Kiribati | KIR | 101.7 |
| 101 | Malta | MLT | 101.2 |
| 102 | Turks and Caicos Islands | TCA | 101.1 |
| 103 | Lithuania | LTU | 101.1 |
| 104 | Faroe Islands | FRO | 101.0 |
| 105 | Czechia | CZE | 100.6 |
| 106 | Nepal | NPL | 100.5 |
| 107 | Hong Kong SAR, China | HKG | 100.5 |
| 108 | Netherlands | NLD | 100.3 |
| 109 | Jamaica | JAM | 100.3 |
| 110 | Micronesia, Fed. Sts. | FSM | 100.1 |
| 111 | Costa Rica | CRI | 99.9 |
| 112 | Poland | POL | 99.8 |
| 113 | Sudan | SDN | 99.4 |
| 114 | Estonia | EST | 99.3 |
| 115 | Hungary | HUN | 99.3 |
| 116 | United Kingdom | GBR | 99.2 |
| 117 | Georgia | GEO | 99.0 |
| 118 | Eritrea | ERI | 99.0 |
| 119 | Belgium | BEL | 98.7 |
| 120 | Marshall Islands | MHL | 98.5 |
| 121 | Fiji | FJI | 98.3 |
| 122 | Philippines | PHL | 98.2 |
| 123 | Switzerland | CHE | 97.9 |
| 124 | Kenya | KEN | 97.8 |
| 125 | North Macedonia | MKD | 97.2 |
| 126 | Honduras | HND | 97.0 |
| 127 | Portugal | PRT | 97.0 |
| 128 | Lebanon | LBN | 96.9 |
| 129 | Bahamas, The | BHS | 96.5 |
| 130 | Macao SAR, China | MAC | 96.5 |
| 131 | Palau | PLW | 96.5 |
| 132 | Malawi | MWI | 96.3 |
| 133 | Andorra | AND | 96.2 |
| 134 | St. Lucia | LCA | 96.0 |
| 135 | Uruguay | URY | 96.0 |
| 136 | Barbados | BRB | 95.7 |
| 137 | France | FRA | 95.6 |
| 138 | Sweden | SWE | 95.5 |
| 139 | Belize | BLZ | 95.4 |
| 140 | Gambia, The | GMB | 95.3 |
| 141 | Samoa | WSM | 95.2 |
| 142 | Austria | AUT | 95.2 |
| 143 | Aruba | ABW | 95.1 |
| 144 | Moldova | MDA | 95.1 |
| 145 | El Salvador | SLV | 94.8 |
| 146 | Finland | FIN | 94.5 |
| 147 | Mauritius | MUS | 94.4 |
| 148 | Slovak Republic | SVK | 94.0 |
| 149 | Greece | GRC | 93.9 |
| 150 | Djibouti | DJI | 93.8 |
| 151 | Spain | ESP | 93.6 |
| 152 | Oman | OMN | 93.5 |
| 153 | Israel | ISR | 93.3 |
| 154 | Jordan | JOR | 93.3 |
| 155 | Romania | ROU | 93.1 |
| 156 | Singapore | SGP | 92.9 |
| 157 | Bulgaria | BGR | 92.7 |
| 158 | Cuba | CUB | 92.6 |
| 159 | Cabo Verde | CPV | 92.1 |
| 160 | Tunisia | TUN | 91.8 |
| 161 | India | IND | 91.3 |
| 162 | Thailand | THA | 90.7 |
| 163 | Eswatini | SWZ | 90.5 |
| 164 | Seychelles | SYC | 90.3 |
| 165 | Tonga | TON | 89.8 |
| 166 | Haiti | HTI | 89.8 |
| 167 | Japan | JPN | 89.6 |
| 168 | Maldives | MDV | 88.9 |
| 169 | Cambodia | KHM | 88.8 |
| 170 | Iceland | ISL | 88.4 |
| 171 | Korea, Rep. | KOR | 88.3 |
| 172 | Denmark | DNK | 87.6 |
| 173 | Croatia | HRV | 87.0 |
| 174 | Turkiye | TUR | 86.8 |
| 175 | Greenland | GRL | 86.7 |
| 176 | Sri Lanka | LKA | 86.7 |
| 177 | Panama | PAN | 86.4 |
| 178 | Grenada | GRD | 86.1 |
| 179 | Luxembourg | LUX | 85.5 |
| 180 | Morocco | MAR | 85.3 |
| 181 | Guatemala | GTM | 84.9 |
| 182 | Bolivia | BOL | 84.9 |
| 183 | China | CHN | 84.7 |
| 184 | Madagascar | MDG | 84.4 |
| 185 | Antigua and Barbuda | ATG | 84.0 |
| 186 | Bangladesh | BGD | 83.7 |
| 187 | Naoero | NRU | 82.7 |
| 188 | Cyprus | CYP | 82.0 |
| 189 | Lesotho | LSO | 81.9 |
| 190 | Cayman Islands | CYM | 81.6 |
| 191 | Solomon Islands | SLB | 81.5 |
| 192 | West Bank and Gaza | PSE | 81.4 |
| 193 | French Polynesia | PYF | 81.0 |
| 194 | Albania | ALB | 77.0 |
| 195 | Botswana | BWA | 76.7 |
| 196 | Ukraine | UKR | 75.7 |
| 197 | Somalia, Fed. Rep. | SOM | 75.1 |
| 198 | Dominica | DMA | 71.8 |
| 199 | Comoros | COM | 69.7 |
| 200 | Ireland | IRL | 67.6 |
| 201 | Gibraltar | GIB | 67.5 |
| 202 | British Virgin Islands | VGB | 59.5 |
| 203 | St. Vincent and the Grenadines | VCT | 52.9 |
How to use the index in a deeper trade analysis
The terms-of-trade index is most useful as a screening tool. For economies far above 100, the next step is to identify which export prices rose, which import prices fell, and whether the shift was concentrated in a few commodities. For economies far below 100, analysts can examine imported energy and food prices, major manufactured inputs, and the unit values of core exports. Combining the price index with export and import volume indexes helps distinguish price effects from quantity effects.
The central 2024 finding is dispersion around a near-baseline median. The median is 101.1, yet the observed range extends from 52.9 to 168.9. The map makes the geographic unevenness visible, while the full table preserves small economies that are hard to show on a low-resolution world map. A careful workflow is therefore to use the map to identify patterns, check the exact country value in the table, and then consult product-level or time-series data before drawing conclusions about causes.
Frequently Asked Questions
What does 100 mean in the net barter terms of trade index?
100 is each economy’s own 2015 baseline. A value above 100 means the export-to-import unit-value ratio is higher than in 2015; a value below 100 means it is lower.
Which economy had the highest 2024 index?
Among 203 observed economies and territories, Saudi Arabia was highest at 168.9, followed by American Samoa at 167.2 and Australia at 160.5.
Does a higher index mean a better trade balance?
No. The indicator measures relative export and import unit values. It does not directly measure the trade balance, trade volumes, or total export receipts.
Related Articles
Green Map creates custom-edited map images using open geographic data sources such as geoBoundaries, Natural Earth, OpenStreetMap, and government open data. These maps are edited visual materials, not raw data files, and are provided for education, documents, presentations, and graphic reference.