Hydropower can be the backbone of an electricity system in one country and almost absent in another. The verified World Bank series EG.ELC.HYRO.ZS makes that contrast visible by measuring electricity production from hydroelectric sources as a percentage of total electricity production. Across 209 economies, the latest available observations range from zero to almost 100 percent. That spread is useful for understanding electricity-mix structure, but it should not be mistaken for a synchronized 2024 world ranking. The dataset keeps the most recent non-missing value for each economy, so the observation year differs substantially from country to country.
The year mix is the first thing to check before comparing values. Only 40 of the 209 rows are observations from 2024. Another 87 are from 2023, one is from 2022, 80 are from 2021, and Gibraltar’s latest non-missing observation in this file is from 2015. A broad latest-observation view therefore offers much wider geographic coverage than a strict single-year table, but it sacrifices temporal alignment. The analysis below keeps those two ideas separate: it describes the 209-economy distribution while also isolating the 2024 subset when a same-year comparison is more appropriate.
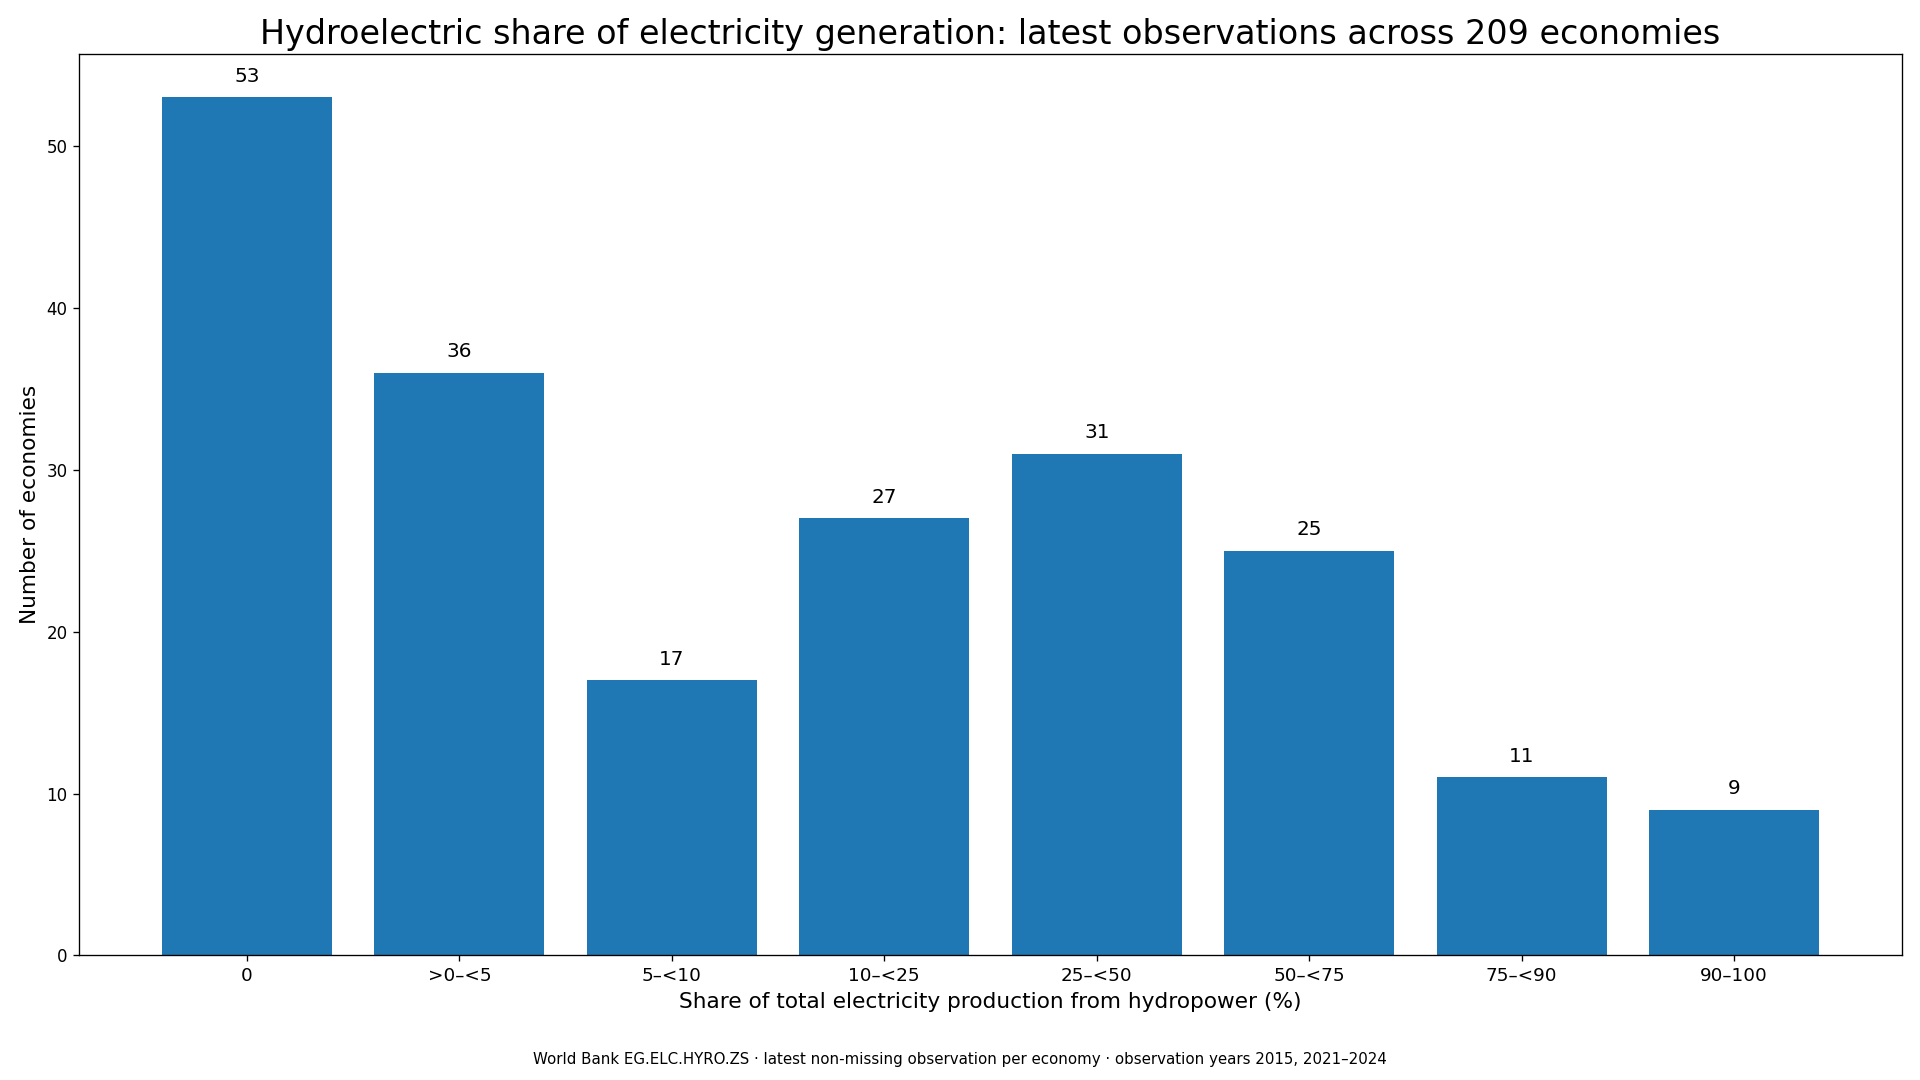
Table of Contents
The country distribution is strongly uneven
The simple mean across the 209 economy-level observations is 24.56%, while the median is only 8.76%. The large gap between those two statistics tells us that very high hydropower shares pull the average upward even though many economies sit near the bottom of the range. The first quartile is 0.00% and the third quartile is 44.21%. In other words, at least one quarter of the economies are at zero in this latest-observation dataset, and three quarters are below roughly 44.21%. The distribution is therefore better described by several bands than by a single average.
Exactly 53 economies have a value of 0%. At the opposite end, 45 economies obtain at least half of their electricity from hydropower, 20 are at or above 75%, and 9 are at or above 90%. Those counts show that hydropower plays radically different roles across national systems. For some economies it is the dominant source of electricity; for many others it is a small supplementary source or not present in the reported generation mix. Because each economy has the same statistical weight here, these counts describe national structures rather than the allocation of global electricity output.
Near-total hydropower systems sit at the top of the latest-observation view
Bhutan has the highest value in the file at 99.99%, followed by Lesotho at 99.64%, Paraguay at 99.57%, the Democratic Republic of the Congo at 99.52%, and Nepal at 99.09%. Albania and Ethiopia are also above 96%. These percentages show that hydropower supplied almost all recorded electricity production in the relevant observation year. They do not, however, tell us which country produced the largest number of hydroelectric terawatt-hours. A small electricity system can have a near-100% hydropower share while producing far less electricity in absolute terms than a larger system with a much lower percentage.
The distinction between share and volume is especially important for interpreting country rankings. A 90% share indicates concentration in the electricity mix, not necessarily scale. Similarly, a country at 50% may still operate one of the world’s larger hydropower fleets if its total electricity production is large. This indicator is therefore most useful for asking how central hydropower is inside each national generation mix. Questions about installed capacity, annual generation, reservoir storage, plant age or cross-border electricity trade require additional variables.
A 2024-only subset provides a cleaner same-year snapshot
For comparisons that require a common year, the 40 economies with 2024 observations can be considered separately. Norway has the highest hydropower share in that subset at 88.93%. Iceland follows at 68.18%, Costa Rica at 66.61%, Austria at 59.89%, and Switzerland at 59.08%. Colombia is at 58.28%, Brazil at 56.14%, Canada at 55.39%, New Zealand at 52.63%, and Latvia at 50.75%. These values are directly comparable in time because they all refer to 2024, but the subset is not a complete global ranking because most economies do not have a 2024 row in this latest-observation file.
This illustrates the trade-off between coverage and synchronization. Restricting the data to 2024 makes the timing consistent but reduces the sample from 209 economies to 40. Using the latest non-missing observation expands coverage to 209 economies but mixes years from 2015 through 2024. Neither approach is universally superior. A same-year subset is better for a tightly controlled cross-country comparison, while the latest-observation view is better for scanning the broad structure of recent electricity mixes. The key is to label the method clearly and avoid presenting one as the other.
A zero or low hydropower share does not describe the whole electricity mix
The 53 economies recorded at 0% include Aruba, the United Arab Emirates, Bahrain, Barbados and Cyprus. A zero value means that hydropower contributed no reported share of total electricity production in the observation used here. It does not mean that electricity is necessarily produced only from fossil fuels. Wind, solar, nuclear, geothermal and other technologies can supply electricity without appearing in the hydropower numerator. Hydropower share is therefore not interchangeable with renewable-electricity share or low-carbon-electricity share.
Several large electricity systems also have single-digit hydropower shares. The United States is at 5.83% in 2024, Germany at 5.66%, Japan at 8.69%, and India at 7.24% in 2023. These percentages show the relative role of hydropower, not its absolute amount. Five percent of a very large electricity system can represent much more generation than 90% of a small one. Analysts who need to compare hydropower scale should pair this percentage with hydroelectric generation in physical units and total national electricity production.
Selected economies show why the observation year belongs beside the value
The table below deliberately combines economies from the high, middle and low parts of the distribution. It also keeps the observation year visible because similar percentages can come from different dates. China is at 13.47% in 2023 and France at 13.60% in 2024, for example. Brazil and Canada are both above 55% in 2024. Korea, Rep. is at 1.48% in 2024 and appears only as one reference point within the full global distribution. Reading the year and the percentage together prevents a latest-value dataset from being mistaken for a single-year league table.
| Economy | Observation year | Hydropower share of total electricity production |
|---|---|---|
| Bhutan | 2021 | 99.99% |
| Paraguay | 2023 | 99.57% |
| Congo, Dem. Rep. | 2023 | 99.52% |
| Nepal | 2023 | 99.09% |
| Albania | 2023 | 96.69% |
| Norway | 2024 | 88.93% |
| Iceland | 2024 | 68.18% |
| Costa Rica | 2024 | 66.61% |
| Brazil | 2024 | 56.14% |
| Canada | 2024 | 55.39% |
| China | 2023 | 13.47% |
| France | 2024 | 13.60% |
| Japan | 2024 | 8.69% |
| India | 2023 | 7.24% |
| United States | 2024 | 5.83% |
| Korea, Rep. | 2024 | 1.48% |
The indicator is not installed capacity and not a hydropower generation-volume ranking
EG.ELC.HYRO.ZS measures a percentage of electricity production. It does not directly report how many gigawatts of hydroelectric capacity are installed, how many terawatt-hours are generated, or how much electricity is produced per person. The denominator matters. If hydropower generation stays flat while solar, wind, gas or nuclear generation expands, the hydropower share can fall even though hydro output has not declined. Conversely, the share can rise when other sources contract. A change in percentage therefore needs to be decomposed before it is interpreted as a change in hydropower capability.
This is also why a very high percentage should not be treated as a broad score for the electricity system. The series says nothing directly about reliability, consumer prices, transmission constraints, seasonal shortages, environmental impacts, or the resilience of the grid. It describes one structural feature: the portion of recorded electricity output produced from hydroelectric sources. That narrow definition is valuable precisely because it is clear, but it needs companion indicators when the question extends beyond generation mix.
Hydropower shares can move from year to year
Hydroelectric generation depends on water availability and system operation, so its annual share need not be stable. Changes in inflows, reservoir conditions, electricity demand and the output of other power sources can alter the percentage even when installed hydro capacity is unchanged. That matters when observations from 2021 and 2024 are displayed in the same table. Some of the difference between countries may reflect durable structural features, while some can reflect the conditions of the particular year captured by the latest non-missing observation.
A time-series study should therefore align years and follow the same economies over a common interval. For example, comparing 2015 and 2024 only where both observations exist would answer a different question: how the hydropower share changed through time. The present dataset answers a broader descriptive question instead: what is the most recent non-missing hydropower share available for each of 209 economies? Keeping that question explicit prevents the latest-observation method from being overinterpreted as evidence of synchronized change.
Why the 24.56% average is not the global hydropower share
The 24.56% mean is an unweighted average of 209 national or economy-level percentages. Every economy contributes one observation regardless of how much electricity it produces. It therefore does not mean that 24.56% of all electricity generated worldwide came from hydropower. A generation-weighted global share would require the total electricity output of every country so that large systems contribute proportionally more to the calculation. The 8.76% median has a similarly specific interpretation: half of the economies in this file are at or below that hydropower share, not half of the world’s electricity.
This distinction is essential when using maps or country tables. Percentage data are powerful for comparing internal electricity structures, while global totals require volume data. Bhutan and Paraguay can appear at the top of a percentage ranking without automatically being the largest hydropower producers in terawatt-hours. Conversely, a major producer can sit much lower in the percentage distribution because it has a diversified electricity mix. Separating “share” from “scale” turns what looks like a simple ranking into a more accurate description of different power systems.
Source and calculation method
The source is the World Bank indicator “Electricity production from hydroelectric sources (% of total),” code EG.ELC.HYRO.ZS. The verified file contains one row for each of 209 real economies and retains the most recent non-missing observation available for that economy. No missing value was replaced with zero and no value was interpolated. The mean, median, quartiles and threshold counts in this article are calculated directly from those 209 reported percentages, while the country table uses the original observation year and value for each selected economy.
The observation-year audit is part of the interpretation rather than a footnote. There are 40 rows from 2024, 87 from 2023, one from 2022, 80 from 2021 and one from 2015. That is why the article uses “latest observation” language rather than labeling all 209 economies as 2024 data. For deeper analysis, the next step would be to assemble aligned annual series and combine this percentage with total electricity generation and source-specific output. That would make it possible to distinguish changes in hydropower production from changes in the denominator and from shifts in other generation technologies.
Frequently Asked Questions
Does a near-100% hydropower share mean the country is one of the largest hydropower producers?
Not necessarily. The indicator is a percentage of that economy’s own electricity production. Absolute hydropower output requires a generation-volume measure such as TWh.
Are all 209 economy values from 2024?
No. The latest-observation file contains 40 values from 2024, 87 from 2023, one from 2022, 80 from 2021 and one from 2015.
Does a low hydropower share imply a low renewable-electricity share?
No. Wind, solar, geothermal and other renewable sources can be important even when hydropower has a small or zero share.
Related Articles
Green Map creates custom-edited map images using open geographic data sources such as geoBoundaries, Natural Earth, OpenStreetMap, and government open data. These maps are edited visual materials, not raw data files, and are provided for education, documents, presentations, and graphic reference.