The 2023 UNESCO Institute for Statistics series OE.5T8.40516.GPIA measures gender parity in the number of outbound internationally mobile tertiary students from each origin country who are studying in the Pacific. It is an adjusted gender parity index (GPIA), so the result is centered on 1 and bounded between 0 and 2. A value of 1 indicates equal female and male indicator values; values below 1 indicate a lower female value, while values above 1 indicate a higher female value. The supplied official data contain 167 reported countries and territories, all for 2023. The key distinction is that this series concerns student counts, not the outbound mobility ratio.
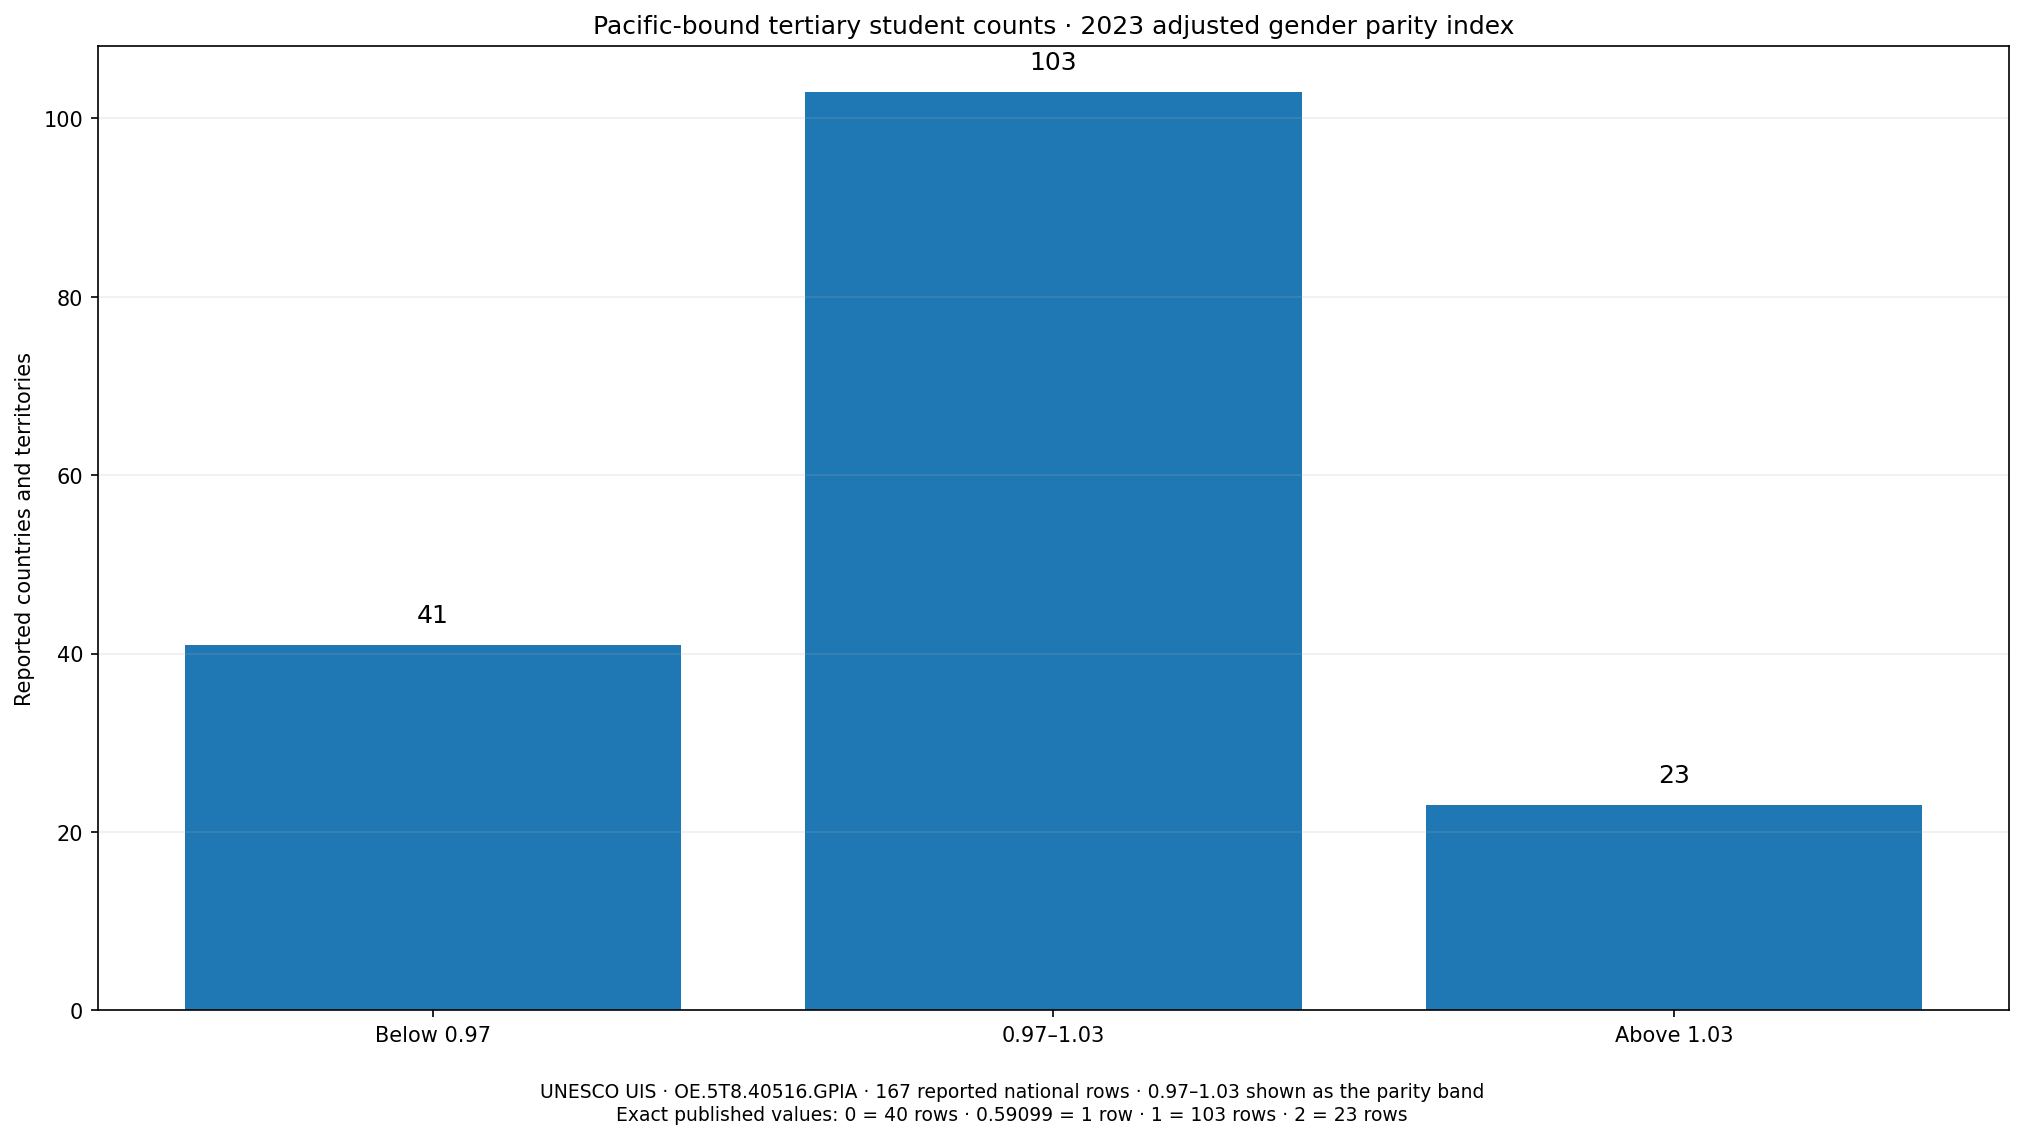
Table of Contents
103 of the 167 reported values are exactly 1
The most striking feature is not a smooth spread of country values but an unusually discrete distribution. Exactly 103 of 167 observations, or 61.7%, are published as 1.0. Using the 0.97–1.03 interval that UIS commonly uses as a practical parity band does not add any other rows: the parity-band count remains 103. Another 40 observations are exactly 0 and 23 are exactly 2. Saudi Arabia, at 0.59099, is the only reported value between those boundary points and 1. The median is 1.0 and the unweighted mean is 0.896.
| 2023 GPIA band | Reported origins | Direction |
|---|---|---|
| Below 0.97 | 41 | Female student-count value is lower |
| 0.97–1.03 | 103 | Parity band |
| Above 1.03 | 23 | Female student-count value is higher |
This shape is very different from an indicator that varies continuously across many decimal values. Of the 167 observations, 166 are exactly 0, 1, or 2. That makes the location of a country relative to the parity point more informative than a conventional high-to-low ranking. The result should also discourage false precision. The GPIA column does not contain the underlying female and male student counts, so a boundary value cannot be used to reconstruct the exact number of students of either sex.
63 observations sit at the lower or upper boundary
The adjusted parity index has a theoretical lower bound of 0 and upper bound of 2. In this series, 40 rows are at 0 and 23 are at 2, giving 63 boundary observations. There are 64 observations outside the 0.97–1.03 parity band, and 63 of them are boundary values. In other words, about 98.4% of the non-parity observations are at 0 or 2. That concentration is more important than the average alone because it shows that most departures from parity in the published series are not modest intermediate differences.
| Published GPIA value | Rows | Share of 167 |
|---|---|---|
| 0 | 40 | 24.0% |
| 0.59099 | 1 | 0.6% |
| 1 | 103 | 61.7% |
| 2 | 23 | 13.8% |
A value of 0 should not be read as ‘there are no international students,’ and a value of 2 should not be read as ‘women are exactly twice as numerous as men.’ The adjusted formula transforms ratios above 1 so that distance from parity is symmetric on both sides, which means the upper boundary is not a simple multiple. Boundary values can occur when one of the underlying sex-specific values is extremely small relative to the other, but this GPIA table alone is not sufficient to establish the exact headcounts. Those would require the female and male OE.5T8.40516 series themselves.
Country examples are more useful as positions on the scale than as a ranking
GPIA is not a higher-is-better measure. The target reference is 1, not 2. Finland, Iceland, Norway, Sweden and Thailand are among the origins published at 2, while Afghanistan, Bangladesh, Egypt, Pakistan and Türkiye are among those at 0. Australia, Canada, China, France and Japan are among the many rows at 1. These groups should not be interpreted as rankings of how popular the Pacific is as a study destination. They describe the relative position of female and male student-count values within each origin country.
| GPIA | Country examples | How to read it |
|---|---|---|
| 0 | Afghanistan, Bangladesh, Egypt, Pakistan, Türkiye and others | Lower bound of the adjusted index |
| 0.59099 | Saudi Arabia | Only non-boundary intermediate value below 1 |
| 1 | Australia, Canada, China, France, Japan and many others | Published value at the parity point |
| 2 | Finland, Iceland, Norway, Sweden, Thailand and others | Upper bound of the adjusted index |
Saudi Arabia is the only row with a non-boundary value below 1, at 0.59099. That places the female student-count value below the male value without reaching the lower limit. There are no intermediate values above 1 in the 167-row series: all 23 observations on that side are published at 2. This asymmetry contributes to the mean of 0.896, which is below 1, but the mean should not be turned into a statement that one sex dominates the entire dataset. A majority of rows are exactly at 1, while a substantial set lies at the opposite upper boundary.
Student-count parity is not the same as mobility-rate parity
The most important identity check is the difference between OE.5T8.40516.GPIA and MOR.5T8.40516.GPIA. Both concern students whose destination region is the Pacific and both use an adjusted gender parity index, but they answer different questions. The OE series compares the female and male values for the number of outbound internationally mobile tertiary students studying in the Pacific. The MOR series compares sex-specific outbound mobility ratios, which use tertiary enrolment in the origin country as the denominator. The same origin country can therefore have different GPIA values in the two series.
Suppose the number of women and men studying in the Pacific is the same. The student-count GPIA can be close to 1. Yet if the total tertiary-enrolment populations of women and men in the origin country are very different, the sex-specific mobility ratios need not be equal. The reverse is also possible: similar mobility rates can coexist with different absolute student counts if the underlying female and male tertiary populations differ. The count-based indicator is closer to the gender composition of the observed Pacific-bound student flow, whereas the mobility-rate indicator normalizes that flow by the size of each sex’s tertiary-enrolment base.
A single 2023 reference year simplifies time comparability, but coverage is not universal
All 167 observations are dated 2023, so cross-country comparisons do not mix different years. That is useful when compared with latest-available tables in which each country may come from a different period. However, the 167 reported rows are not a complete list of every UIS catalogue geography. The source metadata identify 74 catalogue units that are not reported in this observation set. Those absences must remain unreported; they must not be converted to zero.
This distinction matters especially for visualization. Filling an unreported country with zero would falsely place it at the lower boundary of the parity scale. Conversely, removing the 40 explicit zeros would discard official observations. The distribution statistics here use only the 167 published national rows. The data therefore support statements about the reported set, not claims that every country or territory in the world falls into one of these categories.
Parity does not tell us how large the student flow is
A GPIA of 1 can occur when both female and male student counts are large, but it can also occur when both are very small. The index describes balance, not scale. The fact that 103 origins are published at 1 does not mean that 103 origins send large numbers of students to the Pacific. To answer which origins send the most students, the appropriate measure is the underlying student-count series for both sexes rather than the parity index.
The index also does not explain why a difference exists. Scholarships, tuition, language, fields of study, institutional partnerships, family resources, visa rules, distance, migration pathways and destination preferences could all be relevant in particular countries, but none of those explanatory variables appears in this series. The high number of boundary values is therefore a signal for further investigation rather than evidence for a specific cause. The female and male source counts should be checked before interpreting any boundary case in detail.
Four rules for using this series correctly
- Keep the identity exact: OE.5T8.40516.GPIA concerns gender parity in Pacific-bound internationally mobile tertiary student counts.
- Use 1 as the reference point. The 0.97–1.03 interval is a practical parity band, not a performance target.
- Treat 0 and 2 as bounds of the adjusted index, not as student totals or simple female-to-male multiples.
- Preserve coverage: compare the 167 reported national rows and leave catalogue units without observations as unreported.
The numeric source is the UNESCO Institute for Statistics OE.5T8.40516.GPIA data series. UIS developed the adjusted gender parity index to make disparities on either side of 1 comparable within a bounded 0–2 scale. Because every reported row here refers to 2023, the central analytical task is not reconciling years but preserving the distinction between student counts, mobility ratios, official zeros and unreported geographies.
Frequently Asked Questions
What does a GPIA of 1 mean in this series?
It means the female and male values for the number of Pacific-bound internationally mobile tertiary students are equal. In the 2023 data, 103 of 167 reported observations are exactly 1.
Do values of 0 and 2 represent student totals?
No. They are the lower and upper bounds of the adjusted gender parity index. The underlying female and male student counts are required to determine actual volumes.
Is this the same as the outbound mobility-rate GPIA?
No. OE.5T8.40516.GPIA compares student-count values by sex, while MOR.5T8.40516.GPIA compares sex-specific mobility rates normalized by tertiary enrolment in the origin country.
Related Articles
Green Map creates custom-edited map images using open geographic data sources such as geoBoundaries, Natural Earth, OpenStreetMap, and government open data. These maps are edited visual materials, not raw data files, and are provided for education, documents, presentations, and graphic reference.