The 50-state total for U.S. Electric Power petroleum (PET) total fuel consumption in 2024 was 29,170.805 thousand barrels in the EIA Electric Power Operational Data series. Hawaii was by far the largest state observation at 11,870.815 thousand barrels, followed by Michigan at 3,603.167 and Ohio at 2,637.329. This article uses one exact API identity: annual frequency, PET fuel, sector 98 (Electric Power), field=total-consumption, state geography, and 2024.
The field definition is the key to keeping this article distinct from closely related EIA series. total-consumption covers fuel consumed for both electricity generation and useful thermal output. It is not the same field as consumption-for-eg, which isolates electricity generation, and it is not the useful-thermal-output component by itself. The year, fuel, and sector can be identical while the statistical identity remains different because the measured field is different.
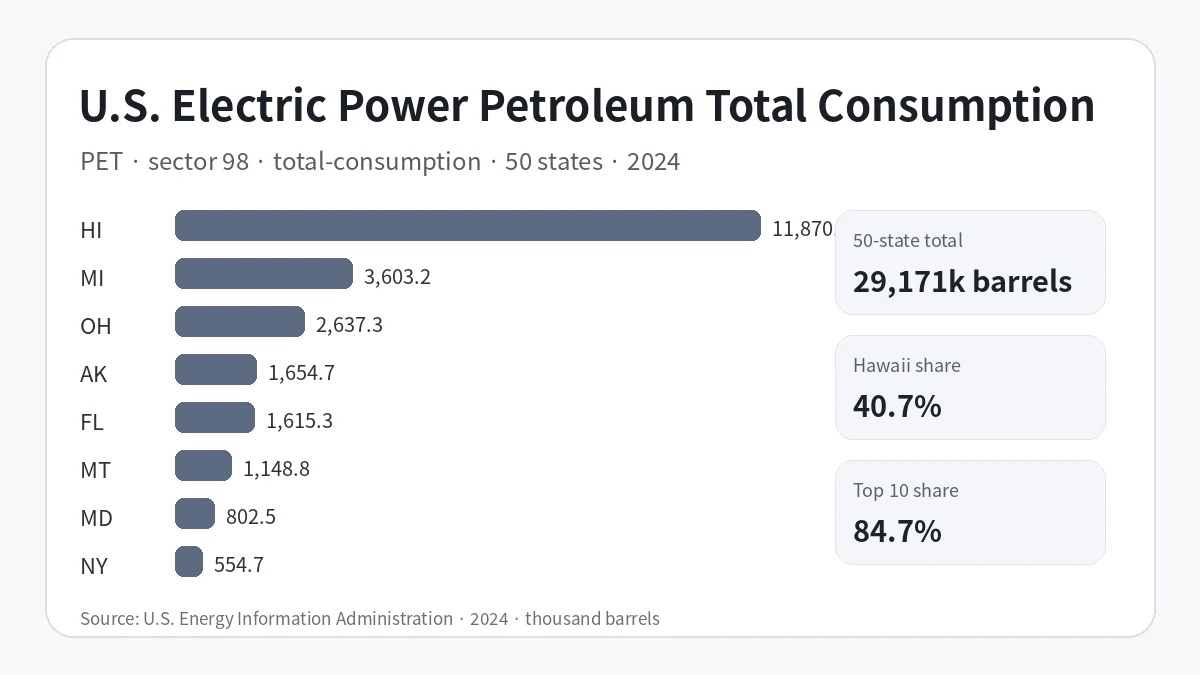
Table of Contents
What this EIA metric measures
The source metric is Consumption of Fuels for Electricity Generation and Useful Thermal Output (Physical Units). The selected fuel is Petroleum (PET), the selected sector is Electric Power, and the source unit is thousand barrels. The verified file contains one observation for each of the 50 states. There are no missing numeric observations and no exact zeros. The District of Columbia is not present in this API slice, so it is not inserted as a synthetic zero.
Keeping the sector fixed matters as much as keeping the field fixed. The numbers do not represent all petroleum use in each state and they do not represent all U.S. energy sectors. They compare the PET category within EIA sector 98 only. A series using sector 99, All Sectors, would have a different scope. A series using another fuel category would also answer a different question even if its unit were also thousand barrels.
Hawaii alone accounts for 40.7% of the 50-state total
Hawaii contributes 40.7% of the 50-state sum. Michigan raises the combined share of the top two states to 53.0%, and adding Ohio brings the top three to 62.1%. Alaska and Florida rank fourth and fifth. Together the top five states account for 73.3% of the total. This is a highly concentrated distribution rather than one in which state values cluster around a common scale.
The concentration remains strong beyond the first few states. The top ten observations sum to 24,704.563 thousand barrels, equal to 84.7% of the 50-state total. That leaves only about 15.3% for the other 40 states combined. A national average by itself therefore gives a misleading impression of what a typical state looks like. Median and cumulative-share statistics are more informative for this distribution.
| Rank | State | 2024 total consumption (thousand barrels) | Share of 50-state total |
|---|---|---|---|
| 1 | Hawaii | 11,870.815 | 40.69% |
| 2 | Michigan | 3,603.167 | 12.35% |
| 3 | Ohio | 2,637.329 | 9.04% |
| 4 | Alaska | 1,654.718 | 5.67% |
| 5 | Florida | 1,615.336 | 5.54% |
| 6 | Montana | 1,148.815 | 3.94% |
| 7 | Maryland | 802.501 | 2.75% |
| 8 | New York | 554.722 | 1.90% |
| 9 | Missouri | 434.068 | 1.49% |
| 10 | Virginia | 383.092 | 1.31% |
The mean is 583.4 thousand barrels, but the median is only 125.8
The arithmetic mean is 583.4 thousand barrels, while the median is 125.773. The mean is about 4.6 times the median because the largest state observations pull it upward. The first quartile is 54.529 thousand barrels and the third quartile is 270.780, so half of the states fall between those two values even though the total range is much wider.
The distribution also looks uneven when grouped into practical bands. Three states are at or below 10 thousand barrels; seven are above 10 and up to 50; fourteen are above 50 and up to 100; thirteen are above 100 and up to 250; five are above 250 and up to 500; two are above 500 and up to 1,000; and six exceed 1,000 thousand barrels. Idaho is the smallest positive value at 0.083 thousand barrels, followed by New Mexico at 2.011 and Mississippi at 9.613. Small positive values are preserved rather than rounded to zero.
Complete ranking of all 50 states
The table below sorts every state in the verified 2024 slice from highest to lowest. Shares use the direct 50-state sum of 29,170.805 thousand barrels as the denominator. No missing-value imputation, cross-year averaging, or conversion to another unit is applied.
| Rank | State | Total consumption (thousand barrels) | Share |
|---|---|---|---|
| 1 | Hawaii | 11,870.815 | 40.69% |
| 2 | Michigan | 3,603.167 | 12.35% |
| 3 | Ohio | 2,637.329 | 9.04% |
| 4 | Alaska | 1,654.718 | 5.67% |
| 5 | Florida | 1,615.336 | 5.54% |
| 6 | Montana | 1,148.815 | 3.94% |
| 7 | Maryland | 802.501 | 2.75% |
| 8 | New York | 554.722 | 1.90% |
| 9 | Missouri | 434.068 | 1.49% |
| 10 | Virginia | 383.092 | 1.31% |
| 11 | Texas | 342.047 | 1.17% |
| 12 | North Carolina | 301.835 | 1.03% |
| 13 | Massachusetts | 278.270 | 0.95% |
| 14 | Kansas | 248.311 | 0.85% |
| 15 | Tennessee | 239.570 | 0.82% |
| 16 | West Virginia | 229.015 | 0.79% |
| 17 | Pennsylvania | 190.823 | 0.65% |
| 18 | Indiana | 189.649 | 0.65% |
| 19 | South Carolina | 187.498 | 0.64% |
| 20 | Georgia | 173.403 | 0.59% |
| 21 | Wisconsin | 170.111 | 0.58% |
| 22 | Connecticut | 169.643 | 0.58% |
| 23 | Iowa | 134.788 | 0.46% |
| 24 | Nebraska | 127.525 | 0.44% |
| 25 | Kentucky | 127.269 | 0.44% |
| 26 | Maine | 124.278 | 0.43% |
| 27 | Washington | 99.369 | 0.34% |
| 28 | Colorado | 95.866 | 0.33% |
| 29 | Louisiana | 94.675 | 0.32% |
| 30 | Arkansas | 94.077 | 0.32% |
| 31 | North Dakota | 90.560 | 0.31% |
| 32 | Wyoming | 89.663 | 0.31% |
| 33 | California | 83.471 | 0.29% |
| 34 | Delaware | 62.276 | 0.21% |
| 35 | Utah | 61.046 | 0.21% |
| 36 | Arizona | 60.246 | 0.21% |
| 37 | New Hampshire | 57.498 | 0.20% |
| 38 | South Dakota | 53.539 | 0.18% |
| 39 | Illinois | 52.961 | 0.18% |
| 40 | New Jersey | 51.902 | 0.18% |
| 41 | Oklahoma | 48.737 | 0.17% |
| 42 | Minnesota | 47.658 | 0.16% |
| 43 | Oregon | 23.643 | 0.08% |
| 44 | Alabama | 19.213 | 0.07% |
| 45 | Nevada | 12.557 | 0.04% |
| 46 | Vermont | 11.542 | 0.04% |
| 47 | Rhode Island | 10.001 | 0.03% |
| 48 | Mississippi | 9.613 | 0.03% |
| 49 | New Mexico | 2.011 | 0.01% |
| 50 | Idaho | 0.083 | 0.00% |
Total consumption is not electricity generation, capacity, or efficiency
A physical fuel-consumption series does not directly measure megawatthours of electricity, generating capacity, fuel cost, or emissions. The amount of electricity and useful heat produced from a given physical quantity of fuel depends on heat content, plant technology, operating conditions, and whether a facility produces useful thermal output in addition to electricity. A state can therefore rank high in fuel consumption without holding the same rank in electricity generation.
The total-consumption field should also not be substituted for consumption-for-eg. The latter isolates fuel used for electricity generation, whereas the current field includes fuel used for electricity generation and useful thermal output. The useful-thermal contribution can be small in one state and material in another. A proper decomposition requires matching official EIA fields with the same PET, sector 98, year, geography, and unit. This article does not estimate a component that is not present in the supplied dataset.
The highest values do not form one simple geographic region
The leading states are geographically dispersed: Hawaii, Michigan, Ohio, Alaska, Florida, and Montana are not one contiguous regional cluster. The same is true at the low end, where Idaho, New Mexico, Mississippi, Rhode Island, Vermont, and Nevada span different parts of the country. The state pattern therefore cannot be reduced to a simple East-versus-West or North-versus-South explanation.
Differences may reflect the role of petroleum in each state’s generation fleet, fuel composition, combined heat and power operation, plant mix, and other operational factors. Those are plausible questions for follow-up analysis, but the current metric alone does not identify causal mechanisms. What it directly establishes is the 2024 state distribution of PET total physical consumption inside the Electric Power sector.
A single year is a snapshot, not a trend
All observations in this dataset are for 2024. They do not show whether Hawaii has been persistently dominant, whether Michigan or Ohio is rising or falling, or whether state concentration is changing over time. A trend analysis should hold the EIA route, PET facet, sector 98, total-consumption field, annual frequency, state geography, and compatible unit constant across multiple years. Switching to a different field would break comparability.
The clearest 2024 takeaway is therefore descriptive. The 50-state total is 29,170.805 thousand barrels, Hawaii represents 40.7%, the top ten account for 84.7%, and the mean of 583.4 is far above the median of 125.773. The defining pattern is strong concentration of Electric Power PET total consumption in a small number of states.
Sources
- U.S. Energy Information Administration Electric Power Operational Data API
- U.S. Energy Information Administration Open Data
Frequently Asked Questions
Which state had the highest 2024 Electric Power PET total consumption?
Hawaii ranked first at 11,870.815 thousand barrels, representing 40.7% of the 50-state total. Michigan and Ohio followed.
Is total-consumption the same as petroleum consumed only for electricity generation?
No. total-consumption covers fuel used for electricity generation and useful thermal output, while consumption-for-eg is a separate EIA field limited to electricity generation.
Why is the mean much higher than the median?
A few very large state observations pull the mean upward. The mean is 583.4 thousand barrels and the median is 125.773.
Can these values be used as a ranking of electricity generation or efficiency?
No. They measure physical fuel consumption. Generation, efficiency, capacity, costs, and emissions require separate matched data.
Related Articles
Green Map creates custom-edited map images using open geographic data sources such as geoBoundaries, Natural Earth, OpenStreetMap, and government open data. These maps are edited visual materials, not raw data files, and are provided for education, documents, presentations, and graphic reference.