The World Bank series for 2020 reports projected male alcohol consumption per capita for 185 countries and economies. Among available observations, the median is 7.25 litres of pure alcohol per male aged 15 or older and the mean is 8.12 litres. Romania records the highest value at 27.03 litres, followed by Georgia at 24.51 and Latvia at 21.35. Kuwait, Mauritania, Saudi Arabia and Somalia are reported at exactly 0.00 litres, while 32 other economies have no value in the source for the comparison year.
The unit needs careful interpretation. This is not the volume of beer, wine and spirits poured or purchased. The series is expressed in litres of pure alcohol and divides estimated total alcohol consumption by the male population aged 15 and older. The indicator description combines recorded and unrecorded consumption and adjusts for tourist consumption. It is therefore a population-level annual estimate, not an average taken only among people who drink and not a direct measure of how much a typical individual consumes.
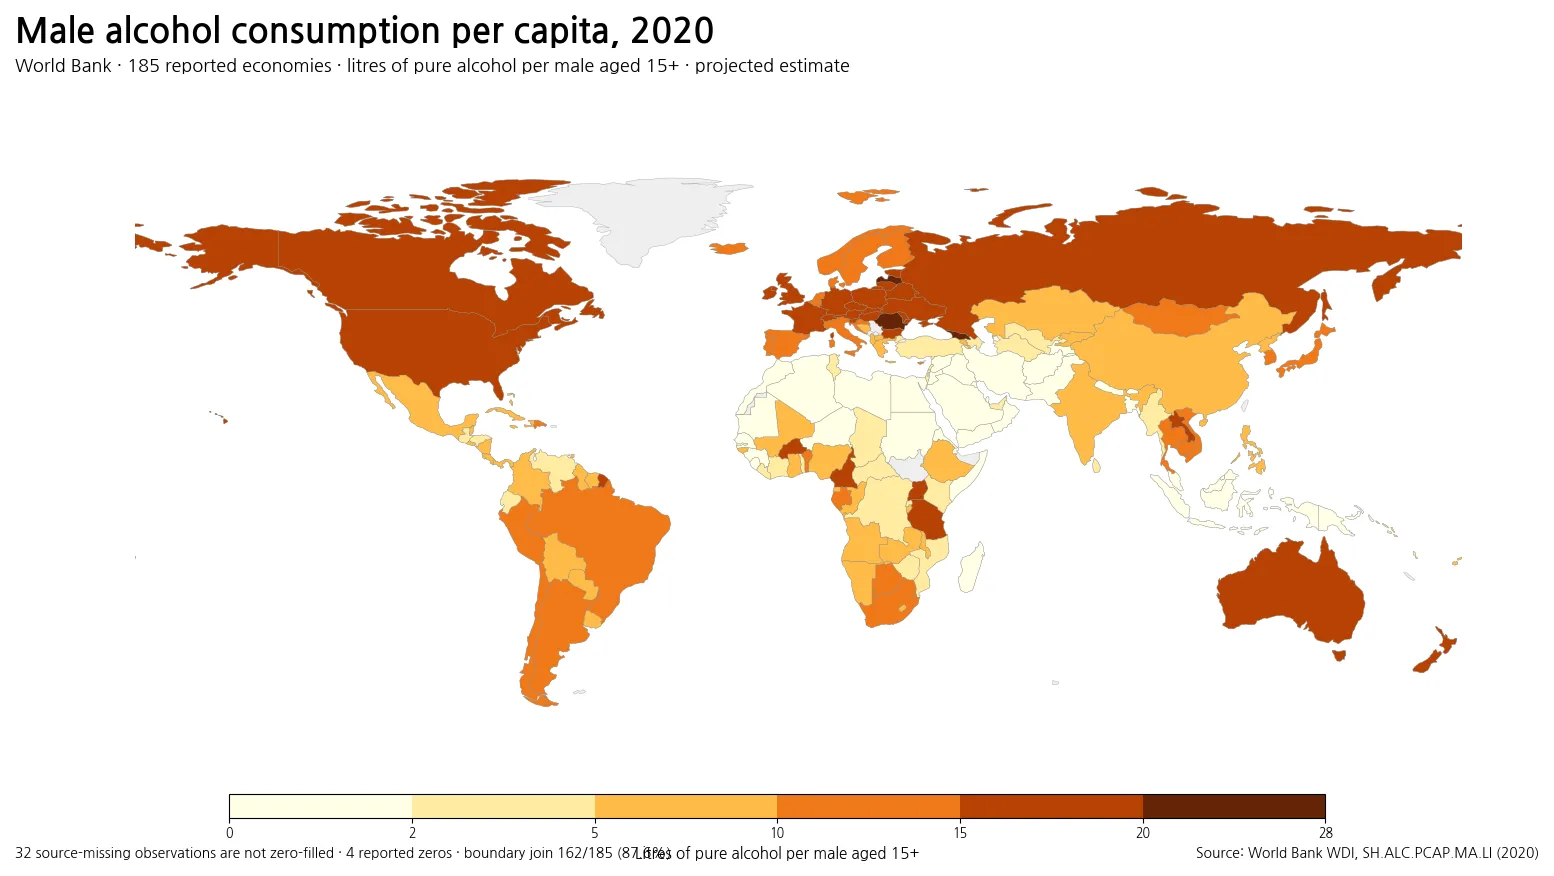
Table of Contents
The median is 7.25 litres, while the mean is slightly higher at 8.12
The first quartile is 2.76 litres, the median 7.25, and the third quartile 12.59. Half of reported economies therefore fall between roughly 2.76 and 12.59 litres. The 90th percentile is 16.74 litres and the 95th percentile is 18.61. The mean exceeds the median because a group of observations above 15 litres stretches the upper side of the distribution, while many countries remain below 5 litres.
By broad bands, 39 economies are below 2 litres, 32 are from 2 to under 5, 47 are from 5 to under 10, 35 are from 10 to under 15, 29 are from 15 to under 20, and only 3 are at 20 litres or more. The largest group sits between 5 and 10 litres. Looking only at the few values above 20 litres would therefore give a distorted picture of the overall distribution.
Romania, Georgia and Latvia sit at the top of the 2020 distribution
Romania reports 27.03 litres, Georgia 24.51, Latvia 21.35, Lithuania 19.82, Belarus 19.44 and Czechia 19.05. The top ten also include Burkina Faso at 19.00, Germany at 18.63, Tanzania at 18.51 and Uganda at 18.46. The highest observations are therefore not confined to one continent, even though several eastern and central European economies are prominent.
A national value of 20 litres does not mean that every man consumed 20 litres of pure alcohol. The denominator includes all males aged 15 and older, including people who did not drink. Consumption can also be very unevenly distributed across individuals. The indicator is useful for comparing population averages, but it should not be converted into a claim about the behavior of a typical person or used to infer any individual’s alcohol use.
| Country or economy | Litres of pure alcohol per male 15+ |
|---|---|
| Romania | 27.03 L |
| Georgia | 24.51 L |
| Latvia | 21.35 L |
| Lithuania | 19.82 L |
| Belarus | 19.44 L |
| Czechia | 19.05 L |
| Bulgaria | 19.03 L |
| Burkina Faso | 19.00 L |
| Poland | 18.74 L |
| Germany | 18.63 L |
Reported zeros and missing data represent different states
The dataset contains 217 country and economy rows, of which 185 have a numeric 2020 observation and 32 are source-missing. Kuwait, Mauritania, Saudi Arabia and Somalia are genuine numeric zeros in the file. Afghanistan at 0.020, Sudan at 0.018, Libya at 0.021 and Yemen at 0.077 are small but nonzero observations. These cases must remain distinct from economies with no reported value.
Replacing missing observations with zero would lower the mean and median and would falsely imply that every unreported economy had no estimated consumption. The map therefore leaves missing areas separate. This distinction also matters when making rankings: a country with 0.02 litres is a reported observation near zero, while a country with no value cannot be assigned a position based on this series for 2020.
| Country or economy | Litres of pure alcohol per male 15+ |
|---|---|
| Kuwait | 0.00 L |
| Mauritania | 0.00 L |
| Saudi Arabia | 0.00 L |
| Somalia, Fed. Rep. | 0.00 L |
| Sudan | 0.02 L |
| Afghanistan | 0.02 L |
| Libya | 0.02 L |
| Yemen, Rep. | 0.08 L |
| Indonesia | 0.13 L |
| Pakistan | 0.15 L |
Europe contains many high observations, but the region is not uniform
Within Europe, Romania is at 27.03 litres, Latvia 21.35, Lithuania 19.82, Czechia 19.05, Germany 18.63, Austria 18.09, Estonia 17.40 and the United Kingdom 16.83. France records 16.48, Spain 14.52, Portugal 14.40 and Italy 11.15. There is substantial variation even within the same broad region.
The cross-country map identifies where values are higher or lower, but it does not identify the reason. Taxation, availability rules, income, culture, tourism, beverage preferences and many other factors could be relevant, yet the current dataset does not separate their effects. A causal explanation would require additional evidence, ideally a time series combined with policy, price, survey and beverage-specific data.
Asia spans near-zero observations and values above 10 litres
Lao PDR reports 17.08 litres, Thailand 13.29, Viet Nam 13.18, Japan 10.27, China 7.31 and India 6.77. At the lower end, Indonesia is at 0.13, Pakistan at 0.15 and Bangladesh at 0.16. Saudi Arabia and Kuwait are reported at 0.00 litres. The regional range is therefore much wider than a single continental average would suggest.
This indicator should also not be confused with drinking frequency or heavy episodic drinking. A low annual per-capita total does not prove that risky drinking is absent among people who do drink, and a high total does not mean consumption is evenly spread through the population. Survey measures of drinking days, abstention, beverage type and heavy-drinking episodes answer different questions.
The Americas show meaningful differences even among large economies
Canada reports 15.59 litres, the United States 15.54 and Mexico 7.90. In South America, Argentina is at 12.59, Brazil 12.37 and Chile 11.77. These values are all calculated on the same male-15-plus basis, but they do not represent total litres consumed nationally because population size is not part of the ranking.
Two countries can have the same per-capita estimate while having very different total consumption because the number of adult men differs. Conversely, a very populous country can have a large total volume but only a moderate per-capita rate. The indicator is best used to compare average annual exposure at population level, not to rank the absolute size of alcohol markets or national sales.
African observations range from almost zero to about 19 litres
Burkina Faso records 19.00 litres, Tanzania 18.51 and Uganda 18.46. South Africa is at 12.41, Ghana 6.96, Nigeria 6.31, Ethiopia 5.20 and Kenya 4.14. At the other end, Sudan is 0.018, Egypt 0.23 and Morocco 0.88. The continent therefore contains both some of the higher and some of the lowest reported values.
The wide spread cautions against explaining alcohol consumption with one variable such as income, religion or geography. Because the indicator includes estimated unrecorded consumption, it can also differ from statistics based only on legal retail sales. A more detailed country study would compare male, female and total-population series, recorded and unrecorded components where available, and several years of the same methodology.
The male series has a different denominator from total-population indicators
SH.ALC.PCAP.MA.LI specifically uses males aged 15 and older. The total adult per-capita series and the female series can be compared alongside it, but they answer related rather than identical questions. Differences between the male and total indicators reflect both sex-specific consumption estimates and population composition. They should not be treated as a direct measurement of the behavior of every man versus every woman.
“Per capita” also does not mean “per drinker.” Abstainers are part of the population denominator. If a small share of the population accounts for a large share of alcohol use, the national average will not reveal that concentration. Individual risk, dependence, frequency of heavy drinking and beverage preference require behavioral or clinical data rather than an aggregate per-capita series.
Recorded and unrecorded consumption are combined, with tourist consumption adjusted
The indicator definition states that total alcohol consumption is the sum of recorded and unrecorded alcohol consumed over a calendar year, expressed as pure alcohol and adjusted for tourist consumption. That makes the series broader than a simple retail-sales measure. Unrecorded consumption is intended to capture alcohol outside standard recorded sales channels, while the tourist adjustment helps align the estimate more closely with the resident population denominator.
The current dataset does not break those components apart, so it cannot tell us how much of a country’s final value comes from recorded sales, unrecorded consumption or the tourism adjustment. Those questions require the underlying methodological and component data. The appropriate conclusion here is simply that the published estimate already incorporates those concepts and should not be described as legal alcohol sales per person.
A 2020 snapshot cannot establish a long-term trend or a cause
All comparisons in this article refer to 2020. A single cross-section can show how countries differed in that year, but it cannot show whether a country was rising or falling. Trend statements require a consistent multi-year series. This is especially important for projected estimates because later data releases can revise past values as source information or estimation procedures are updated.
The year 2020 also coincided with unusual changes in travel, social activity and economic conditions in many countries. That fact may be relevant for further research, but this one-year dataset does not quantify how much any particular event changed consumption. Claims about policy effects, restrictions or economic shocks would need a before-and-after design and separate supporting evidence.
Five checks prevent the most common interpretation errors
First, the unit is litres of pure alcohol rather than litres of beverage. Second, the denominator is all males aged 15 and older. Third, the estimate includes recorded and unrecorded consumption and is adjusted for tourism. Fourth, the 32 missing observations are not zeros. Fifth, a national average is not a statement about an individual or a direct measure of alcohol-related harm. These distinctions are more important than small rank differences.
The 2020 distribution contains 3 observations at 20 litres or more, 29 from 15 to under 20, and 39 below 2 litres. The median is 7.25 litres, so there is no single level that adequately represents all reporting economies. The map is most useful as a starting point for identifying broad geographic differences and selecting countries for deeper time-series or policy analysis.
Frequently Asked Questions
Does male alcohol consumption per capita mean consumption per drinker?
No. The denominator is all males aged 15 and older, including people who do not drink.
Are the litres in this indicator litres of beer, wine or spirits?
No. They are litres of pure alcohol, which allows different beverages to be expressed on a common alcohol-content basis.
Do the 32 missing observations mean zero consumption?
No. They are missing in the source for 2020 and must remain separate from reported 0.00-litre values.
Related Articles
Green Map creates custom-edited map images using open geographic data sources such as geoBoundaries, Natural Earth, OpenStreetMap, and government open data. These maps are edited visual materials, not raw data files, and are provided for education, documents, presentations, and graphic reference.