Kenton County forms a long north-south strip in northern Kentucky, beginning at the Ohio River and extending into quieter ridge-and-creek country south of Independence. Covington sits in the dense northern cityscape, while Independence provides a second anchor farther inland. Reading those two places together makes the county’s shift from riverfront urban land to rolling southern uplands much easier to follow. High-resolution map files are available for download in the section below.
The high-resolution JPG maps can be downloaded from the box below for printing and close label reading. The web previews work well for orientation, while the original files are better for tracing smaller roads, tributaries, and the elevation changes between the Ohio and Licking river valleys and the county interior.
Table of Contents
Covington’s riverfront cityscape changes quickly south of Independence
The road map shows two very different parts of Kenton County. Around Covington, Fort Wright, Fort Mitchell, Crescent Springs, Crestview Hills, Erlanger, Elsmere, Edgewood, and Taylor Mill appear at short intervals. South of Independence, labels spread farther apart and routes such as KY 16, KY 17, KY 177, and U.S. 25 cross longer stretches of hilly country.
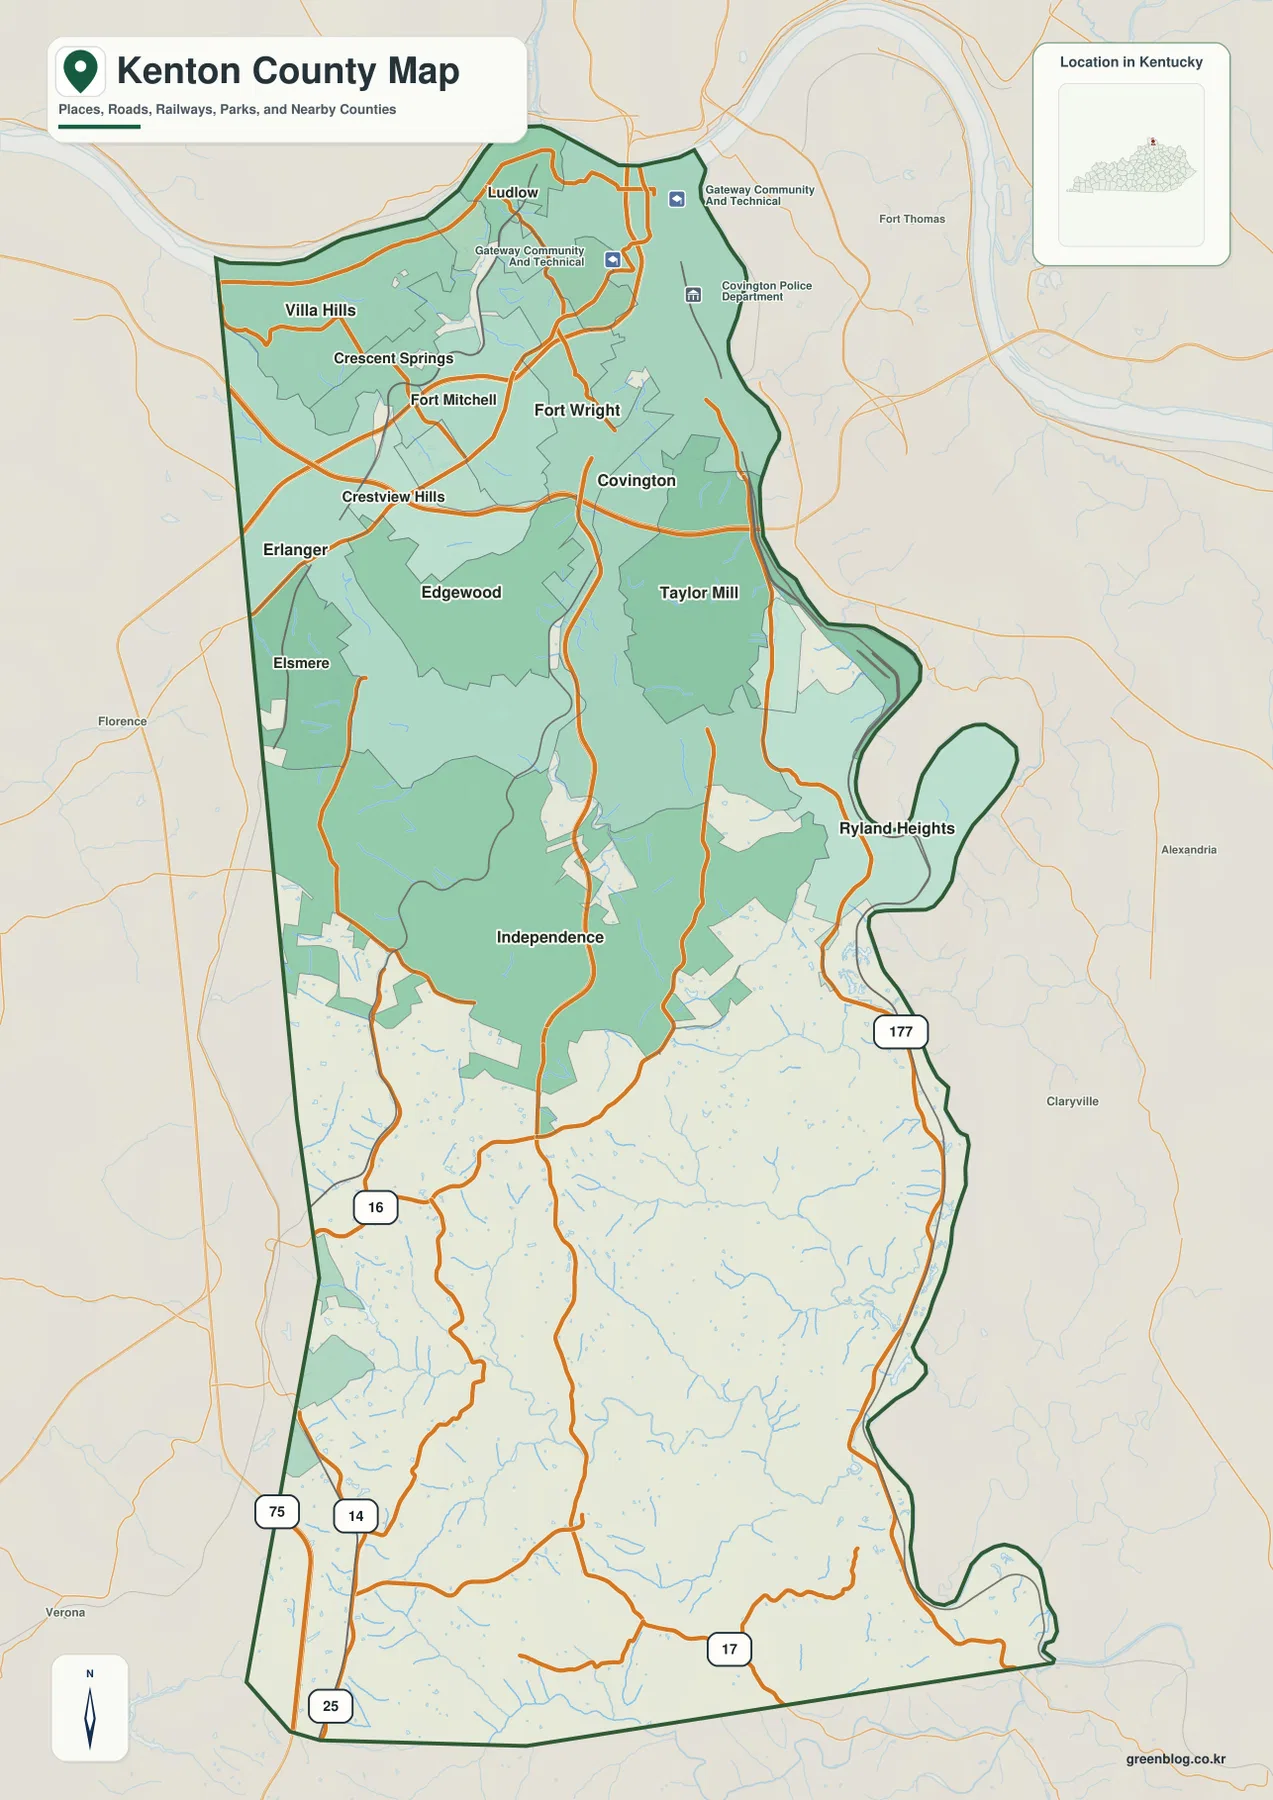
I-75 runs close to the western side of the northern urban cluster and provides an immediate reference for Erlanger and Fort Mitchell. Farther south, KY 16, KY 17, KY 177, and U.S. 25 extend across less densely settled country. Using Independence as a midpoint helps organize the map: the county becomes increasingly urban toward Covington, while the southern end is shaped more by ridges, local roads, and creek corridors.
Official Kenton County material identifies both Covington and Independence as legal county seats. Their positions make sense on the map: Covington belongs to the riverfront urban cluster, while Independence lies closer to the middle of the county and connects naturally with the southern interior. Using both as reference points gives a much better picture of the county than relying on either city alone.
Most major cities cluster at the northern end of the county
The ranked city map makes the northern concentration unmistakable. Covington is listed at 41,110, followed by Independence at 29,392 and Erlanger at 19,875. Elsmere, Fort Mitchell, and Edgewood complete the six-city index, and five of those markers sit close together near the north end of the county.
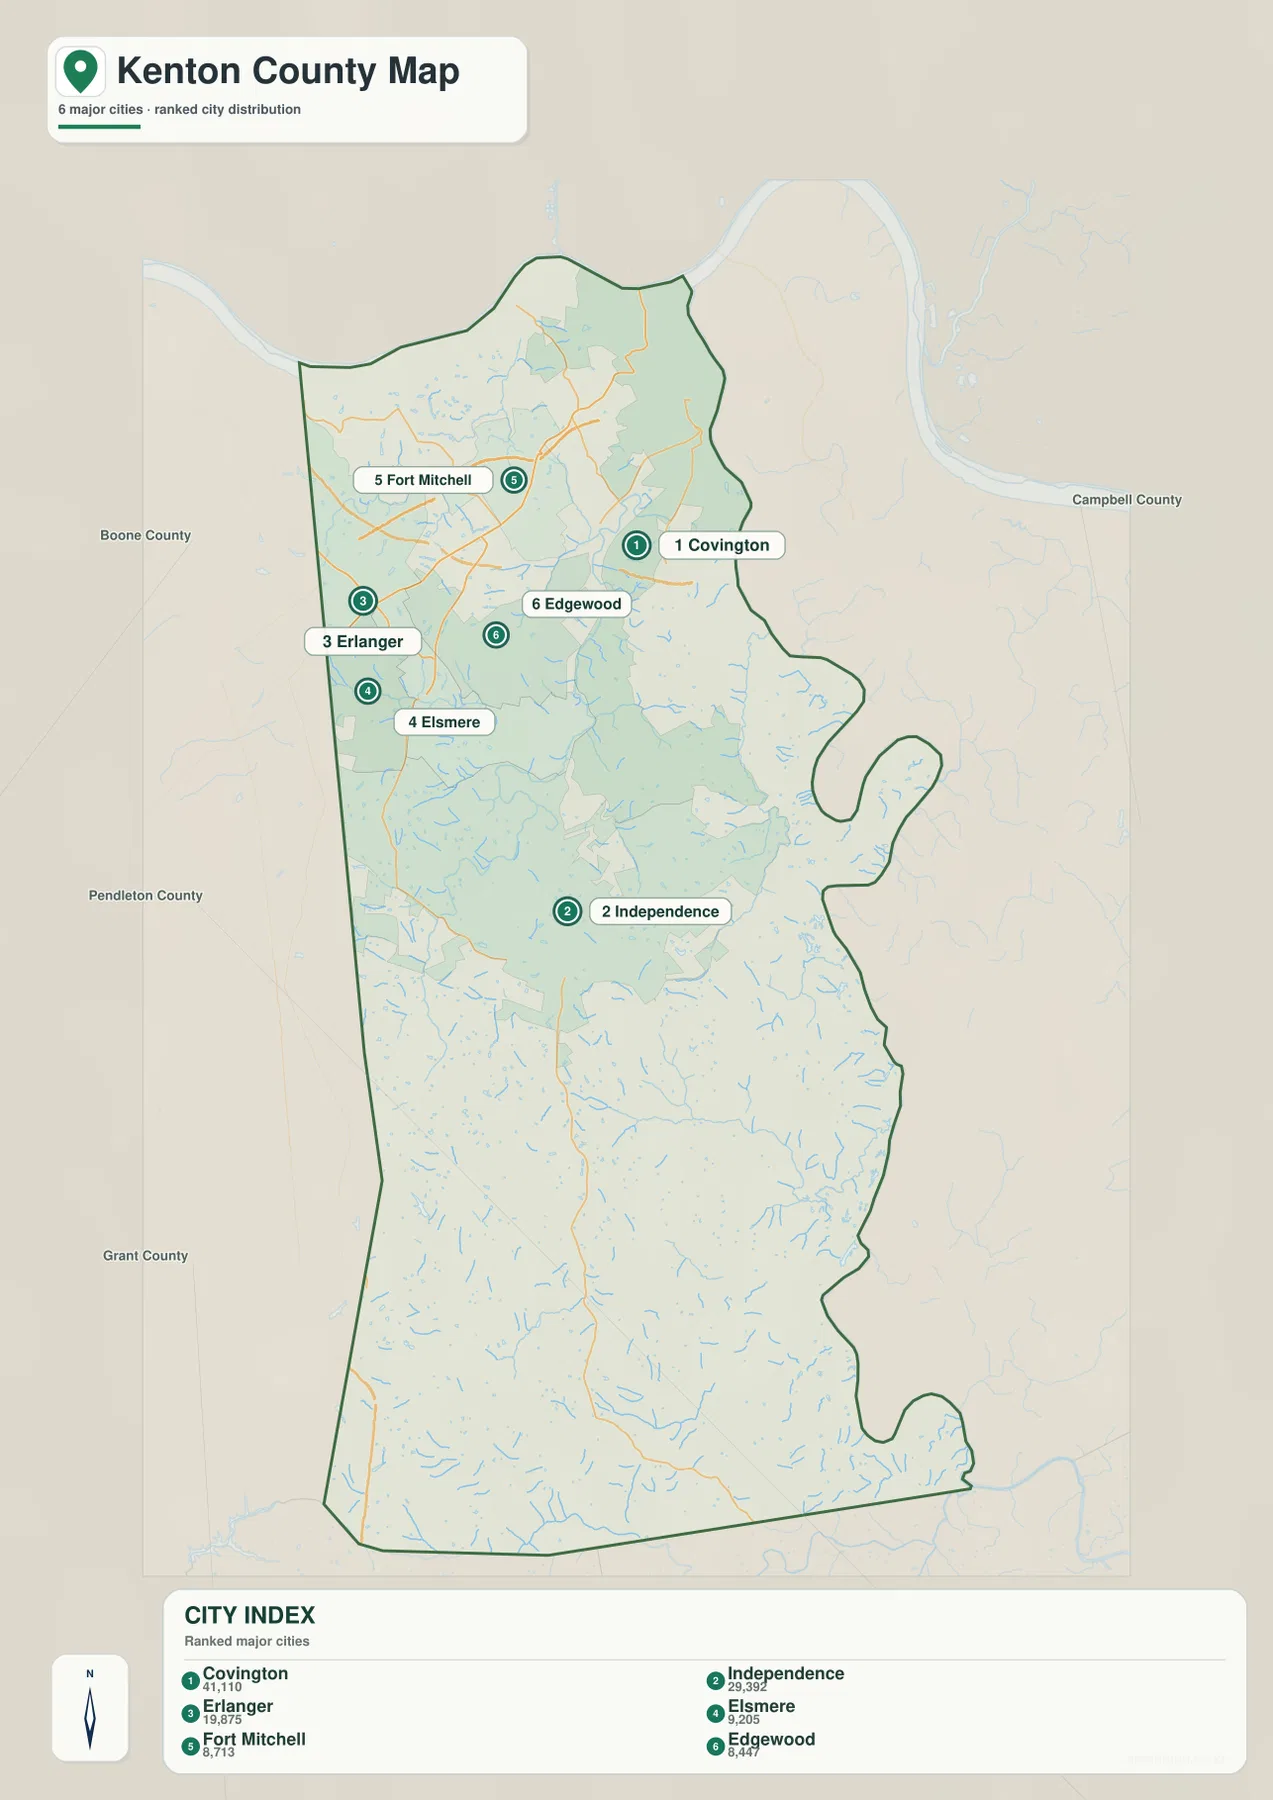
This arrangement is useful when reading the more detailed road map. Covington, Erlanger, Elsmere, Fort Mitchell, and Edgewood form a compact set of reference points for the developed north, while Independence helps locate the transition toward the county’s longer rural road segments. Smaller communities such as Taylor Mill, Fort Wright, Crescent Springs, and Ryland Heights can then be placed around those larger anchors.
The city map should not be read as a complete settlement inventory. Its purpose is to rank and locate the major cities supplied in the package. For route planning or neighborhood-level context, the boundary-and-road map carries more labels. Used together, the two images separate two questions that are easy to confuse: which cities are largest, and where the broader network of communities and roads actually lies.
Two major rivers frame a network of smaller creek valleys
The Ohio River defines the northern edge, while the Licking River follows much of the irregular eastern side. Their broad valleys contrast with the smaller channels cutting through the center and south. Lagoon Lake appears near the northern urban area, and Doe Run Lake stands out as an inland landmark.
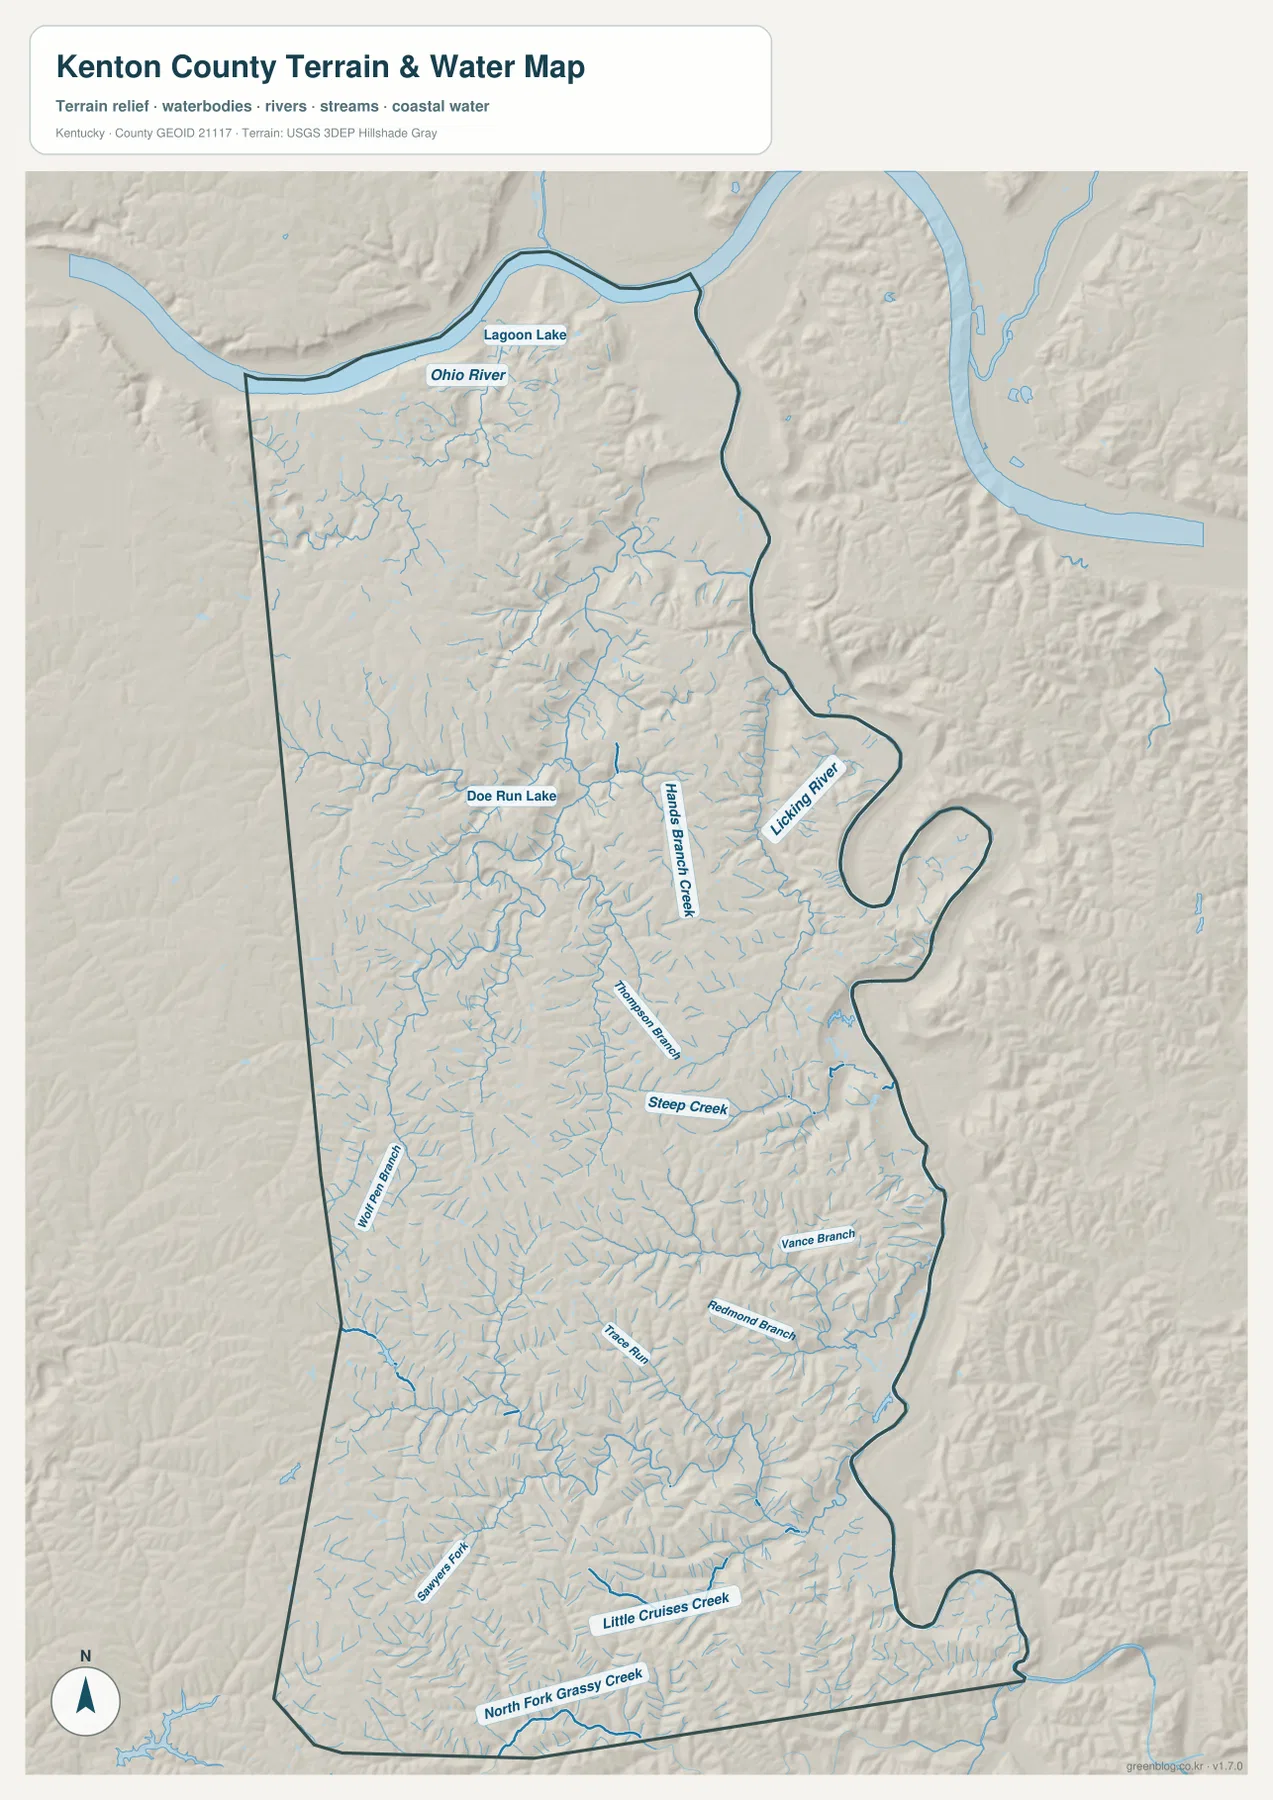
Among the labeled interior waterways are Hands Branch Creek, Richardson Branch, Steep Creek, Vance Branch, Redmond Branch, Trace Run, Little Cruises Creek, North Fork Grassy Creek, Willow Branch, and Sanders Fork. The names are less famous than the Ohio or Licking, but their valleys account for much of the fine-grained relief visible across central and southern Kenton County. Roads often bend around these low corridors rather than crossing the uplands in straight lines.
Doe Run Lake also has a clear local context beyond the county-wide map. Kenton County’s official park map identifies the lake and the trail network around it, making it a useful real-world landmark in the north-central part of the county. The water map on this page is still a general reference product: it shows the location of rivers, creeks, and lakes, but it is not a flood-hazard, depth, navigation, or parcel-boundary map.
Elevation rises from river bottoms to rolling uplands
The elevation surface spans roughly 141 to 293 meters, with a mean near 237 meters. The lowest ground closely follows the Ohio and Licking river corridors and continues into tributary valleys. Higher colors cover much of the west and interior, where rolling ridges break the county into repeated hills and narrow low corridors.
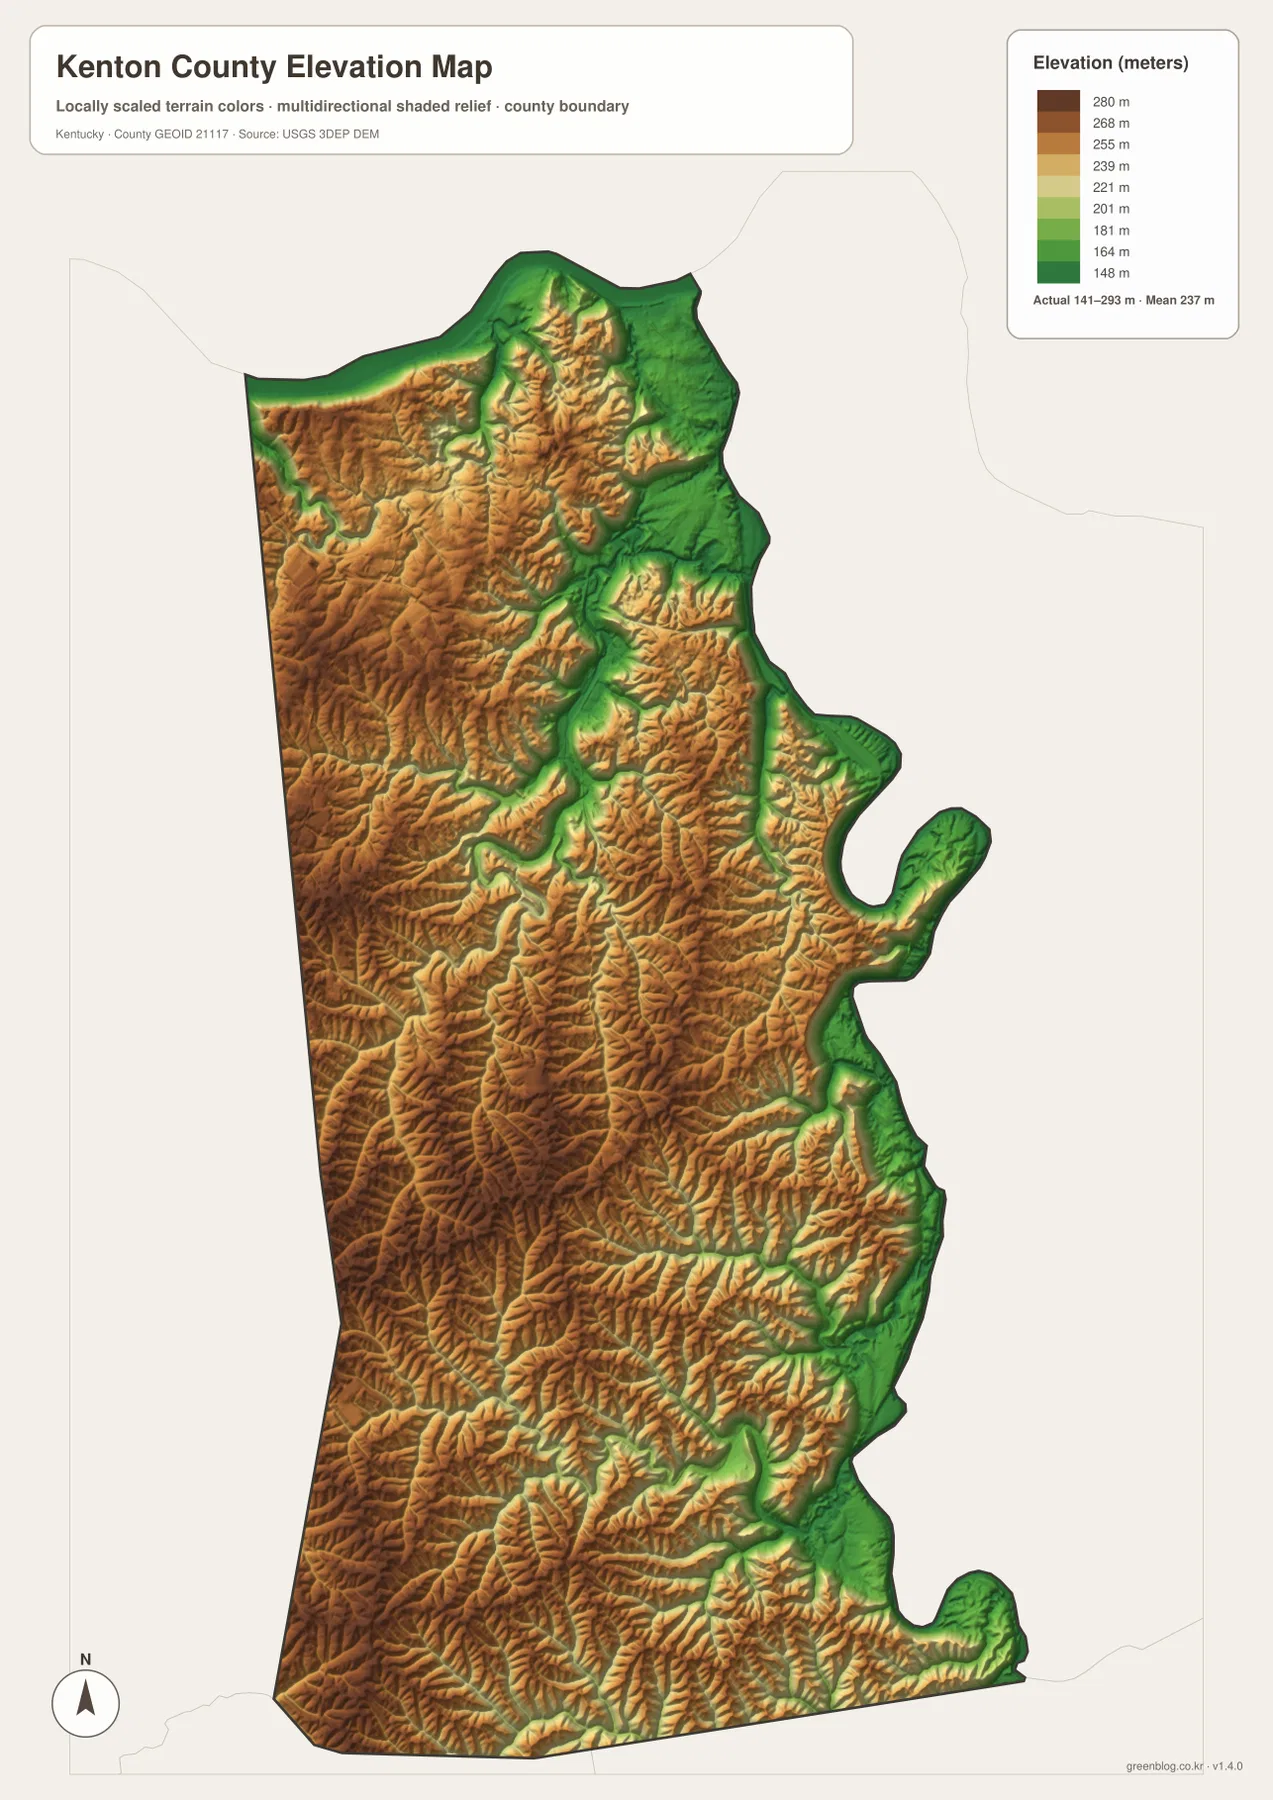
The northern urban area can look almost continuous on the road map, yet the elevation image shows that it is not uniformly level. Low ground follows the river margins, and higher neighborhoods occupy nearby hills. South of Independence, narrow green creek valleys branch repeatedly through warmer-colored uplands, which helps explain the winding pattern of many local roads and the frequent changes in slope over short distances.
These elevation colors are intended for county-scale comparison. They are useful for seeing where valleys and ridges occur and for comparing a road or stream with surrounding high ground. They should not be treated as survey measurements for a property, engineering design data, or a flood-elevation source. Those uses require current, purpose-specific official data.
Match each map file to the detail you need
Use the road map when you need Covington, Fort Mitchell, Erlanger, Taylor Mill, Independence, numbered highways, and the broader network of communities. The ranked city image is faster when the main question is where the largest cities sit relative to one another. Together, those files separate urban size from the finer road-and-place pattern.
For water and terrain, compare the water map with the elevation image. The long bend of the Licking River, Doe Run Lake, and the many tributary valleys become more informative when checked against the 141–293 m elevation range. The downloadable JPG originals are the better choice for print layouts or close inspection of small labels.
Frequently Asked Questions
Why do both Covington and Independence matter when locating places in Kenton County?
Official Kenton County documents identify both cities as legal county seats, and the map shows why they work as separate geographic anchors. Covington lies in the dense northern riverfront area, while Independence sits farther south near the transition to the county’s less urban interior. Using both makes it easier to orient yourself across the county’s full north-south length.
Which file is best for the Ohio River, Licking River, and Doe Run Lake?
The water-and-terrain map is the clearest choice because it labels the two large rivers, Doe Run Lake, and numerous smaller creeks and branches. If you also want to know whether a waterway occupies a low valley or lies beside higher ridges, open the elevation map beside it and compare the same location on both images.
Can the 141–293 m elevation map be used for surveying or flood decisions?
No. It is a generalized county-scale reference designed to show relative highs and lows. Property elevation, engineering, surveying, construction, and flood-risk decisions require current source data and measurements appropriate to those specific tasks.
Map File Information
Download the Kenton County road/boundary map, major-city map, water/terrain map, and elevation map as high-resolution JPG originals.
- Included Files: Use only the versions confirmed in the article and supplied images
- File Type: Use the confirmed download contents
- Intended Use: Printing, education, presentations, and map-based projects
Related Maps
Sources and References
County background was checked against the official Kenton County history page and the Kenton County Emergency Operations Plan county profile. Doe Run Lake context comes from the official Doe Run Lake map. Boundary and road reference data are available from U.S. Census Bureau TIGER/Line, water data from USGS National Hydrography, and elevation data from the USGS 3D Elevation Program.
Green Map creates custom-edited map images using open geographic data sources such as geoBoundaries, Natural Earth, OpenStreetMap, and government open data. These maps are edited visual materials, not raw data files, and are provided for education, documents, presentations, and graphic reference.