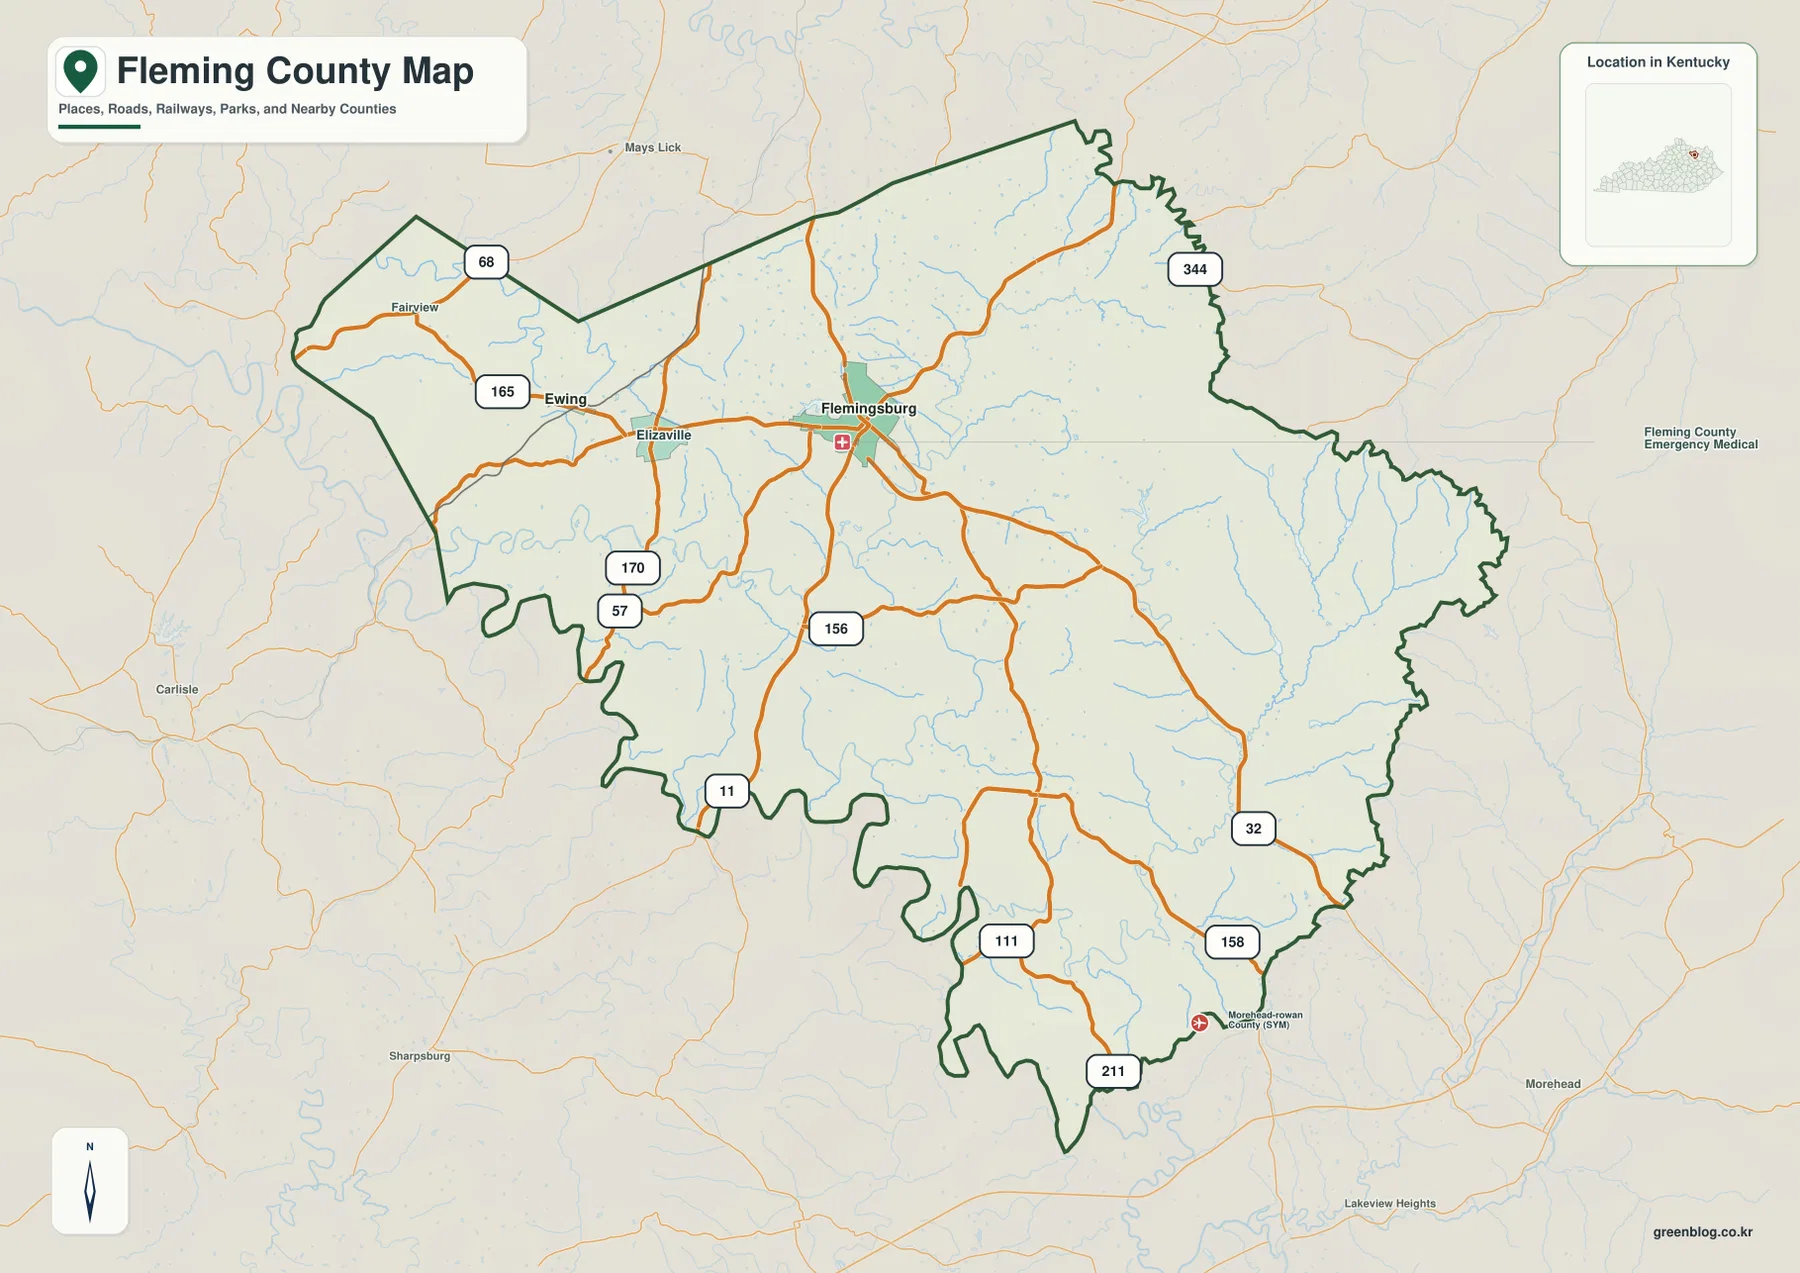
Fleming County in northeastern Kentucky is organized around Flemingsburg, with Ewing to the west and a noticeably rougher belt of ridges across the eastern half of the county. The maps on this page combine the county boundary, roads, ranked city locations, named streams and lakes, and an elevation surface ranging from about 178 to 430 meters. High-resolution JPG versions of all four maps are also available together in the download box later on the page.
The easiest way to orient yourself is to start at Flemingsburg and then follow the road network outward. U.S. 68 crosses the western side through Ewing and Elizaville before reaching the Flemingsburg area, while several Kentucky routes continue south and east into narrower valleys. On the terrain-and-water map, names such as Johnson Creek, Allison Creek, Locust Creek, Fox Creek, and Indian Creek provide a second set of landmarks where town labels become sparse.
Table of Contents
Flemingsburg anchors a road network that spreads across the county
Flemingsburg is the clearest reference point on the general county map. Several highways meet or diverge around the city, making it a practical place to begin when tracing locations elsewhere in Fleming County. U.S. 68 approaches from the west through Ewing and Elizaville, while KY 11 and KY 32 help connect the central area with communities and valleys farther south and southeast. The map also labels routes 57, 111, 156, 158, 165, 170, 211, and 344, giving a useful picture of how local travel fans out from the center.
The western side contains several names within a relatively compact area. Fairview appears west of Ewing, while Elizaville lies between Ewing and Flemingsburg. East and southeast of Flemingsburg, the map becomes less urban and the county boundary passes through more broken terrain. That contrast is useful when reading the map: the west-central portion is easier to navigate by towns and major roads, while the eastern half is often easier to understand by valleys, creeks, and ridge lines.
A two-city view makes the Flemingsburg–Ewing relationship easy to see
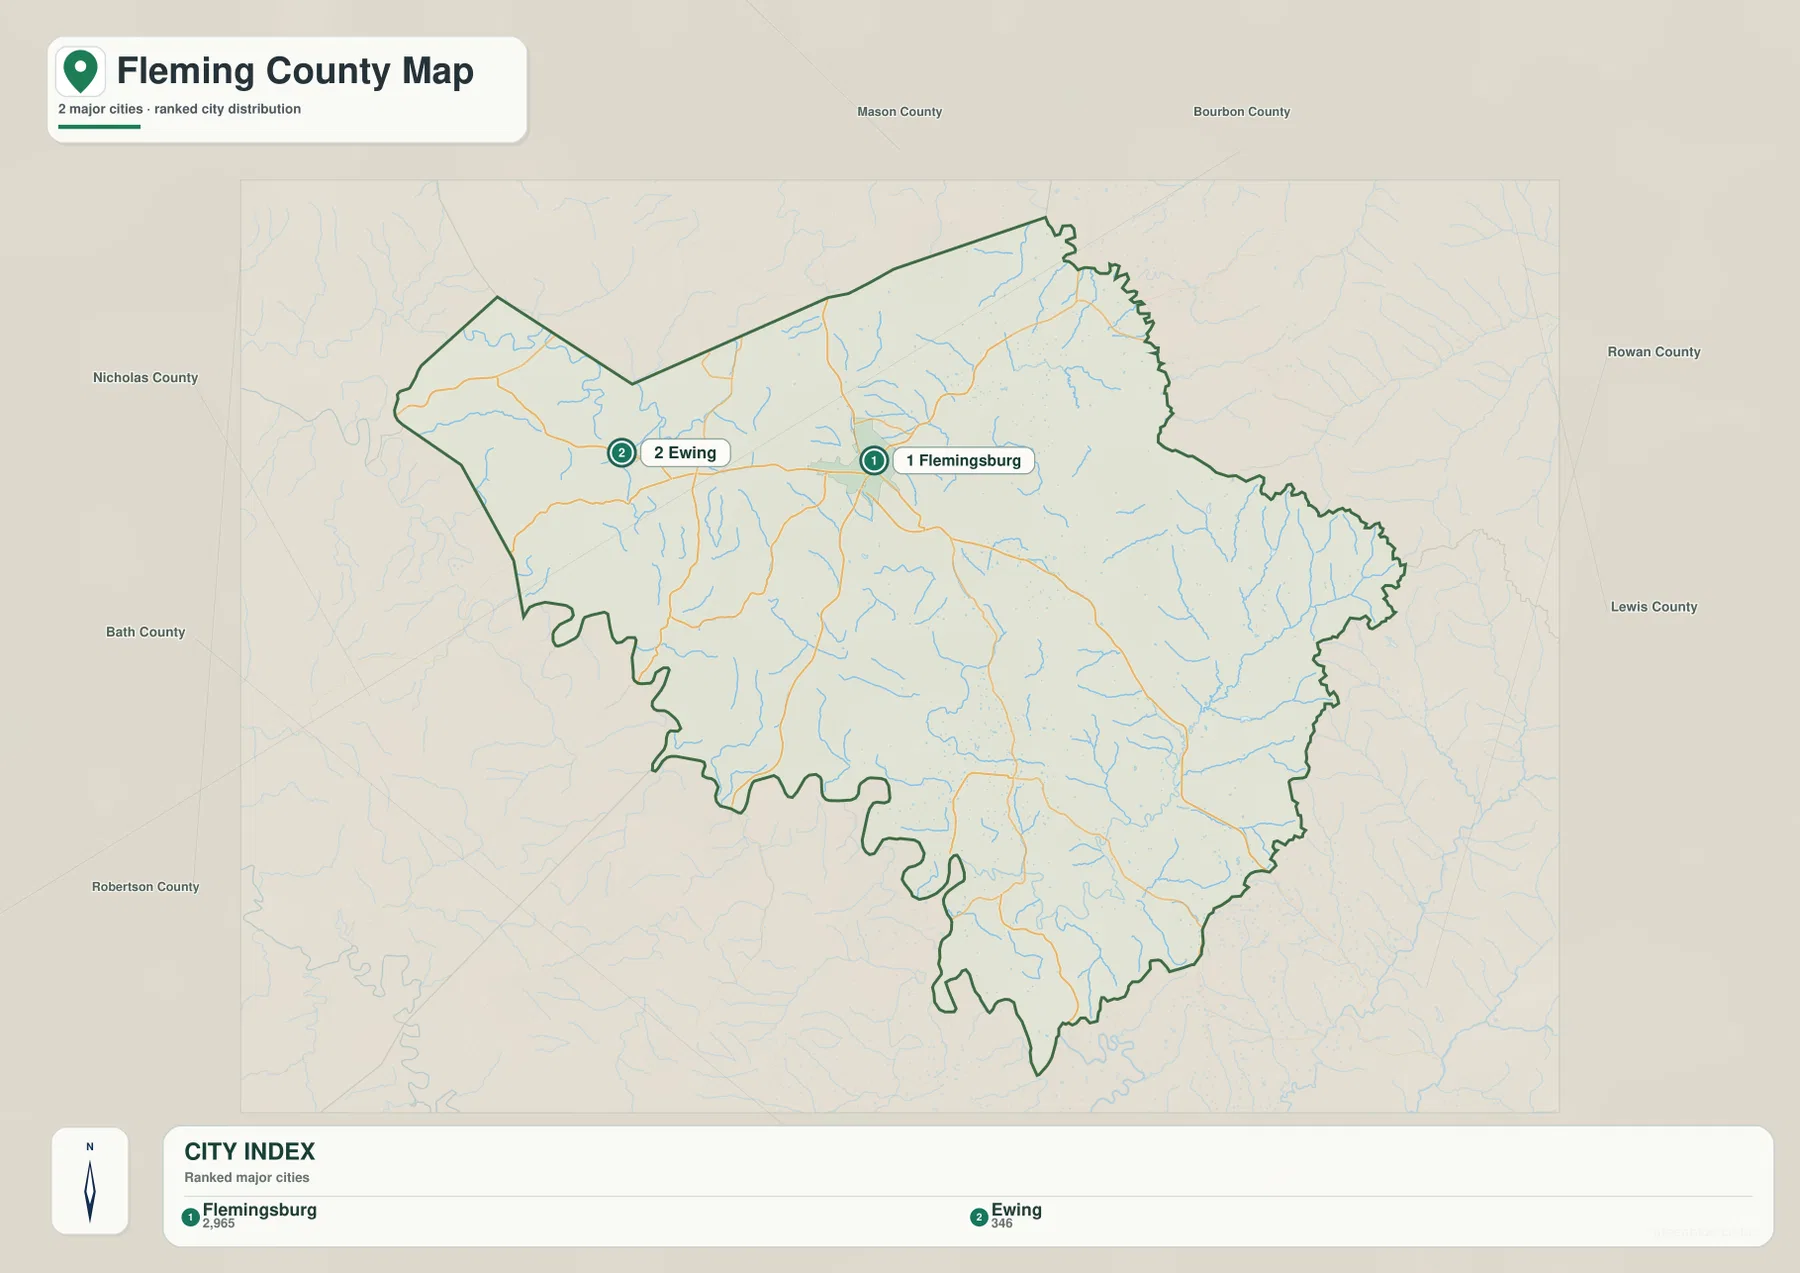
The city-index map deliberately simplifies the county to two ranked places: Flemingsburg first and Ewing second. The index prints reference values of 2,965 for Flemingsburg and 346 for Ewing. Those figures are part of the map package and are best treated as ranking references rather than as a claim about the latest official population count.
With most smaller labels removed, the separation between the two cities becomes especially clear. Flemingsburg sits slightly north of the county’s middle, while Ewing is much closer to the western edge. The large eastern and southern portions of the county contain no comparably prominent city marker on this version, so the map is useful when the goal is simply to explain where the county’s two principal labeled cities sit relative to one another and to the county boundary.
Small creeks divide the landscape into many narrow valleys
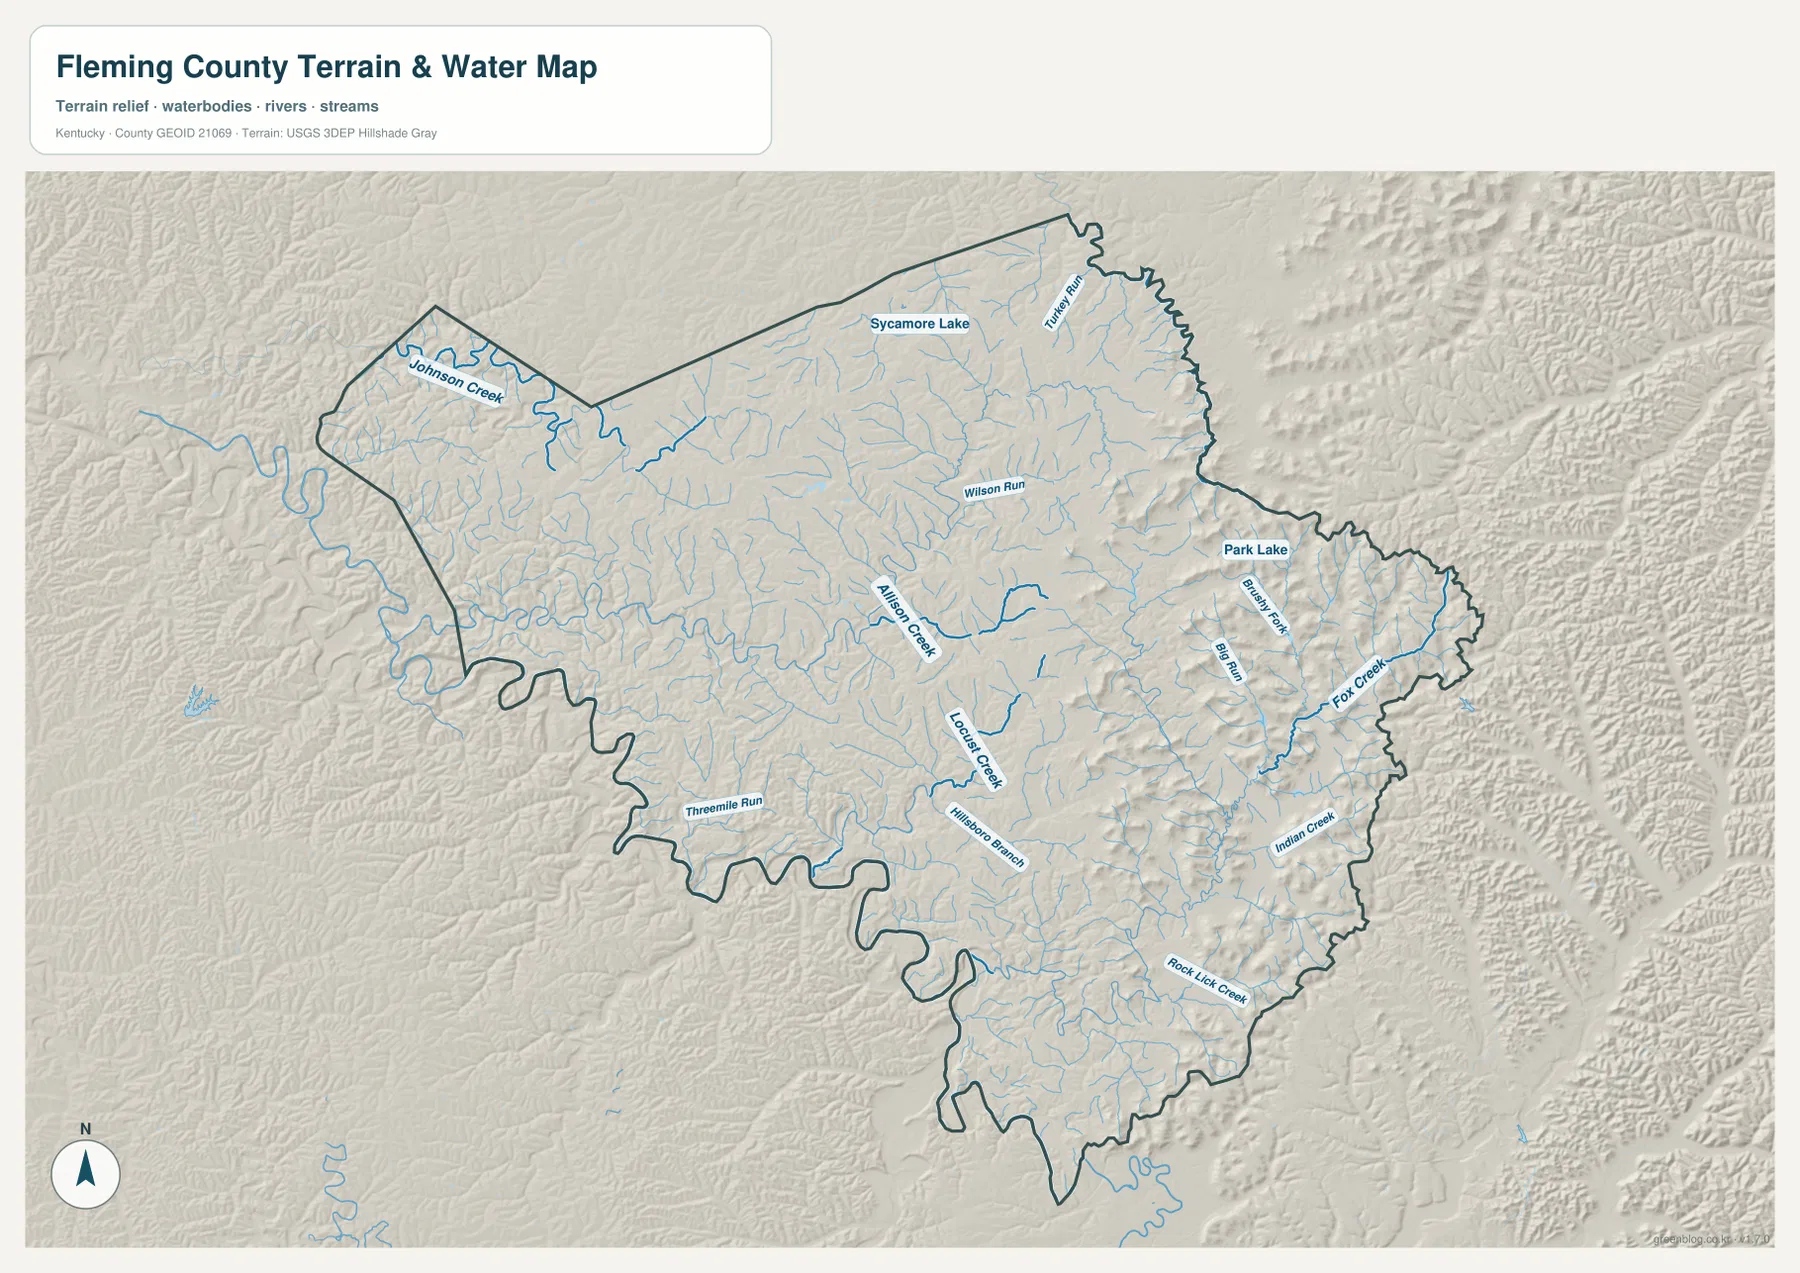
The terrain-and-water map shows a dense network of small streams rather than one dominant river running through the entire county. Johnson Creek is prominent in the northwest, while Allison Creek and Wilson Run appear nearer the center. Locust Creek and Hillsboro Branch help define the south-central area. Farther east, Brushy Fork, Big Run, and Fox Creek occupy the more rugged terrain, with Indian Creek and Rock Lick Creek closer to the southeastern boundary.
Other labels make it possible to narrow down less obvious parts of the county. Threemile Run appears toward the southwest, Turkey Run is labeled near the north, and two named lakes—Sycamore Lake and Park Lake—provide distinct fixed points. These water features are especially helpful in areas where roads bend through valleys and where there are few large settlement labels.
This map is intended for geographic orientation, not for flood-risk decisions, current stream conditions, water-quality determinations, or navigation. Those questions require current agency data. For understanding how named creeks occupy the valleys and how water features are distributed across Fleming County, however, the map supplies much more detail than the general road map.
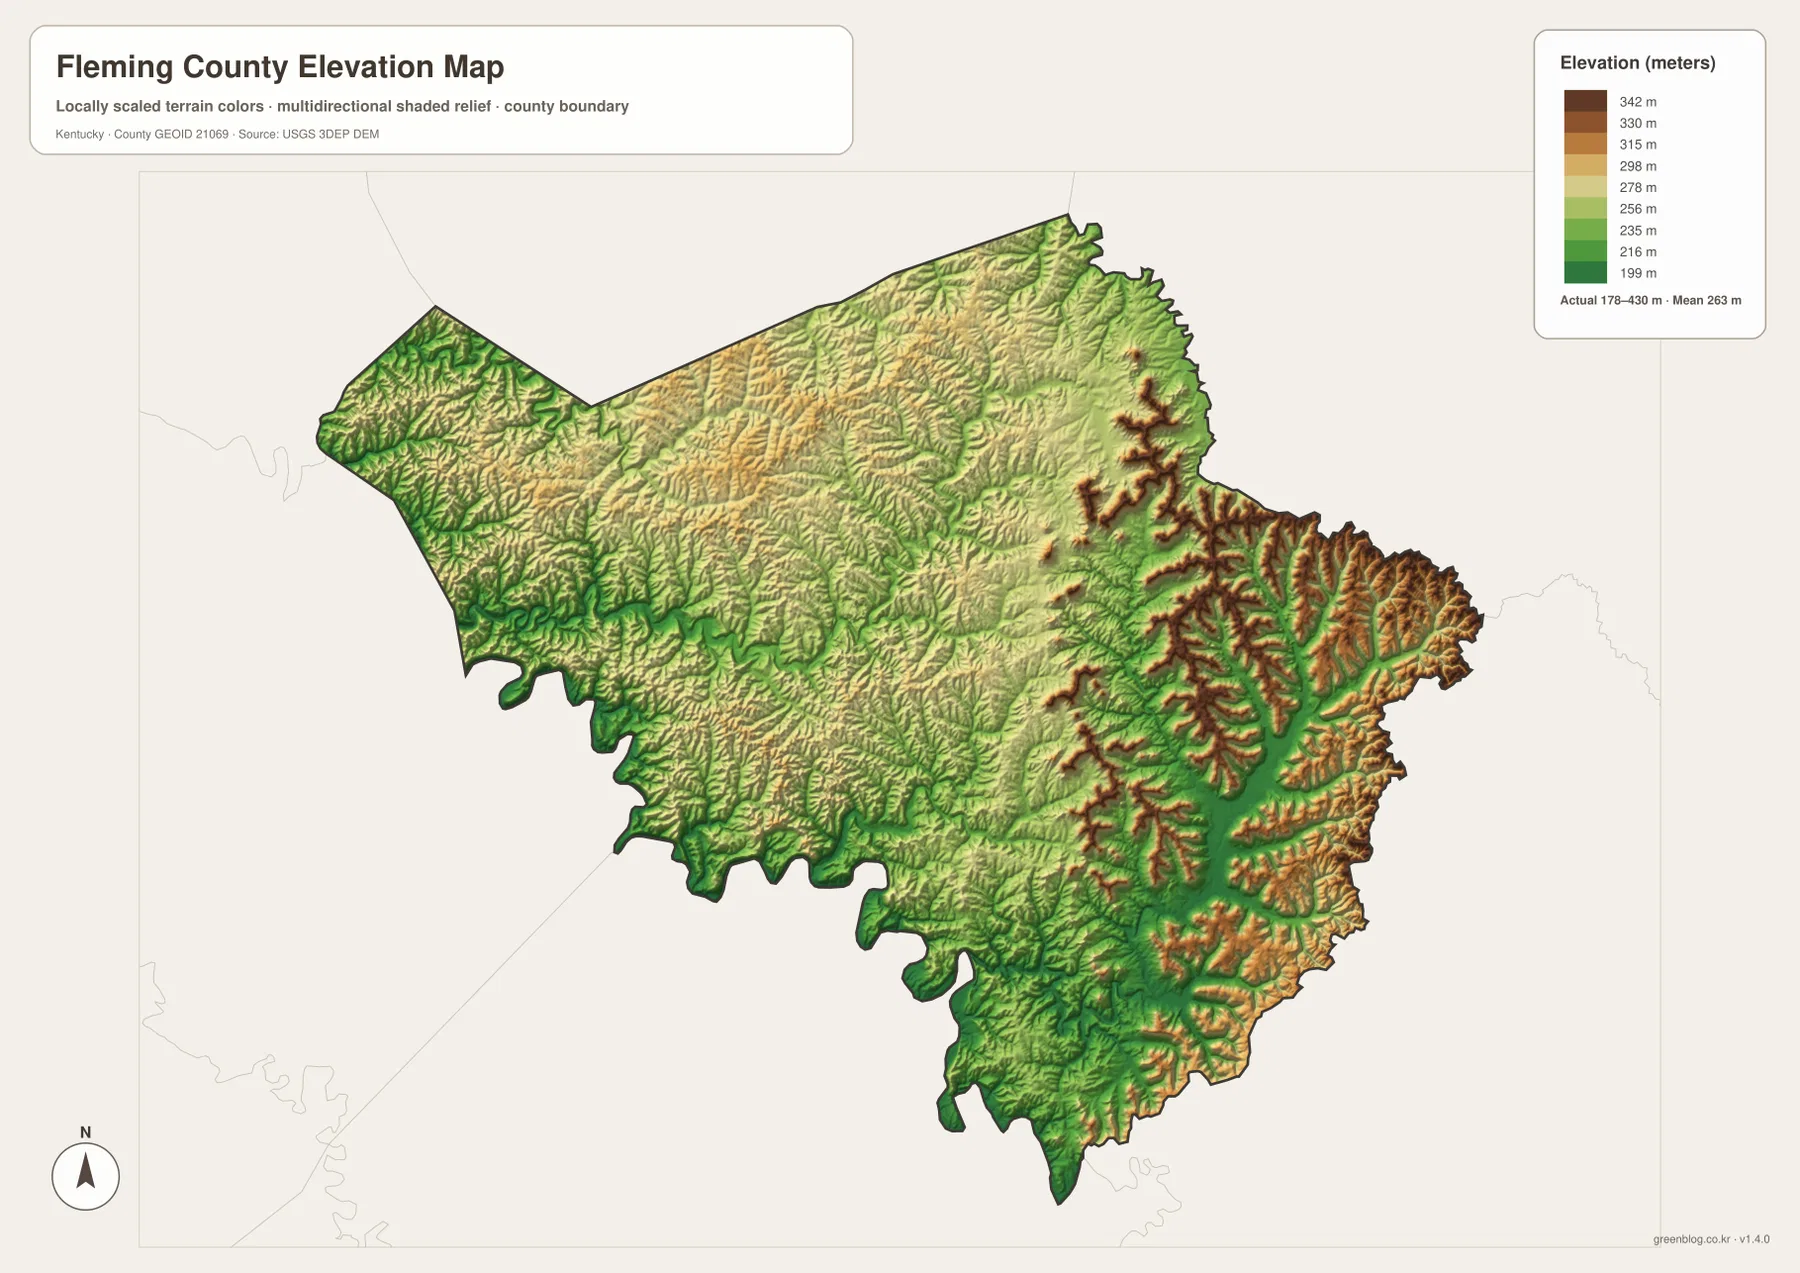
The 178–430 m elevation range rises sharply toward the eastern ridges
The elevation map reports an actual range of about 178 to 430 meters, with a mean of 263 meters. Lower green tones cover many valleys in the western and south-central portions of the county. In contrast, the east and southeast contain repeated brown ridge crests, producing the strongest relief visible anywhere inside the boundary.
The eastern terrain is not a single high plateau. Narrow valleys cut between branching ridges, especially around the Fox Creek and Indian Creek areas. Shorter ridge systems also appear in the northeast. The west is generally lower, but it is not uniformly flat; Johnson Creek and the southwestern boundary still pass through rolling ground with numerous smaller hollows.
The colored surface is meant for relative elevation comparison at county scale. It should not be treated as a survey, an engineering-grade elevation model, or an exact height for a parcel or structure. Its practical value is in showing where broad low valleys sit and where ridge country becomes steeper and higher.
Roads and creeks work together as practical location clues
Fleming County is easier to read when road names and water names are used together. Around Flemingsburg, the road network itself provides enough context to locate most nearby places. On the western side, U.S. 68 and the Ewing–Elizaville sequence create a straightforward frame of reference. In the southeast, where major settlement labels are scarce, KY 32, 158, and 211 become more useful when paired with Fox Creek, Indian Creek, and the surrounding valleys.
The county boundary also changes character from one side to another. Portions of the western and southern edge are deeply irregular, and the eastern boundary cuts across rugged ridge-and-valley terrain. Looking at the road map first and then switching to the water and elevation maps helps explain why many routes curve rather than following straight lines. In this county, the shape of a valley is often as important as compass direction when judging how two places relate on the ground.
Choose the map that matches the question you are trying to answer
Use the general county map when you need the boundary, road numbers, named places, and nearby context in one view. The city map is better when the main question is simply how Flemingsburg and Ewing are positioned within the county. The terrain-and-water map adds the creek and lake names that are useful for rural orientation, while the elevation map makes the contrast between lower western valleys and higher eastern ridges immediately visible.
The maps also work well in pairs. A road map beside the water map helps explain why a highway bends along a valley, and the water map beside the elevation map shows how streams tend to occupy the lower corridors between ridges. For legal boundaries, parcel work, floodplain decisions, construction, or live travel conditions, use the appropriate official or real-time source rather than relying on these static reference maps alone.
Download the high-resolution JPG map set
The ZIP download contains the high-resolution JPG originals for the general county map, city map, terrain-and-water map, and elevation map shown on this page. The files are larger than the WebP images used in the article, making them more convenient for printing, zooming in on labels, or preparing classroom and local-reference materials. Because each file emphasizes different information, you can use one map by itself or place several side by side.
A compact way to remember Fleming County on the map
A useful mental picture begins with Flemingsburg near the center, Ewing to the west, and the rougher ridge country to the east. U.S. 68 ties together the western cities, while state routes spread into the southern and eastern valleys. The creek network is highly branched, so names such as Johnson Creek, Allison Creek, Locust Creek, and Fox Creek often provide better rural landmarks than town names alone.
The elevation map reinforces that pattern. Although the countywide mean is 263 meters, the eastern ridge crests rise well above the lower valleys that occupy much of the west and south-central area. When the maps are used together, the county reads less like a collection of separate layers and more like one connected landscape: roads follow workable corridors, streams occupy lower ground, and towns are concentrated where those corridors are easier to reach.
Frequently Asked Questions
Where are Flemingsburg and Ewing on the Fleming County maps?
Flemingsburg sits slightly north of the county’s center and acts as the main road reference point. Ewing is farther west, near the U.S. 68 corridor. The city-index map shows only these two major labeled cities, so it is the clearest map for comparing their positions without smaller labels competing for attention.
What is the most noticeable terrain difference across Fleming County?
The strongest contrast is between the lower valleys of the west and south-central county and the higher, more closely spaced ridges in the east and southeast. The elevation map gives an actual range of roughly 178 to 430 meters. Around Fox Creek and Indian Creek, green valley floors are repeatedly bordered by higher brown ridge lines.
Which water features are useful landmarks on the map?
Johnson Creek is a useful western reference, Allison Creek and Locust Creek help orient the central and south-central portions, and Fox Creek and Indian Creek stand out in the east and southeast. Sycamore Lake in the north and Park Lake in the east provide two additional named landmarks where stream networks are dense.
Map File Information
Download the high-resolution JPG originals for Fleming County’s general, city, terrain-and-water, and elevation maps in one ZIP file.
- Included Files: Use only the versions confirmed in the article and supplied images
- File Type: Use the confirmed download contents
- Intended Use: Printing, education, presentations, and map-based projects
Related Maps
Sources and references
County boundary and administrative geography can be checked through the U.S. Census Bureau TIGER/Line program. Hydrography reference data are available through USGS National Hydrography, and the elevation layer is based on the type of source provided by the USGS 3D Elevation Program.
These maps are static geographic reference products. For legal parcel boundaries, emergency information, current road closures, flood-risk decisions, or site-specific engineering work, consult the responsible agency and the most current specialized data available for that purpose.
Green Map creates custom-edited map images using open geographic data sources such as geoBoundaries, Natural Earth, OpenStreetMap, and government open data. These maps are edited visual materials, not raw data files, and are provided for education, documents, presentations, and graphic reference.