Breckinridge County occupies a varied part of west-central Kentucky where the Ohio River shapes the northwest edge and a web of smaller valleys divides the interior. Hardinsburg serves as the clearest road and administrative reference in the middle of the county, while Cloverport provides a western point near the river and Irvington marks a separate northeastern connection. The maps on this page are designed to make those relationships easy to compare without treating the county as a flat outline. High-resolution map files are available for download in the section below.
High-resolution JPG copies of the maps can be downloaded from the file box later in the article. The package includes the county reference map, a simplified city-location map, a terrain-and-water map, and a locally scaled elevation map, all at 3638 × 2572 pixels. They work well for classroom material, printed regional references, and presentations, but they are not parcel maps, legal surveys, flood-zone products, live navigation maps, or engineering-grade elevation surfaces.
Table of Contents
Hardinsburg anchors the road network, but three towns define the county at a glance
Hardinsburg sits near the middle of the county and is identified by Kentucky state resources as the county seat. On the reference map, several routes meet or spread outward from the city, including U.S. 60, KY 259, and KY 261. Other labeled roads extend toward the east and northeast, such as KY 86, KY 690, KY 477, and KY 333, while KY 108, KY 105, and KY 79 appear farther south. The result is not a regular street grid but a branching rural network that bends around valleys and ridges.
Cloverport provides a very different point of orientation. It lies on the western side near the Ohio River, so the road pattern there is closely tied to the river edge and the county’s irregular western boundary. Irvington, shown more prominently on the city-location map, sits northeast of Hardinsburg and offers another useful reference for movement toward the county’s upper-right side. The city map lists direct distances of about 12 miles from Hardinsburg to Irvington and about 11 miles to Cloverport, which makes the three places easy to compare even without reading every road number.
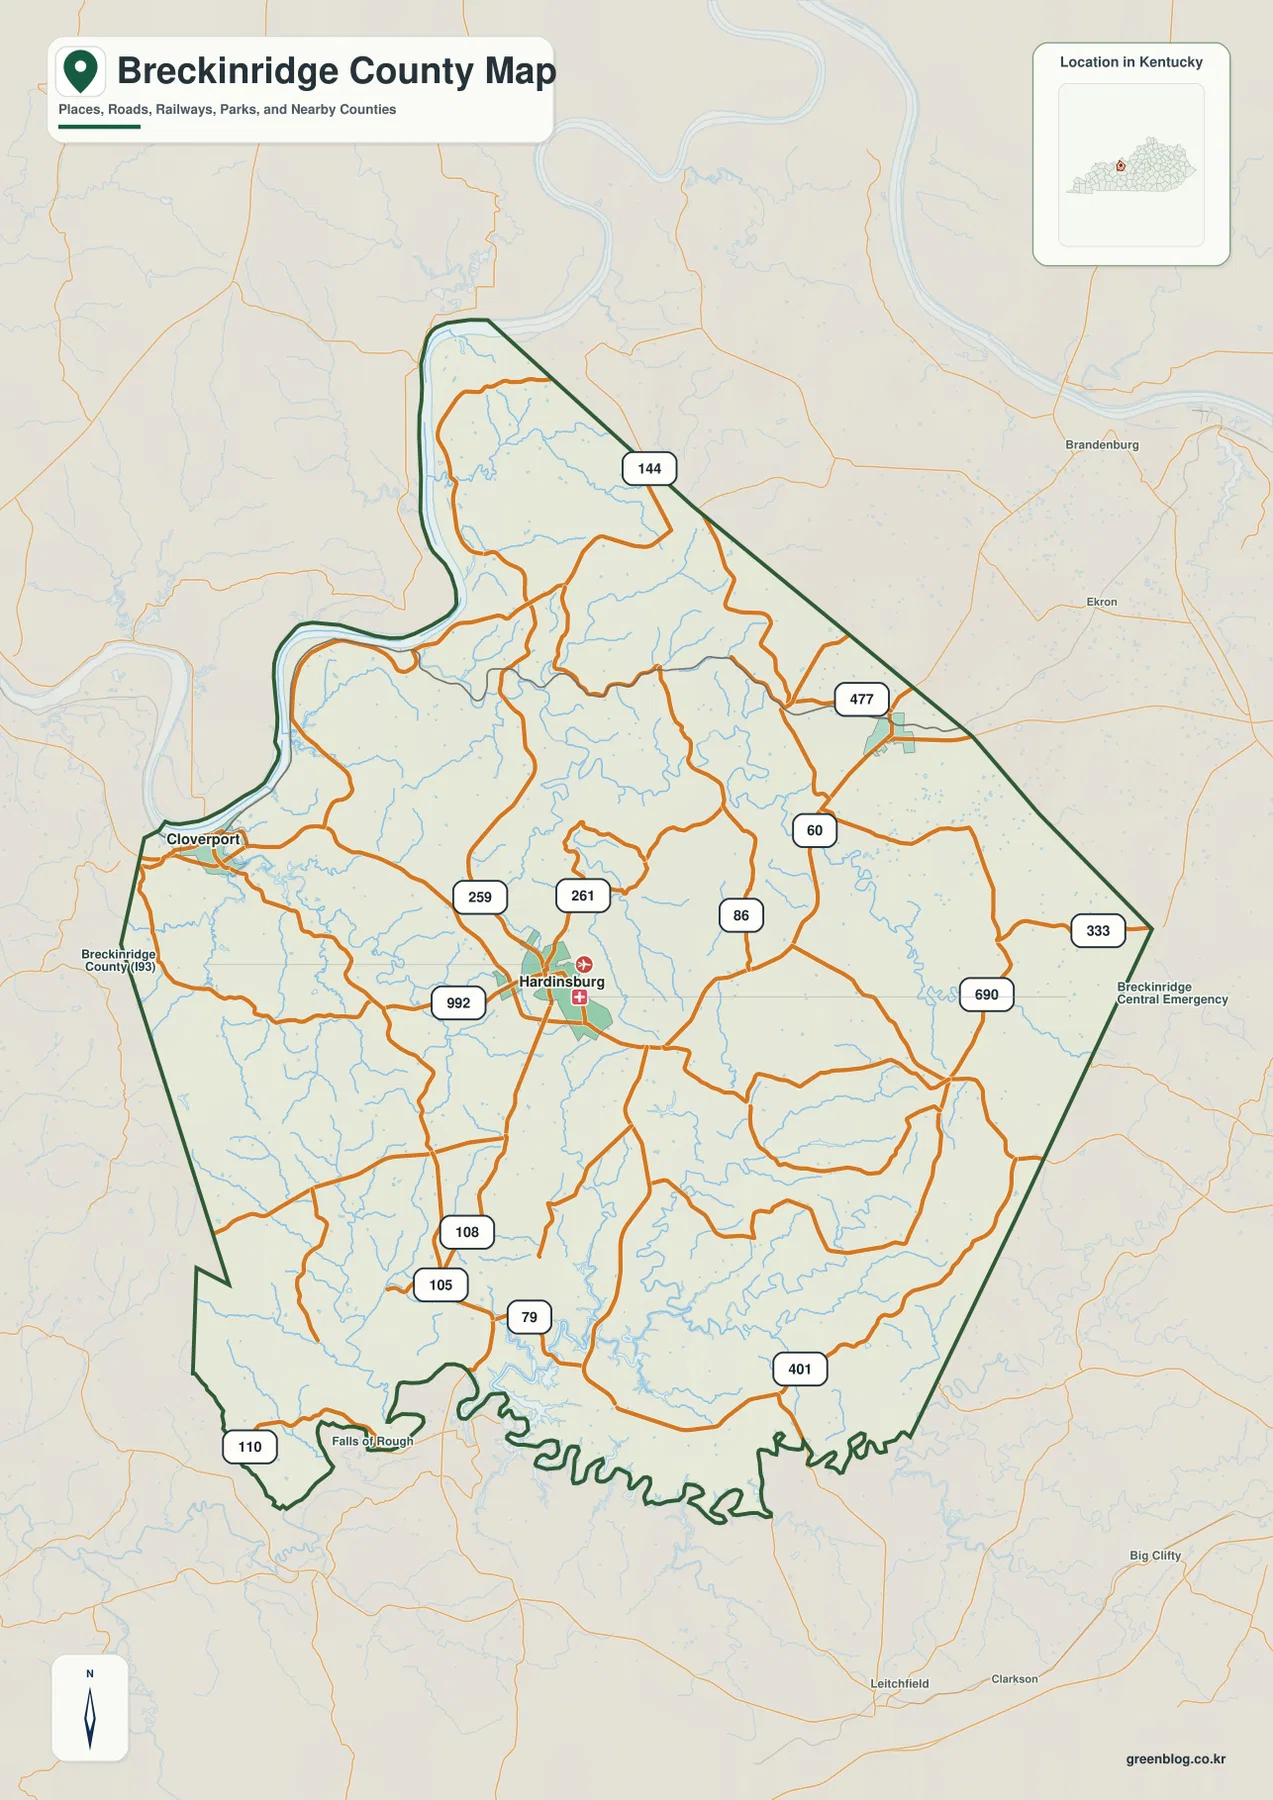
The reference map is the better choice when route relationships matter. It shows how the main roads leave Hardinsburg in several directions, how the western network reaches Cloverport, and how the southern roads continue toward the Falls of Rough area. Because smaller roads and streams remain visible, the map also hints at why routes curve so often: the county interior is cut by many small drainage valleys rather than crossed by broad, open plains.
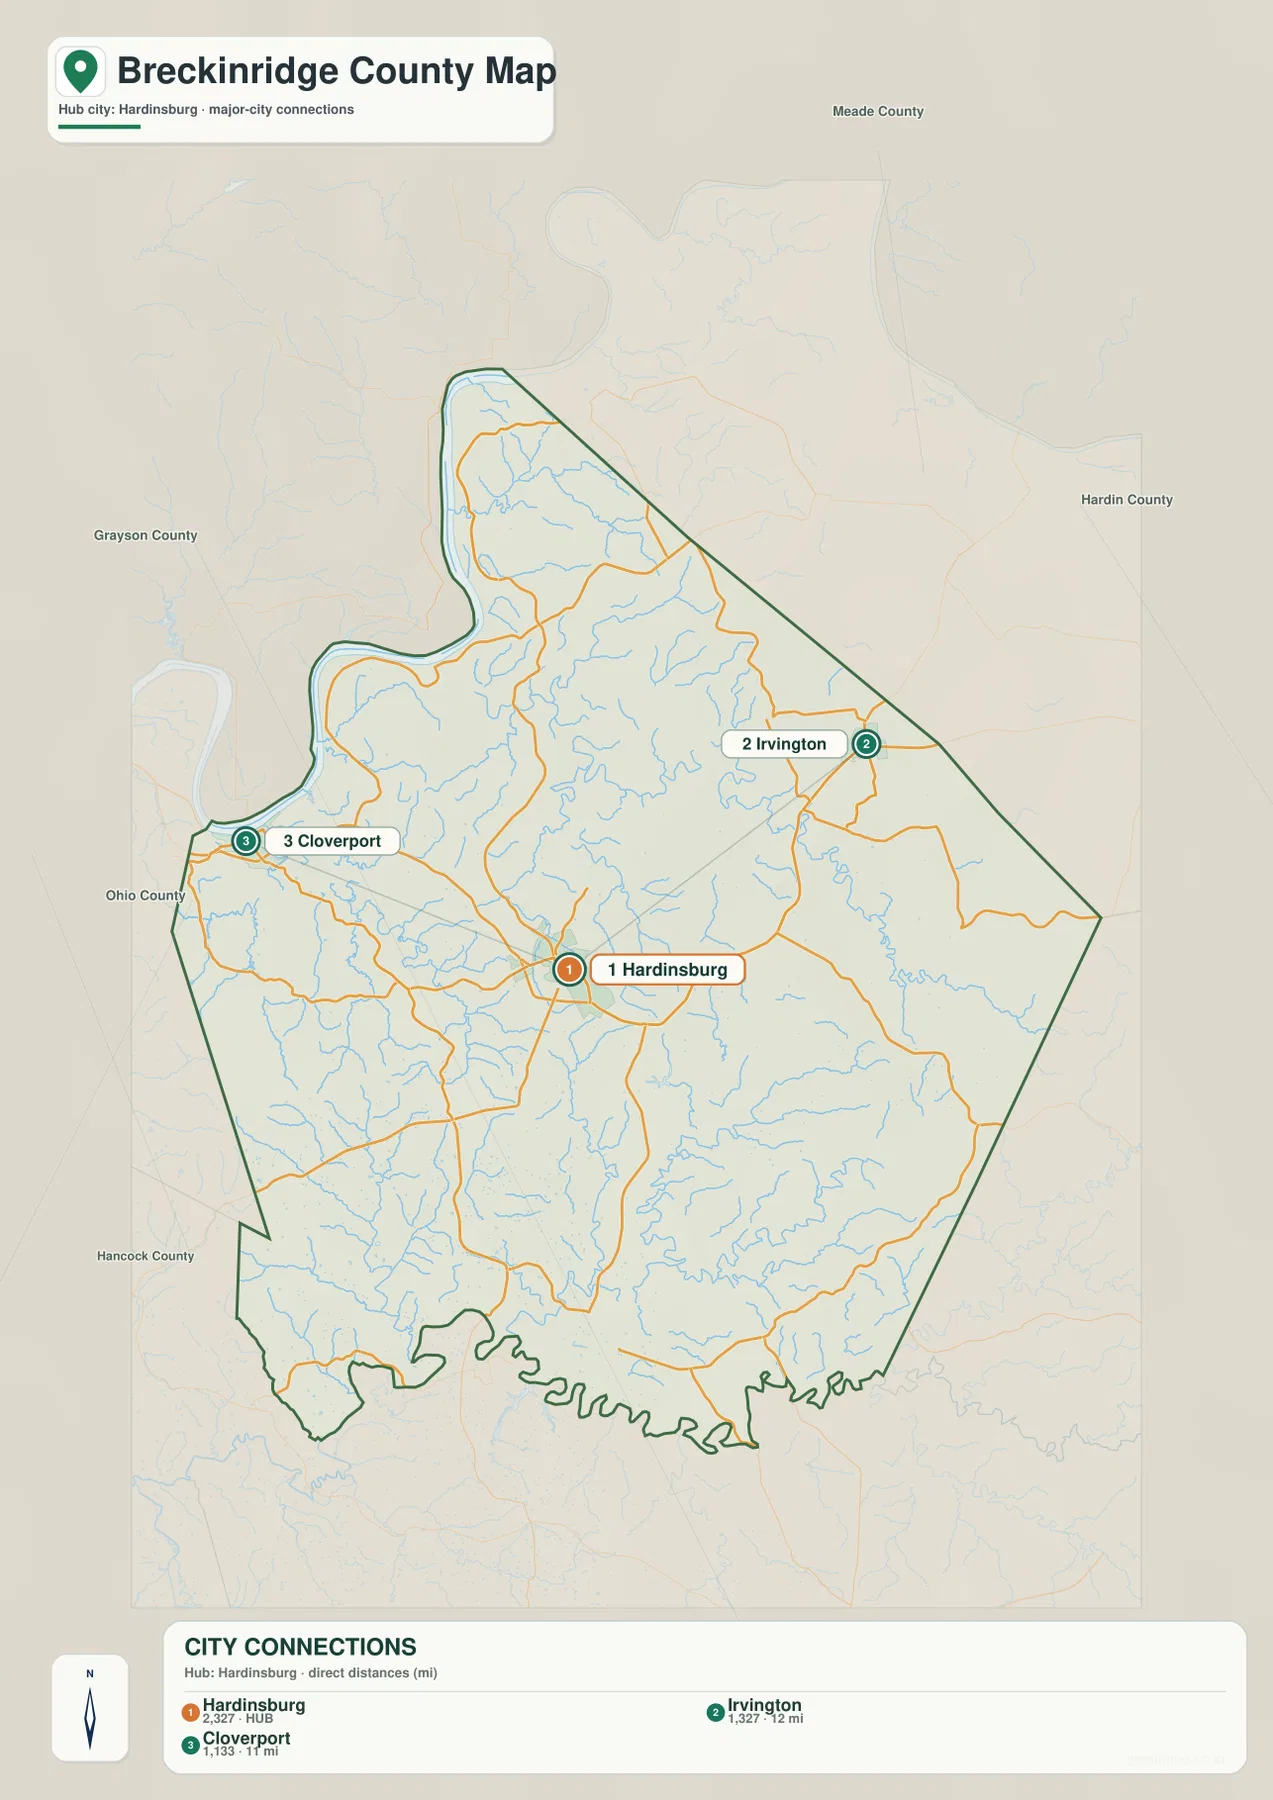
The city map deliberately removes much of that detail. It is useful when a reader only needs to understand where the three primary town references sit within the county and how they relate to surrounding counties. Hardinsburg remains the central anchor, Irvington appears toward the northeast, and Cloverport marks the western side. For a presentation or quick county overview, that stripped-down view is often easier to read than the full road map.
The Ohio River gives the northwest edge a distinctive shape
The county outline becomes most distinctive along the west and northwest. Instead of following a single straight line, the boundary bends with the Ohio River and forms a long, irregular edge near Cloverport and the northern extension of the county. The river itself is broad enough to dominate the map background, and several smaller streams flow toward it from the interior. This makes the western side easy to recognize even when the county is viewed without place labels.
Kentucky’s official local profile for Breckinridge County highlights access to the Ohio River as one of the county’s defining geographic advantages. The map makes that relationship concrete. The river is not merely nearby; it helps shape the county edge, creates lower terrain along parts of the western side, and gives Cloverport a location that is physically different from inland Hardinsburg. Moving away from the river, the landscape quickly becomes more dissected by hills and narrow tributary valleys.
That transition matters when reading the road map. Roads near the river and broader low ground can follow more continuous corridors, but routes farther inland frequently bend around local relief. Small streams are visible almost everywhere inside the boundary, so the county’s transportation pattern is best understood as a response to repeated valleys and ridges rather than as a simple set of east-west and north-south lines.
Creeks divide the interior into many small valleys
The terrain-and-water map makes the drainage network much easier to follow. Yellowbank Creek appears in the northern part of the county, while Sugar Tree Run and Hurricane Creek occupy central-northern valleys. Clover Creek is labeled farther west, and Sinking Creek forms a long drainage feature toward the east. In the southern half, the North Fork Rough River and its tributaries become a major reference. Numerous unnamed branches fill the spaces between those larger labels.
The important pattern is the density of the network. Breckinridge County is not crossed by one dominant interior river with large empty areas on either side. Instead, many small valleys converge toward larger streams, leaving narrow uplands between them. Cloverport and the western river edge, the central area around Hardinsburg, and the southern Rough River drainage all sit within the same branching system, even though they occupy different parts of the county.
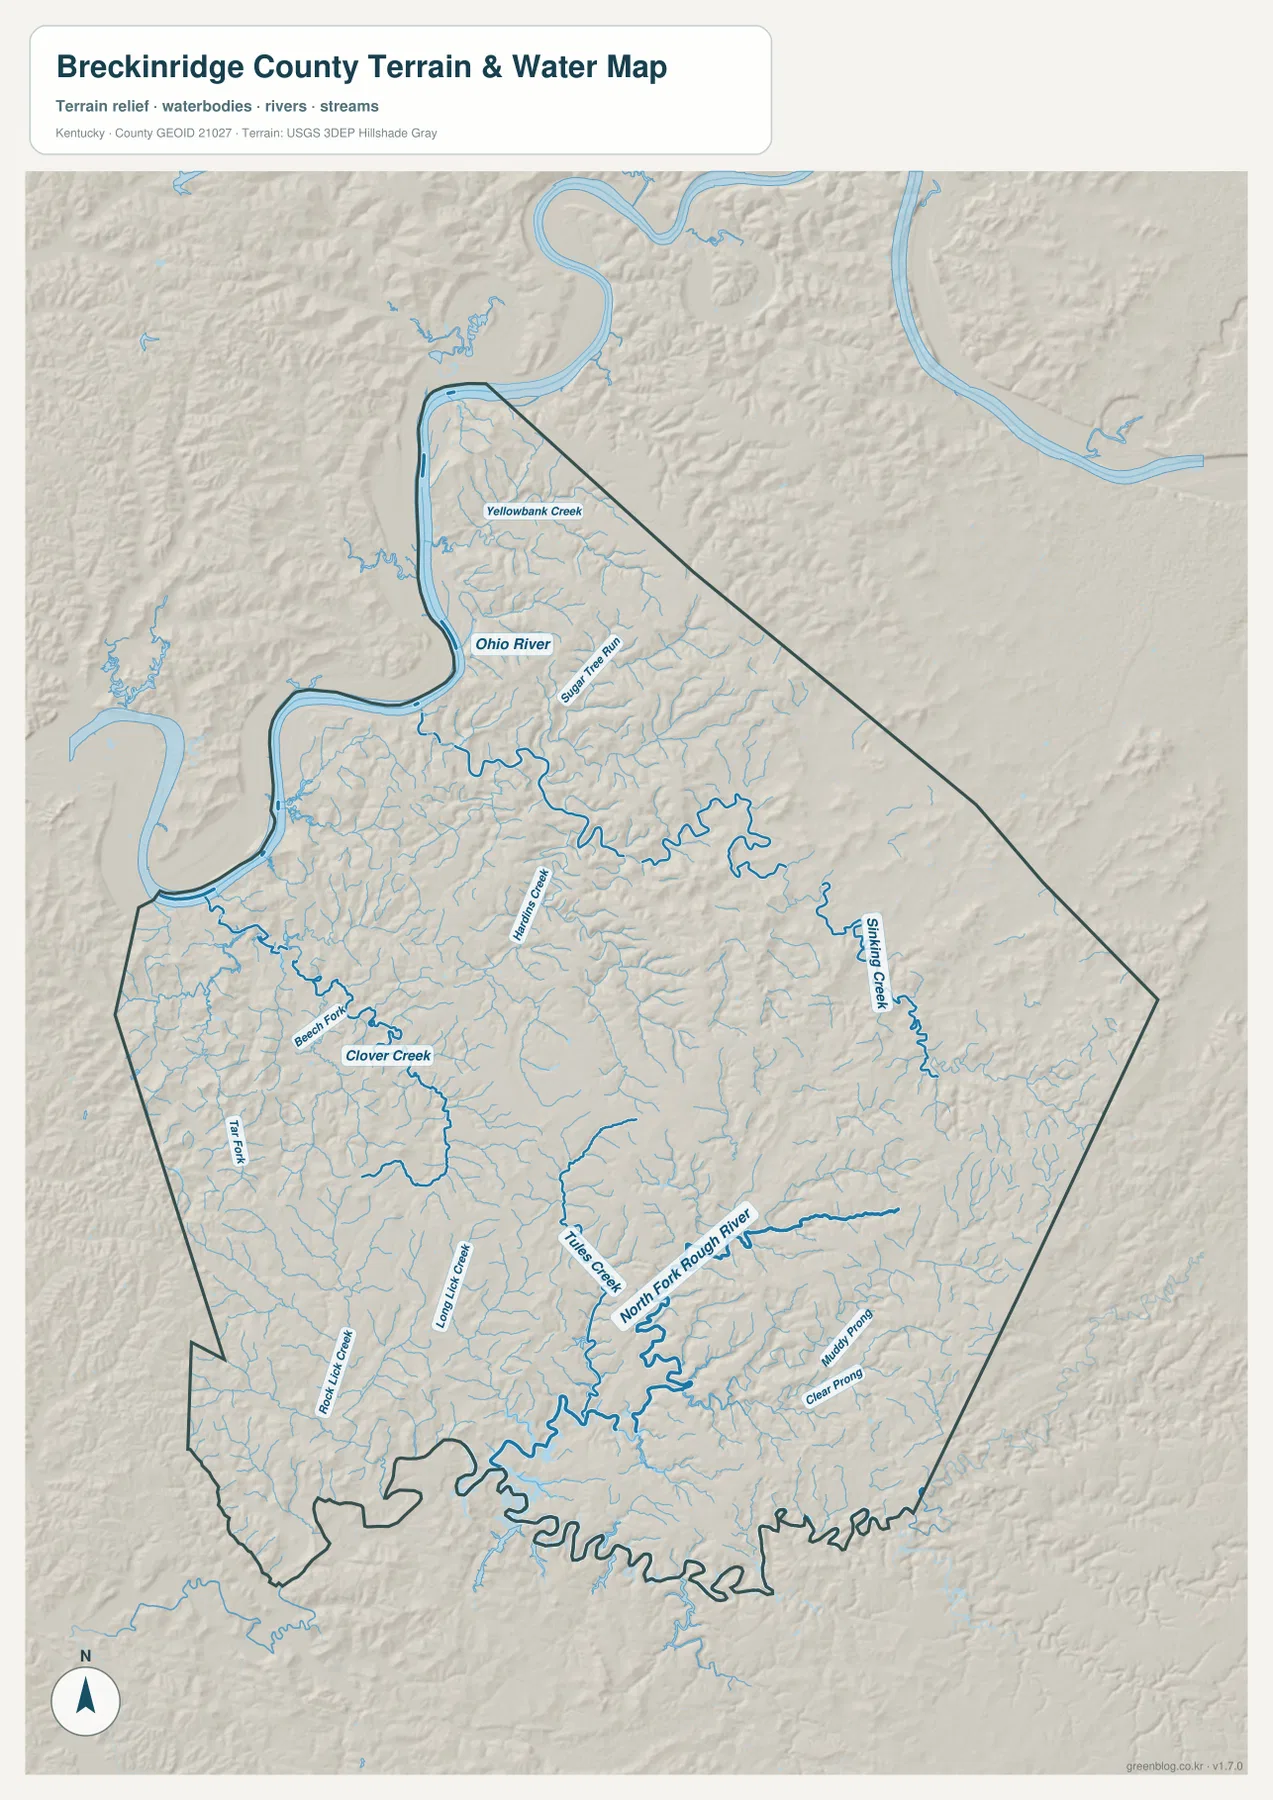
Shaded relief behind the blue stream lines explains why the drainage looks so intricate. Water follows lower corridors between rounded ridges, and many roads use the same corridors because they provide more continuous ground than the uplands. Kentucky Tourism notes that Rough River Dam lies in Grayson and Breckinridge counties, reinforcing the importance of the Rough River system along the county’s southern side. The map here, however, is only a geographic reference and should not be used to determine flood exposure, reservoir operations, water depth, or boating conditions.
A 117–279 meter range creates stronger relief than the numbers suggest
The elevation map shows an actual mapped range of roughly 117 to 279 meters, with a mean near 189 meters. Those values are modest compared with mountain counties in eastern Kentucky, yet the visual relief is still pronounced because elevation changes occur repeatedly over short distances. Lower green areas cluster along the Ohio River and stream valleys, while yellow, tan, and brown ridges appear across much of the interior.
Parts of the central, eastern, and southeastern county contain especially frequent higher ridges. Between them, narrow green corridors trace the same valleys visible on the water map. This alternating pattern of low drainage lines and higher uplands helps explain why roads twist and why broad straight routes are less common away from the river. Hardinsburg sits within this rolling interior rather than on an isolated high summit, which is consistent with the way several roads converge there from different valleys.
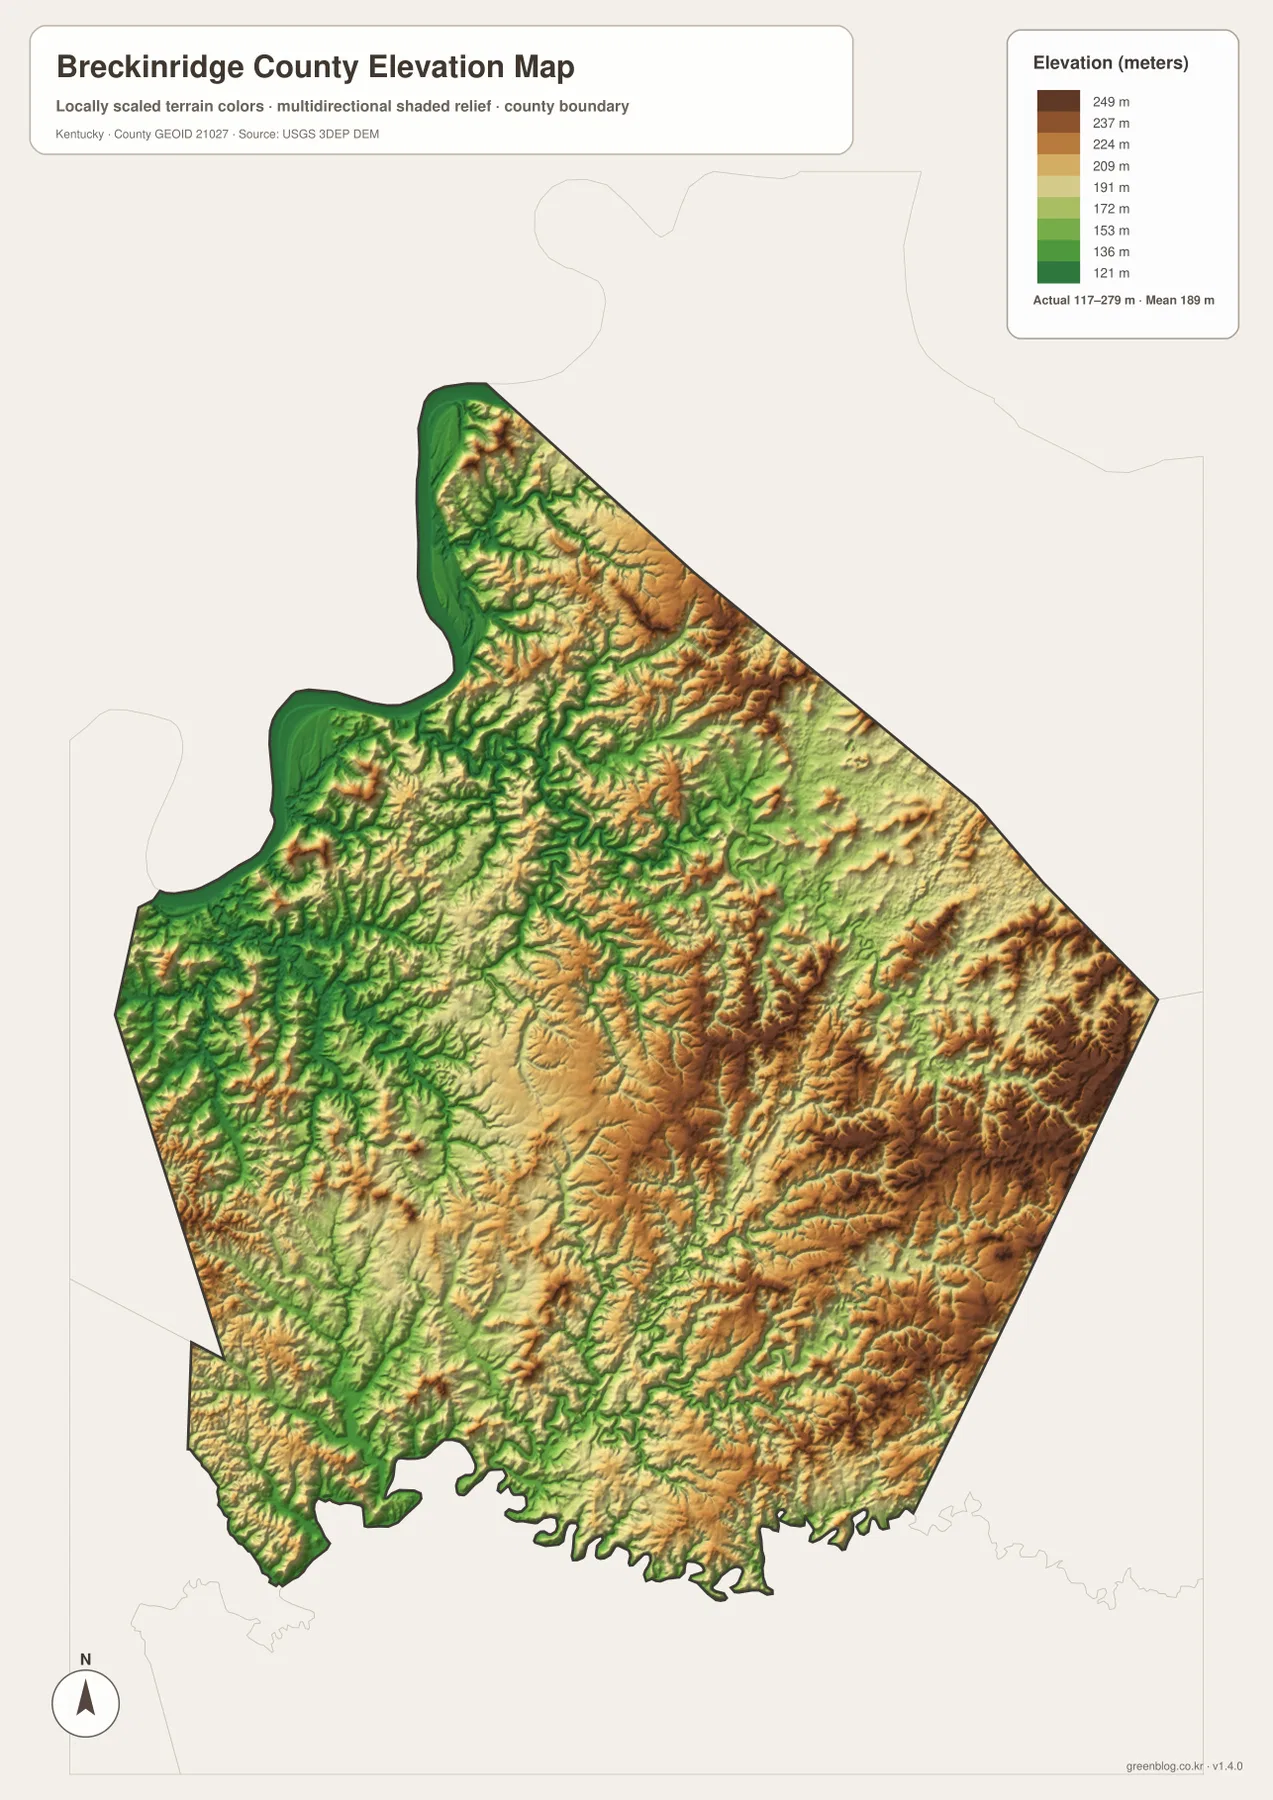
Comparing the elevation and road maps is particularly useful around the southern and eastern parts of the county. A road that appears indirect on the reference map often follows a lower corridor or bends around a ridge when viewed against the elevation surface. The same comparison helps explain why settlement and transportation concentrate in connected valleys rather than evenly across every upland area.
This elevation surface is generalized for countywide viewing. It can show where terrain is relatively low or high and provide context for roads and drainage, but it cannot supply the precise elevation of a building site, road grade, drainage structure, or construction area. Those uses require authoritative higher-resolution data and, when appropriate, professional field measurement.
A practical way to compare the four map files
Start with the county reference map when the question involves road numbers, the full boundary, or the relationship between Hardinsburg and smaller labeled places. It carries the most information and is the strongest general-purpose view. Switch to the city map when the goal is simply to place Hardinsburg, Irvington, and Cloverport without the distraction of dozens of local roads and streams.
For physical geography, the water and elevation maps work best as a pair. Find the Ohio River, Clover Creek, Sinking Creek, or the North Fork Rough River on the terrain-and-water map, then look for the corresponding low green corridor on the elevation map. The repeated relationship between drainage and low ground becomes clear, and the higher ridges between streams are easier to recognize.
In printed material, keeping the maps separate usually produces a cleaner explanation than stacking every layer into one image. A road-focused handout can use the reference map, a county-seat overview can use the city map, and a terrain lesson can place the water and elevation maps side by side. Because each map covers the same county extent, readers can move from one view to another without losing their geographic frame of reference.
These maps remain overview resources. Current closures, address-level navigation, parcel ownership, legal boundaries, flood zones, and site-specific elevation should be checked through the responsible agency or a more specialized map. Used within those limits, the set provides a clear way to explain how Breckinridge County’s towns, river edge, interior creeks, and rolling terrain fit together.
Frequently Asked Questions
Which map is best for comparing Hardinsburg with Cloverport and the road network?
Use the county reference map. It keeps Hardinsburg, Cloverport, U.S. 60, KY 259, KY 261, and other labeled routes in the same view, so it is easier to follow the western connection toward the Ohio River. The city map is cleaner when you only need the relative positions of Hardinsburg, Irvington, and Cloverport.
Which named waterways can I identify besides the Ohio River?
The terrain-and-water map labels Yellowbank Creek, Clover Creek, Hurricane Creek, Sinking Creek, and the North Fork Rough River, along with several smaller branches. These names are useful for geographic orientation and for comparing stream valleys with the road and elevation maps. They should not be treated as flood, navigation, or property-boundary information.
Can the 117–279 meter elevation range be used for construction or survey work?
No. The range is appropriate for comparing relative terrain across the county, such as lower river corridors and higher interior ridges. A building site, road project, drainage design, or survey requires more precise authoritative elevation data and, where needed, field measurements.
Map File Information
The original Breckinridge County maps used in this article are packaged as high-resolution JPG files. Each source image is 3638 × 2572 px, giving more detail than the WebP previews for printing, classroom material, and document work.
- Included Files: county reference map, city-location map, terrain-and-water map, elevation map
- File Type: JPG
Related Maps
Sources and references
County administration information is available from Breckinridge County Government and the Kentucky.gov Breckinridge County profile. Boundary background data can be reviewed through the U.S. Census Bureau TIGER/Line program, water data through USGS National Hydrography, and elevation data through the USGS 3D Elevation Program. Additional regional context is available from Kentucky Tourism’s Rough River Dam State Resort Park page.
Green Map creates custom-edited map images using open geographic data sources such as geoBoundaries, Natural Earth, OpenStreetMap, and government open data. These maps are edited visual materials, not raw data files, and are provided for education, documents, presentations, and graphic reference.