How much of a government’s tax revenue comes from customs and other import duties? The answer varies enormously across economies. This article uses the World Bank indicator GC.TAX.IMPT.ZS to compare the share of total tax revenue collected from customs and other import duties. The most important distinction is that this is not a tariff-rate indicator. It measures the contribution of import-related taxes to total tax revenue. Two economies can apply similar tariffs and still report very different revenue shares because import volumes, exemptions, domestic taxes, collection systems, and the size of the overall tax base differ.
The supplied dataset contains the latest non-missing observation for 157 economies, but those observations do not all refer to 2024. Sixty-six economies have 2024 values and 20 have 2023 values. In total, 112 observations are from 2020 or later, while 30 economies have a latest observation from before 2010. The full range runs from 1979 to 2024. That mixed-year structure matters: a list of all 157 “latest” values should not be read as a current same-year world ranking. A safer approach is to describe the broad latest-available distribution and then make direct comparisons within the same year.
Table of Contents
What the indicator actually measures
According to the World Bank definition supplied with the dataset, taxes and duties on imports are taxes on goods and services that become payable when goods enter the economic territory or when services are delivered by non-resident producers to residents. The denominator is tax revenue, meaning compulsory and unrequited payments made to government units. A value of 20% therefore means that roughly one-fifth of the tax revenue in that observation year came from customs and other import-related duties. The figure says nothing directly about the average tariff on an imported product or the statutory maximum tariff.
This distinction also explains why a high value cannot automatically be translated into “high protectionism.” The ratio depends on both the numerator and the denominator. If income taxes, value-added taxes, corporate taxes, and other domestic revenues are large, the customs share can be small even when some tariffs remain meaningful. If border taxation is an important collection point or the domestic tax base is relatively limited, import duties can account for a much larger fraction of total tax revenue. Explaining the cause requires additional information on tariff schedules, imports, exemptions, tax administration, and the composition of domestic revenue.
The 2024 median is about 5.0% of tax revenue
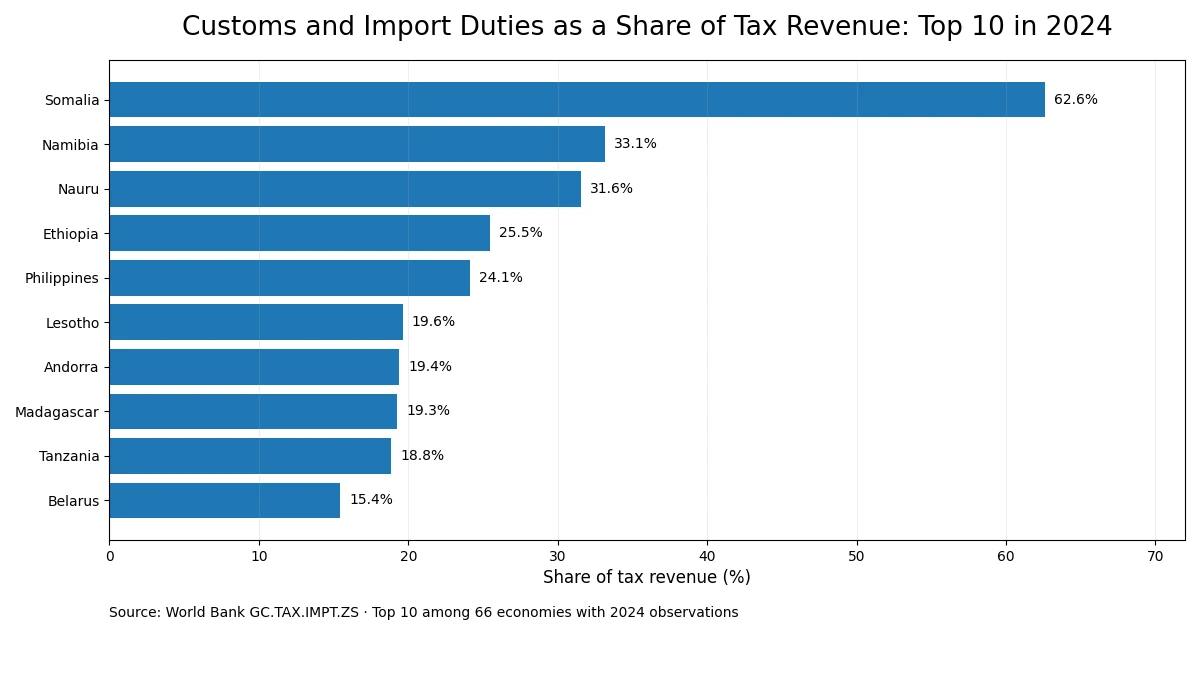
Restricting the comparison to the 66 economies with 2024 observations removes the largest timing problem. The median in this same-year subset is 5.05%, meaning half of the observed economies are above that level and half are below it. Thirty-three of the 66 economies are at or above 5%, 17 are at or above 10%, and five are at or above 20%. At the other end, 12 economies are at or below 1%. Even within a single year, the role of customs and import duties in the tax system ranges from almost negligible to more than half of total tax revenue.
| Economy | Year | Share of tax revenue |
|---|---|---|
| Somalia | 2024 | 62.59% |
| Namibia | 2024 | 33.13% |
| Nauru | 2024 | 31.56% |
| Ethiopia | 2024 | 25.47% |
| Philippines | 2024 | 24.12% |
| Lesotho | 2024 | 19.61% |
| Andorra | 2024 | 19.38% |
| Madagascar | 2024 | 19.26% |
Somalia has the highest 2024 value in the supplied data at 62.59%, followed by Namibia at 33.13%, Nauru at 31.56%, Ethiopia at 25.47%, and the Philippines at 24.12%. These are descriptive revenue shares, not direct measures of tariff policy. The same-year table is useful because it avoids comparing a current fiscal structure with a figure that may be decades old. It still does not reveal why an economy has a high customs share. That question needs a broader fiscal and trade dataset rather than an inference from this ratio alone.
How to read values that are close to zero
Several 2024 observations are extremely small. Bosnia and Herzegovina, Romania, France, Greece, and the United Arab Emirates all have values below 0.1% in this dataset. France is around 0.006%, Greece around 0.012%, and the United Arab Emirates around 0.016%. A near-zero value should not be translated into “no tariffs.” It means that customs and other import duties contributed a very small share of total tax revenue in the reported year. The statutory tariff structure, preferential trade agreements, exemptions, the scale of imports, and the size of other taxes can all affect that outcome.
| Economy | Year | Share of tax revenue |
|---|---|---|
| Bosnia and Herzegovina | 2024 | 0.00003% |
| Romania | 2024 | 0.00056% |
| France | 2024 | 0.00601% |
| Greece | 2024 | 0.01234% |
| United Arab Emirates | 2024 | 0.01631% |
| Bulgaria | 2024 | 0.05411% |
| Norway | 2024 | 0.27593% |
| Israel | 2024 | 0.37594% |
The all-economy median is 6.7%, but the years are mixed
Across all 157 latest non-missing observations, the median is 6.68%. If the window is narrowed to 2023 and 2024, the median for 86 economies is 6.07%. Those figures are fairly close, but the full dataset includes very old observations that can dominate an apparent ranking. For example, some of the highest latest-available values are Bahrain at 87.91% in 2013, Kuwait at 70.34% in 1998, and Benin at 62.02% in 1979. They are valid historical observations, but they should not be placed beside 2024 Somalia or Namibia as if all four described the same fiscal moment.
“Latest available” therefore means the most recent non-missing observation for each economy, not a harmonized reference year. This is a common feature of country-level databases when reporting schedules differ. A map based on these values can still be useful for finding where import duties have been more or less important in reported tax structures, but the observation year needs to remain visible. When an economy’s latest value is old, the number may no longer be a good description of its present fiscal system.
What high and low shares can tell you
- A high share shows: customs and other import duties made up a comparatively large part of total tax revenue in that observation year.
- A low share shows: border-related duties contributed only a small portion of total tax revenue; it does not by itself show that tariff rates were low.
- For country comparisons: use the same year, or years that are close together, before interpreting gaps between economies.
- For explanation: combine this ratio with tariff rates, import values, product-level duties, exemptions, trade agreements, and the wider composition of tax revenue.
The indicator is therefore better suited to a fiscal-structure question than to a broad judgment about trade openness. A low customs share can coexist with tariffs if other tax sources dominate. A high customs share can reflect the importance of border taxation without telling us whether the average tariff schedule is unusually high. The ratio’s most defensible interpretation is simple: it shows how important import-related duties were within the government’s recorded tax revenue for that year.
A safer way to compare economies
If the goal is a current cross-country comparison, start with the 66 economies that report 2024 values, or expand cautiously to the 86 economies with 2023–2024 observations. If the goal is to understand one economy’s direction over time, use the full time series rather than the latest point alone. If the goal is to understand fiscal dependence on trade taxes, pair the percentage with absolute customs revenue or a tax-to-GDP measure. A high percentage can occur in a small overall tax system, while a large economy can collect substantial customs revenue and still report a low percentage because other taxes are much larger.
Very small values also require careful formatting. Rounding France’s 0.006% to one decimal place would display 0.0%, hiding the fact that the observation is positive. The low-end table therefore keeps additional decimal places. The same caution applies to historical observations: when a decades-old value appears near the top of a latest-available list, check the year before drawing a present-day conclusion. These two habits—preserving small values and preserving the observation year—prevent many of the most common misreadings of this indicator.
What this dataset can and cannot answer
The dataset can answer a focused question: what share of reported tax revenue came from customs and other import duties in each economy’s latest available observation? It can also support same-year comparisons and show how widely that share varies. It cannot, by itself, tell us the average tariff rate, identify which imported products generate the most revenue, measure the restrictiveness of trade policy, or establish why one economy relies more heavily on border taxes than another. Those questions require additional trade and fiscal indicators.
Summary
The World Bank GC.TAX.IMPT.ZS dataset contains 157 latest non-missing country observations with an overall median of 6.68%, but the years span 1979–2024. That makes the full set unsuitable as a single current ranking. Among the 66 economies observed in 2024, the median is 5.05%, with Somalia at 62.59%, Namibia at 33.13%, and Nauru at 31.56%, while several economies are below 1%. The useful takeaway is not simply which value is highest. It is how important customs and import duties are within each economy’s tax-revenue structure, interpreted with the observation year and with complementary tariff, trade, and fiscal data when explaining the reasons behind the differences.
Frequently Asked Questions
Does a high value mean the economy has a high average tariff rate?
No. The indicator is the share of total tax revenue coming from customs and other import duties. It is also affected by imports, exemptions, and the size of other tax revenues.
Can all 157 economies be ranked as if the data were from 2024?
No. The latest non-missing observations span 1979 to 2024. Same-year comparisons, such as the 66 economies observed in 2024, are more defensible.
Does a value near zero mean there are no tariffs?
No. It means customs and other import duties contributed a very small share of total tax revenue in that year. Actual tariff rates and trade rules require separate data.
Related Articles
Green Map creates custom-edited map images using open geographic data sources such as geoBoundaries, Natural Earth, OpenStreetMap, and government open data.
These maps are edited visual materials, not raw data files, and are provided for education, documents, presentations, and graphic reference.