GNI per capita at purchasing power parity is designed to compare average national income after adjusting for differences in price levels across economies. In the latest available World Bank observations, Singapore has the highest value at $135,750 in current international dollars, followed by Qatar at $126,290, Macao SAR at $125,630 and Bermuda at $122,530. These figures are useful for cross-country comparisons of purchasing-power-adjusted income, but they are not the same as household earnings, disposable income or market-exchange-rate dollars.
The comparison contains 202 economies and every row has a numeric value. There are no missing observations. The important limitation is timing: 181 economies have a 2025 observation, 14 have a 2024 observation, and 7 use an earlier latest available value from 2007 through 2023. The ranking should therefore be read as a latest-available comparison rather than a perfectly synchronized 2025 league table.
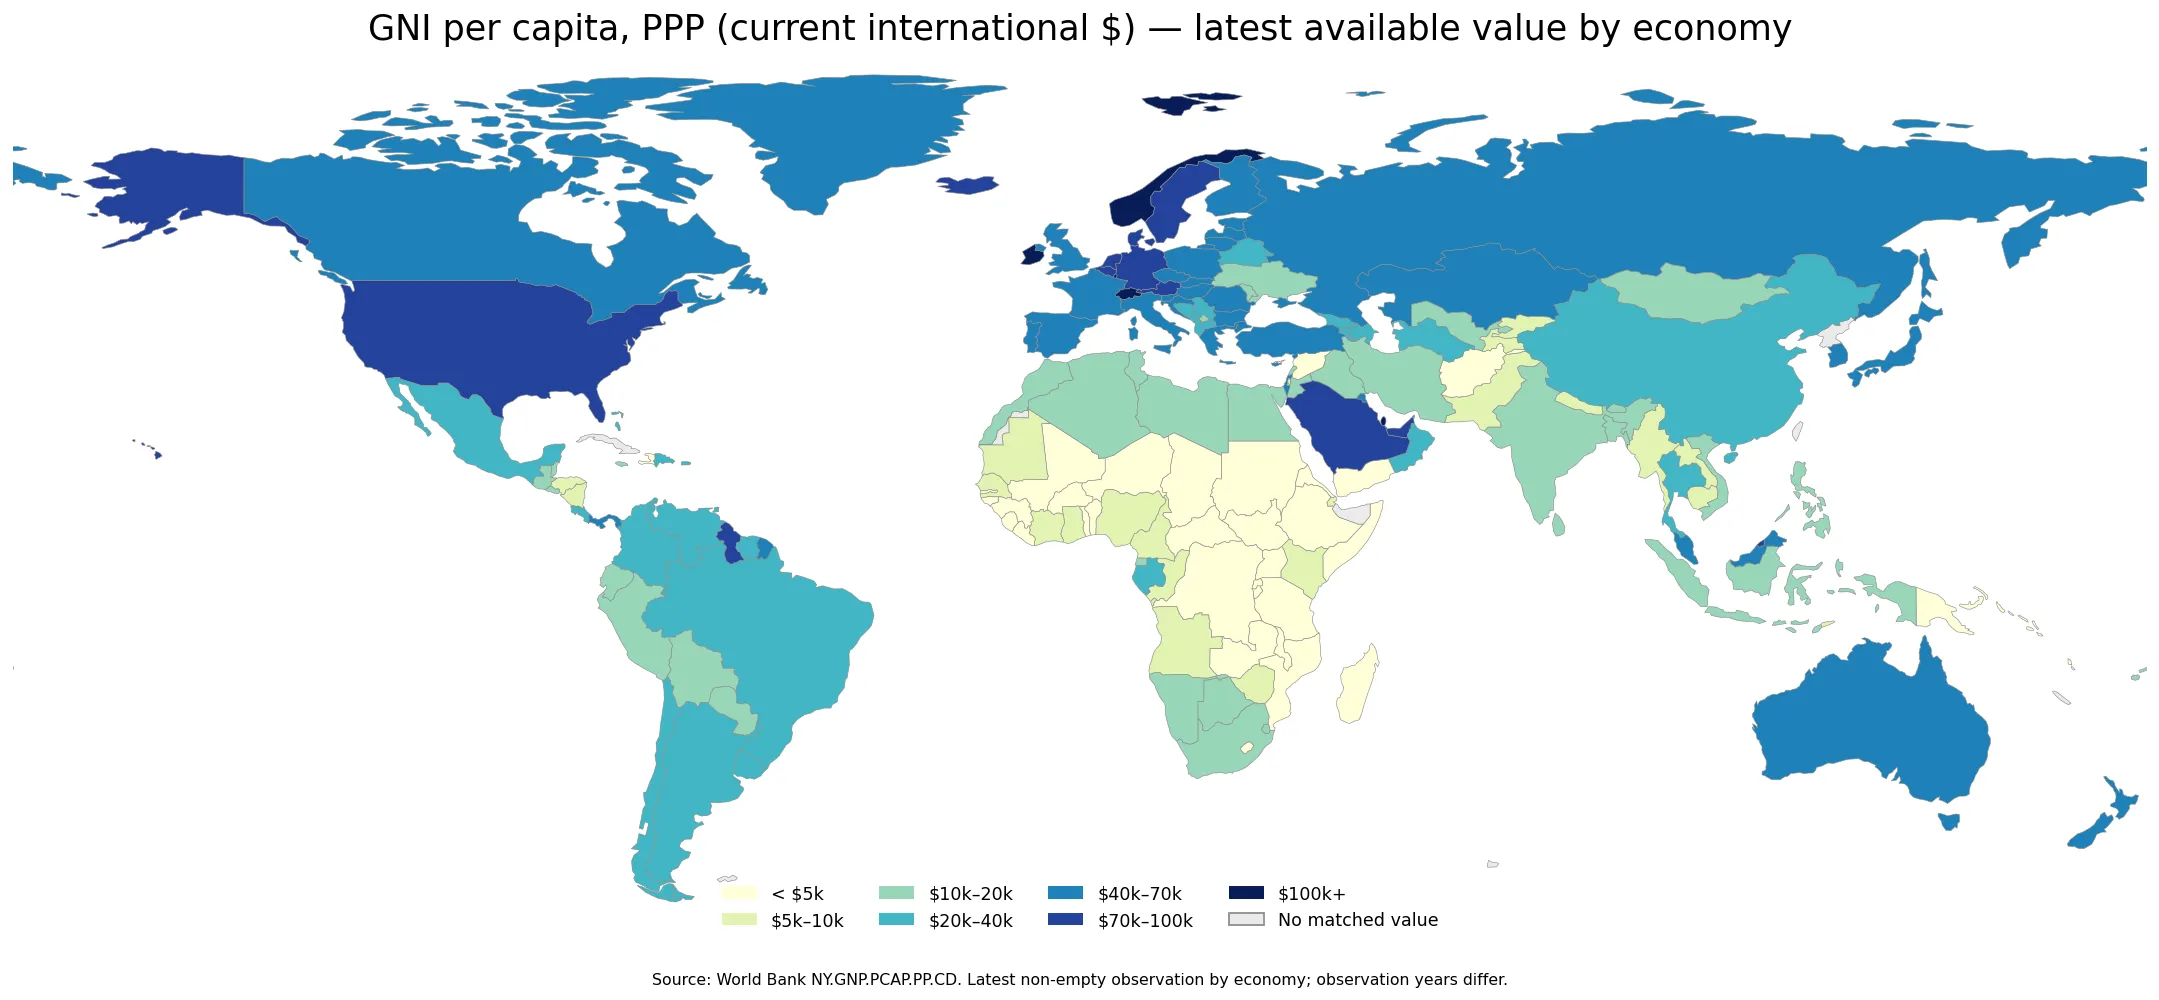
Table of Contents
What GNI per capita at PPP measures
Gross national income measures income accruing to residents of an economy, including relevant primary income flows with the rest of the world. Dividing GNI by population produces a per-person average. Applying purchasing power parity then converts that average into international dollars using price-level comparisons rather than only market exchange rates. The aim is to make the purchasing power of income more comparable across economies where the same basket of goods and services may have very different local prices.
An international dollar is a comparison unit, not a banknote and not an amount that residents can literally exchange at a foreign-exchange counter. It is intended to have purchasing power comparable to a US dollar in the reference economy. That makes PPP-based GNI useful for broad living-standard and income-capacity comparisons, but it does not reveal how income is distributed between households. Two economies with similar GNI per capita can still differ sharply in inequality, taxation, public services, housing costs and household disposable income.
Why PPP values differ from market-exchange-rate income
Market exchange rates are shaped by financial markets, capital flows, monetary policy and trade conditions. A currency can depreciate quickly even when domestic production and many local prices do not change by the same proportion. Converting national income at the market rate can therefore make international income comparisons move sharply because of exchange-rate changes. PPP conversion instead uses relative price levels to estimate how much local income can purchase at home.
That does not make PPP the correct choice for every question. If the question concerns the ability to buy imports priced in foreign currency, repay external debt or compare internationally traded financial values, market-exchange-rate measures may be more relevant. If the question concerns the average purchasing power of national income within an economy, PPP measures are often more informative. The key is to match the indicator to the economic question rather than treating one conversion method as universally superior.
How wide is the latest-available distribution?
The median across 202 economies is $20,185 in current international dollars. The first quartile is $7,832 and the third quartile is $48,832, so the middle half of observations falls roughly within that range. The mean is higher at $31,374, reflecting a long upper tail created by a relatively small group of economies with very high values. For describing a typical observation, the median is therefore more informative than the mean on its own.
There are 35 economies below $5,000, 27 between $5,000 and $10,000, 38 between $10,000 and $20,000, 41 between $20,000 and $40,000, and 36 between $40,000 and $70,000. Another 17 are between $70,000 and $100,000, while eight exceed $100,000. The map shows high-value clusters in parts of Europe, North America, the Gulf and several high-income Asian economies, while many economies in Sub-Saharan Africa fall into lower bands. Those patterns describe purchasing-power-adjusted average national income, not a direct ranking of household welfare.
Economies with the highest latest values
The top ten are Singapore, Qatar, Macao SAR, Bermuda, Norway, Luxembourg, Ireland, Switzerland, Brunei Darussalam and the United States. Eight economies exceed $100,000. Several are relatively small economies, which is a reminder that a per-capita measure is different from total economic size. A country does not need to have one of the world’s largest GDP totals to record a high income value per resident.
| Economy | Observation year | GNI per capita, PPP |
|---|---|---|
| Singapore | 2025 | $135,750 |
| Qatar | 2025 | $126,290 |
| Macao SAR, China | 2024 | $125,630 |
| Bermuda | 2024 | $122,530 |
| Norway | 2025 | $107,770 |
| Luxembourg | 2025 | $106,640 |
| Ireland | 2025 | $106,310 |
| Switzerland | 2025 | $101,690 |
| Brunei Darussalam | 2025 | $95,420 |
| United States | 2025 | $89,490 |
Observation year matters even near the top. Macao SAR and Bermuda use 2024 values, while most of the other top entries use 2025 observations. Singapore’s $135,750 and Qatar’s $126,290 are national-account averages expressed in international dollars; they do not mean that every resident earns that amount. Household income distributions, labor earnings and disposable income need separate datasets.
How to interpret the lowest observations
The lowest values include South Sudan, Burundi, the Central African Republic, Mozambique, Somalia, Eritrea, Liberia, the Democratic Republic of the Congo, Malawi and Madagascar. South Sudan’s $1,010 observation is from 2015, Eritrea’s is from 2011, and Yemen’s value is from 2013. These older observations should not be described as precise measurements of conditions in 2025. They are simply the most recent non-empty values available for those economies in this indicator series.
A low GNI per capita at PPP indicates a low average national-income level after purchasing-power adjustment, but it does not directly measure poverty incidence, inequality or the quality of public services. It can provide context for development conditions, yet it should be paired with poverty, health, education, employment and distributional indicators when the question concerns how people actually live.
The timing issue in a latest-available map
Most of the dataset is recent: 181 of the 202 economies use 2025 values and another 14 use 2024. Only 7 observations are from 2023 or earlier, with the oldest dating to 2007. That makes the map reasonably current for most economies, but not perfectly comparable in time. A strict same-year analysis would either exclude economies without data for the target year or use a different method to handle gaps.
Using latest available values has a practical advantage: it preserves broad geographic coverage instead of dropping economies with reporting lags. The trade-off is that economic conditions, population, price levels and PPP estimates are drawn from different years for a small subset. For trend analysis, a time series with consistent yearly observations is preferable. This page focuses on the level of the latest available observation, not on growth over time.
Why GNI per capita can differ from GDP per capita
GDP measures production within an economy’s territory. GNI starts from domestic production but adjusts for primary income received from and paid to the rest of the world, shifting the perspective toward income accruing to residents. Cross-border investment income, compensation of employees and multinational corporate income flows can therefore cause GNI and GDP to diverge. This is why a GDP-per-capita ranking and a GNI-per-capita ranking do not have to be identical.
PPP adds another layer of distinction because it adjusts for price levels. “GDP per capita, current US$,” “GNI per capita, current US$,” and “GNI per capita, PPP, current international $” may look similar in a search result, but they answer different questions. The indicator used here is NY.GNP.PCAP.PP.CD. Checking the indicator code and unit is the safest way to avoid comparing numbers that were constructed differently.
What “current international dollars” means
The word “current” indicates a current-price PPP series rather than a constant-price series fixed to one base year. Values from different years therefore reflect changes in prices and PPP conversion factors as well as changes in nominal income. They should not be read as a direct measure of real growth through time. If the goal is to compare real income growth, a constant-price PPP series or a growth-rate indicator is more appropriate.
For a cross-sectional snapshot, current international dollars are intuitive because they express purchasing-power-adjusted income levels in a common unit. A value near $20,000 and one near $60,000 represent a large difference in average national income capacity after PPP adjustment. However, small differences in rank should not be overinterpreted because measurement methods, revisions, national accounts and PPP estimates all contain statistical uncertainty.
What the world map can and cannot show
A world-scale polygon map cannot display every small island or territory clearly. Economies such as Singapore, Macao SAR and Bermuda can have valid statistical observations even when they are tiny or absent as separate polygons in a low-resolution world boundary layer. The table and country-level values are the reference for exact figures; the map is best used to see broad spatial patterns.
The color classes also group a range of values together. Two economies in the same $40,000–$70,000 band can still differ substantially. The map is therefore a visual summary rather than a substitute for the numeric data. It is most useful for seeing where clusters of high and low purchasing-power-adjusted income appear, while tables are better for close comparisons between individual economies.
What this indicator can tell you—and what it cannot
GNI per capita at PPP is a useful benchmark for comparing the average scale of national income after accounting for price-level differences. It can help place an economy within the global distribution and provide context for development, consumption capacity and living-standard analysis. Because it is a national average, however, it does not describe inequality, wealth, housing affordability, working hours, health outcomes, education quality or environmental conditions.
The level of income is also different from the rate of change. A high-income economy is not necessarily growing quickly, and a lower-income economy is not necessarily stagnant. To study momentum, analysts need time-series growth measures. To study household welfare, they need household surveys and distributional statistics. The latest-value comparison here answers a narrower question: what is the most recent purchasing-power-adjusted GNI per person available for each economy?
A practical checklist for reading the values
First, confirm that the unit is current international dollars. Second, check the observation year for the economy you are comparing. Third, remember that the median is much lower than the mean because the distribution has a long upper tail. Fourth, do not confuse a per-capita value with total economic size. Fifth, keep GNI distinct from GDP and PPP conversion distinct from market-exchange-rate conversion. These checks prevent most common interpretation errors.
Across the 202 latest observations, the median is $20,185 and the maximum is Singapore at $135,750. The gap is large, but the definition and timing matter as much as the headline numbers. Most observations are from 2025, some are from 2024, and a small set is older. Used carefully, the indicator provides a clear view of global differences in purchasing-power-adjusted average national income without pretending to summarize every dimension of living standards.
Frequently Asked Questions
Which economy has the highest latest GNI per capita at PPP?
Singapore has the highest latest available value at $135,750 in current international dollars, followed by Qatar at $126,290. Observation years can differ by economy.
Is a PPP international dollar the same as a US dollar at the market exchange rate?
No. An international dollar is a purchasing-power comparison unit that adjusts for differences in price levels. It is not the amount that can necessarily be converted into US dollars at the market exchange rate.
Are all 202 observations from 2025?
No. 181 economies use 2025 values, 14 use 2024, and the remaining 7 use their latest available observation from 2007 through 2023.
Related Articles
Green Map creates custom-edited map images using open geographic data sources such as geoBoundaries, Natural Earth, OpenStreetMap, and government open data.
These maps are edited visual materials, not raw data files, and are provided for education, documents, presentations, and graphic reference.