Twin Falls County stretches a long way south from the Snake River corridor to the Nevada state line. Most of the labeled cities sit near the northern edge: Twin Falls is the largest center on the map, with Buhl and Filer to the west and Kimberly and Hansen to the east. US 93 then runs south through Hollister and continues toward the bottom of the county. That contrast between a busy northern strip and a much broader southern interior is the easiest way to understand the county at first glance.
The maps on this page separate the county into four useful views without turning the article into a list of map types. The general map is best for boundaries, roads, and place names; the city view simplifies the distribution of the main population centers; the terrain-and-water map highlights the Snake River, creeks, canals, and reservoirs; and the elevation map shows how the broad northern plain gives way to higher country farther south. High-resolution JPG versions of the same maps are also available together in the ZIP download box below.
Twin Falls County’s own planning document describes the county as bounded by the Snake River Canyon on the north and the Idaho–Nevada line on the south. It also explains how irrigation infrastructure helped turn the northern part of the region into productive farmland and supported the growth of communities associated with the Magic Valley. Those county-specific details help explain why roads and cities are clustered so differently from the large southern half of the map.
Table of Contents
Northern cities along the Snake River side of the county
The general county map places Twin Falls near the center of the populated northern band. Filer and Buhl lie to the west, while Kimberly and Hansen lie to the east. Murtaugh appears farther east near the narrow extension of the county boundary. Compared with the county’s full north-to-south length, these communities occupy a relatively compact area. The lower half of the map has far fewer town labels and much more open terrain crossed by streams and a small number of major roads.
Several highways make the northern arrangement easier to follow. Highway 30 provides an east-west reference through the populated area, while US 93 turns south from the Twin Falls area and runs deep into the county. Highway 74 and Highway 50 also appear in the northern section. Outside the county line, the map labels Jerome, Wendell, Gooding, Bliss, and Shoshone, which helps place Twin Falls County within the larger south-central Idaho road network.
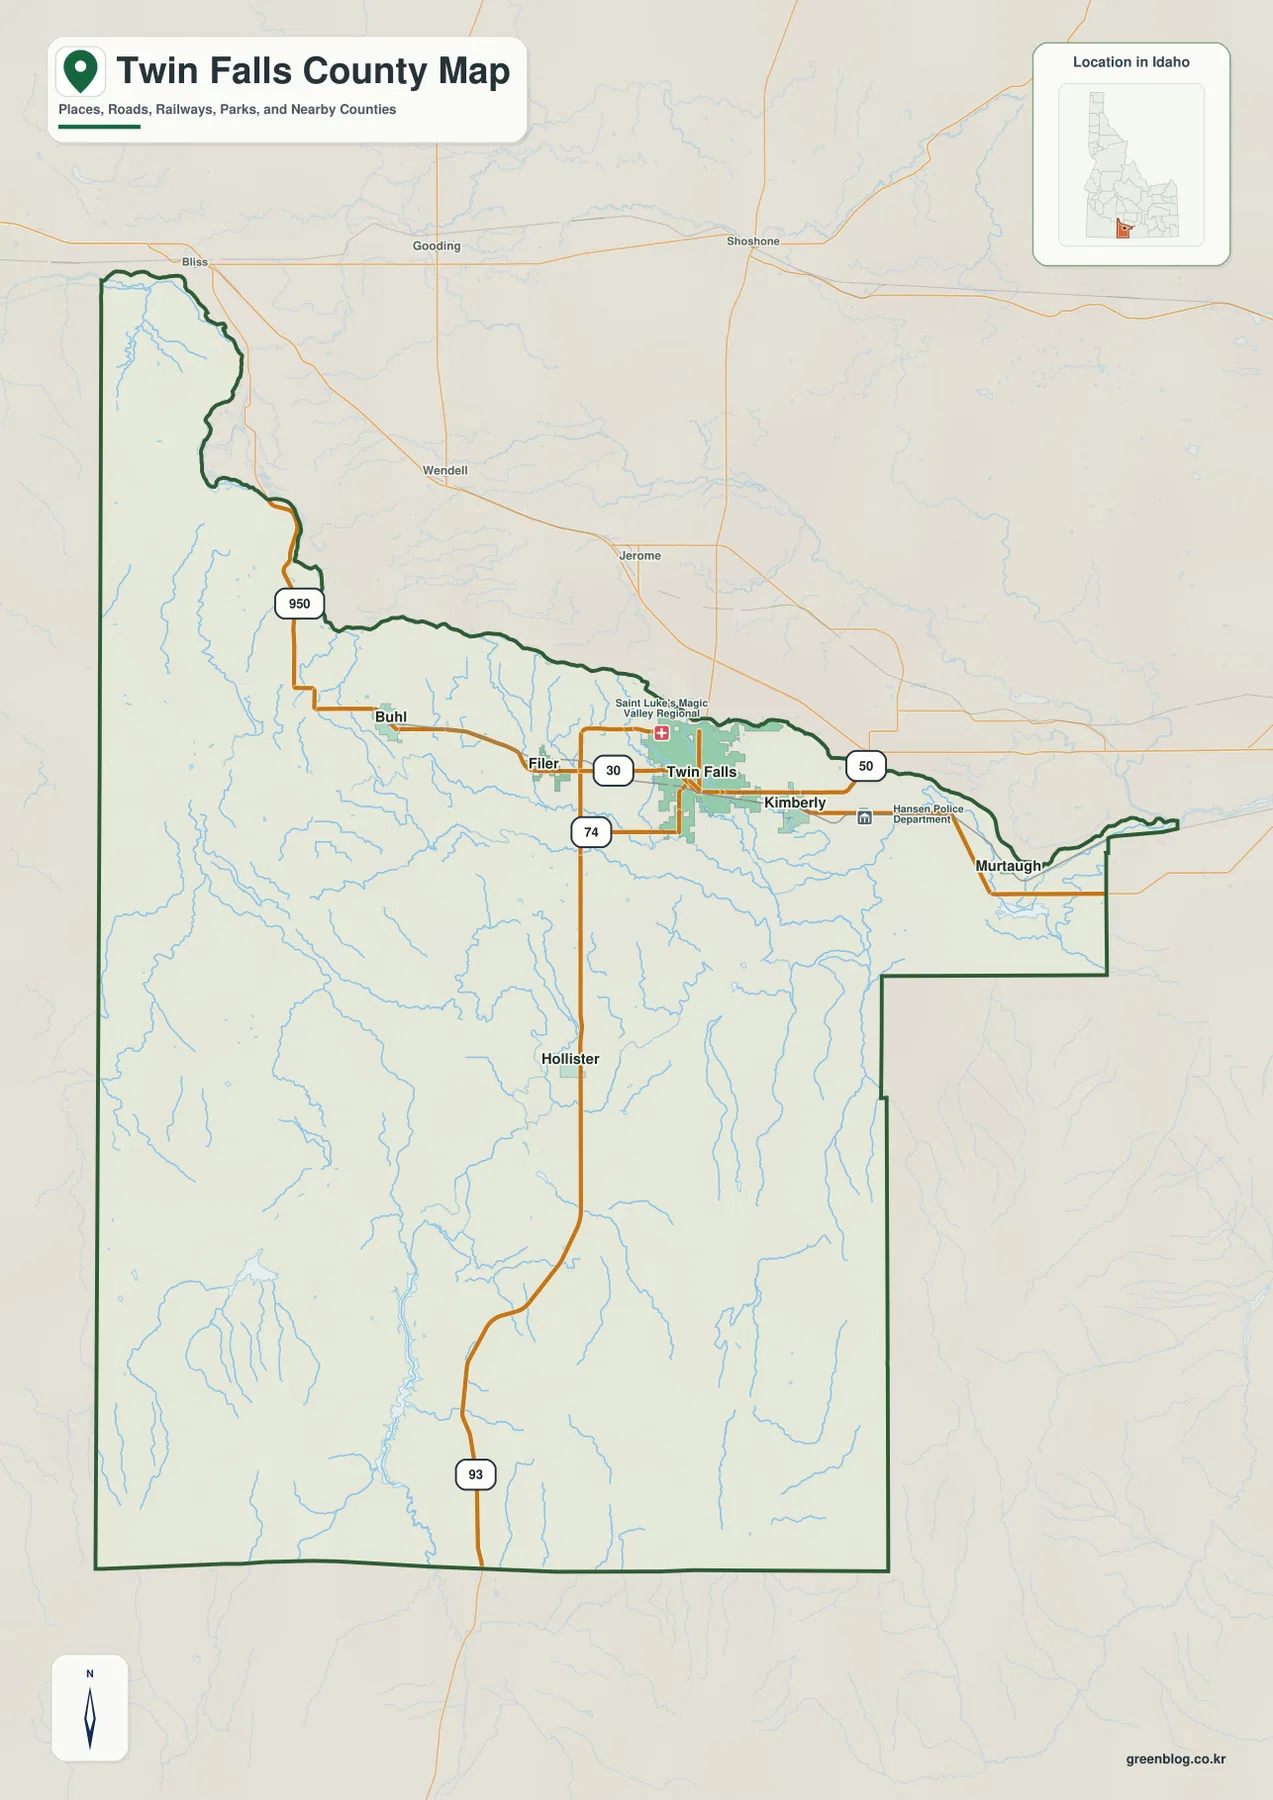
The county boundary is especially distinctive along the north, where it bends with the Snake River corridor rather than forming a simple straight line. Farther south, the outline becomes broader and more rectangular, with a large southeastern step in the boundary. This map is useful for orientation, but it is not a parcel map, a legal survey, or a live navigation product. Use it to understand how places and major routes fit inside the county, then consult current road or property sources for decisions that require exact information.
US 93 provides the clearest north–south reference
If you need one feature to keep your bearings, follow US 93. Starting near Twin Falls, the route heads south through Hollister and continues almost to the Nevada line. It cuts across a part of the county where city labels become sparse, so the road also makes the county’s unusual length much easier to appreciate. A reader who only looks at the Twin Falls urban area can easily miss how much land lies farther south.
The road is also useful when comparing the other maps. On the water map, streams and reservoirs occupy the country on both sides of this north-south corridor. On the elevation map, the terrain generally becomes higher and more rugged toward the southern edges. The maps do not provide current driving conditions, closures, or travel times, so a live transportation source is still necessary for an actual trip.
The city index makes the northern cluster obvious
The city map removes much of the road detail and labels six ranked places: Twin Falls, Kimberly, Buhl, Filer, Hansen, and Hollister. Twin Falls is marked first, Kimberly second, Buhl third, Filer fourth, Hansen fifth, and Hollister sixth. The numbers printed in the index should not be treated here as a current population table because the map itself does not establish that they represent today’s latest estimates. The useful information is the relative placement of the cities.
Twin Falls sits near the middle of the northern group. Buhl and Filer are to the west, while Kimberly and Hansen are to the east. Hollister is the outlier, positioned well south of the other five along the US 93 corridor. That simple arrangement makes the city map a good companion to the more detailed county map: it shows immediately that the county’s main urban places do not spread evenly across its full area.
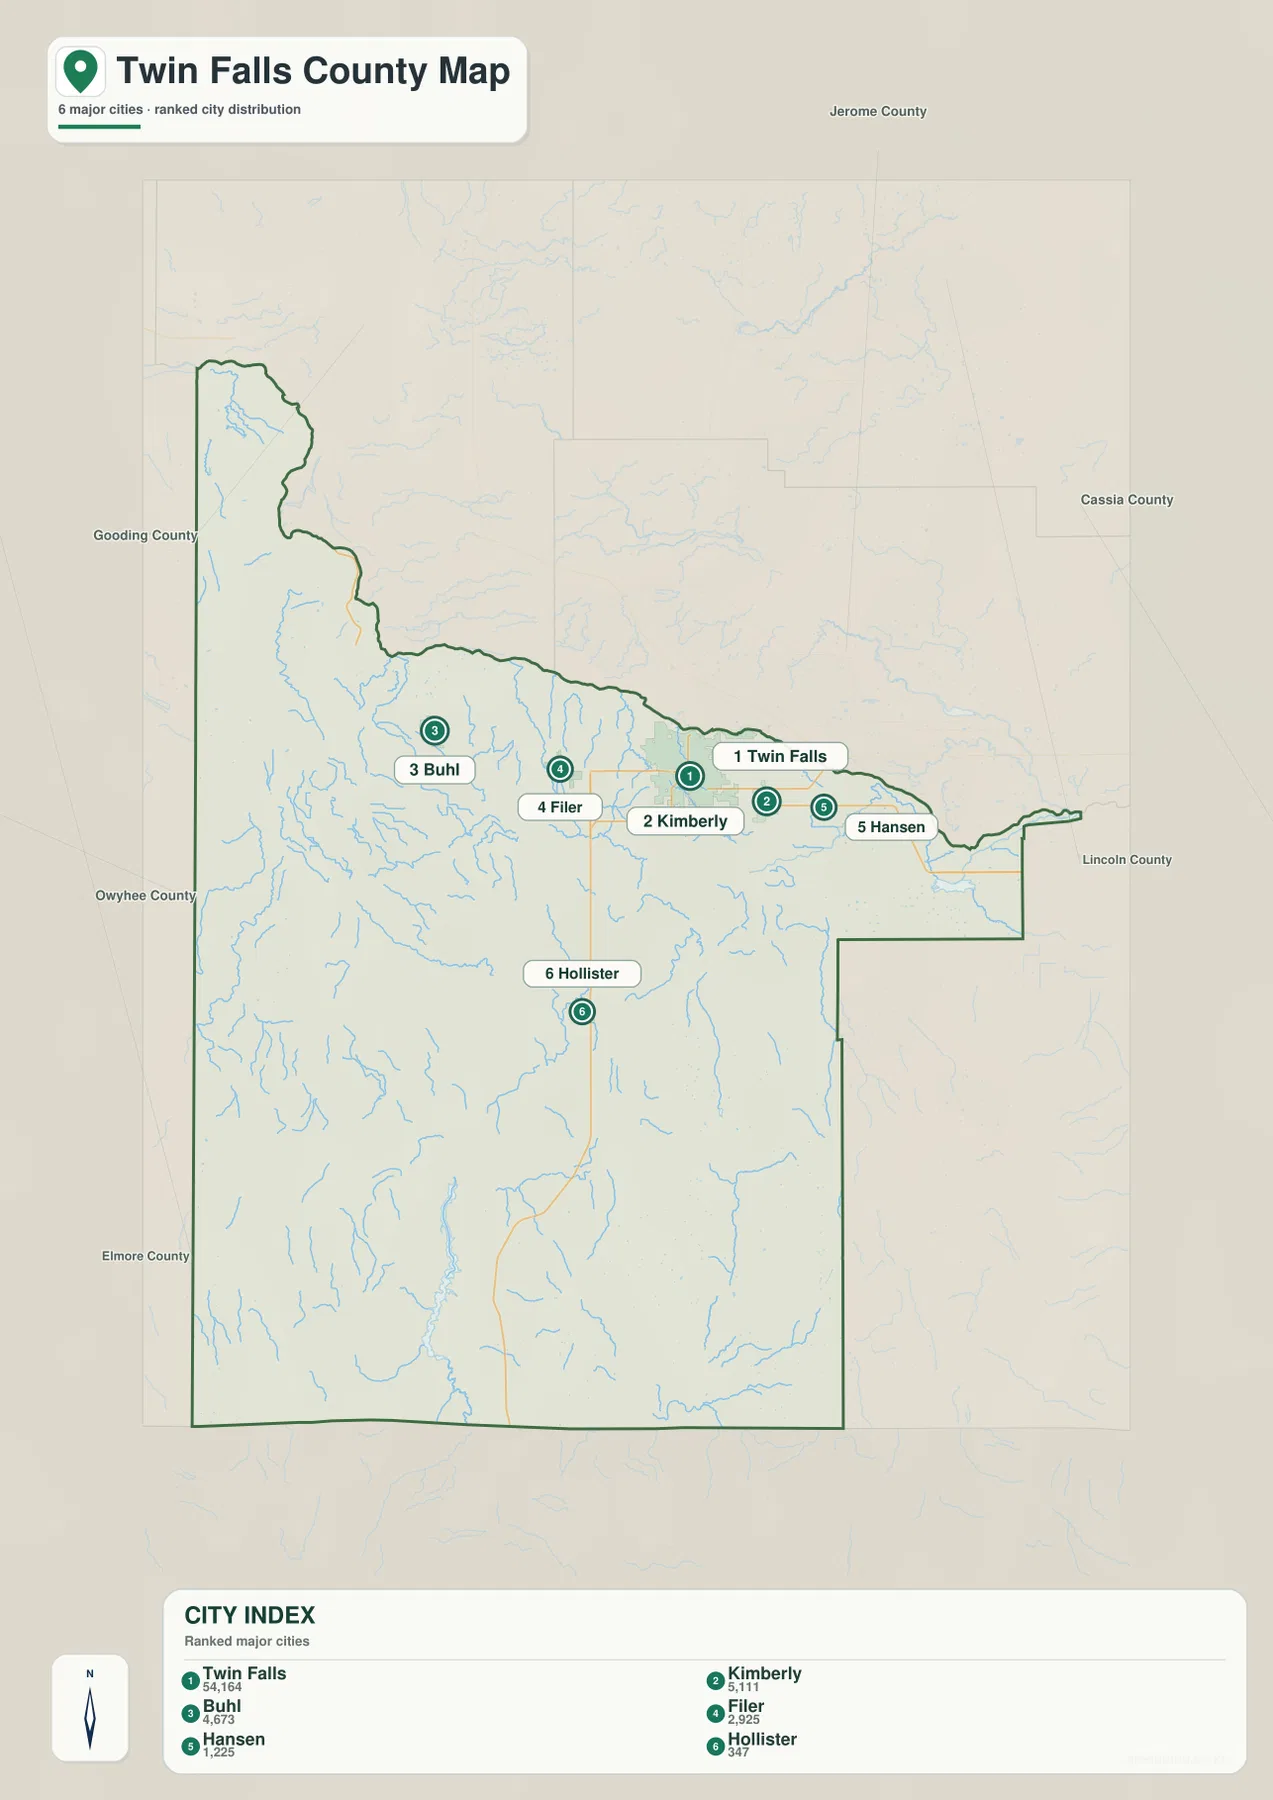
Unlike some connector maps, this city view does not label straight-line distances between the places. It is therefore best used for direction and distribution rather than mileage. For example, you can see that Buhl and Filer fall on the western side of Twin Falls and that Kimberly and Hansen fall on the eastern side, but you should use a current road map or navigation service for driving distance and travel time.
Buhl and Filer west, Kimberly and Hansen east
Dividing the northern cities into a western and an eastern group is an easy way to remember the layout. Filer lies west of Twin Falls and Buhl farther west, while Kimberly and Hansen extend eastward. The general map then adds roads and smaller place labels around this same arrangement. This is more useful than memorizing the city index by itself because it ties each place to a direction and to the county’s broader road pattern.
Hollister does not fit either group. It sits well to the south, which makes it an effective marker for the transition from the northern urban and agricultural plain into the much larger southern part of the county. Once Hollister is located, the terrain and water maps become easier to follow because many of the southern creeks and reservoirs can be understood in relation to that north-south axis.
Snake River, creeks, canals, and southern reservoirs
The terrain-and-water map changes the emphasis completely. The Snake River follows the northern side of the county and is the most prominent water feature. South of it, Rock Creek is labeled near the Twin Falls area, while Salmon Falls Creek forms a long drainage farther west. The High Line Canal is also identified in the western-northern portion, providing a visible reminder that managed irrigation water is part of the county’s landscape as well as natural streams.
Farther south, the map labels several reservoirs. Salmon Falls Creek Reservoir is the largest and easiest to find in the southwest. Cedar Mesa Reservoir and Cedar Creek Reservoir appear farther north on the western side, while Deep Creek Reservoir and Williams Reservoir are shown closer to the south-central and southeastern area. Murtaugh Lake appears near the eastern edge closer to the Snake River. These features make the southern half of the county much more detailed than it first appears on the city map.
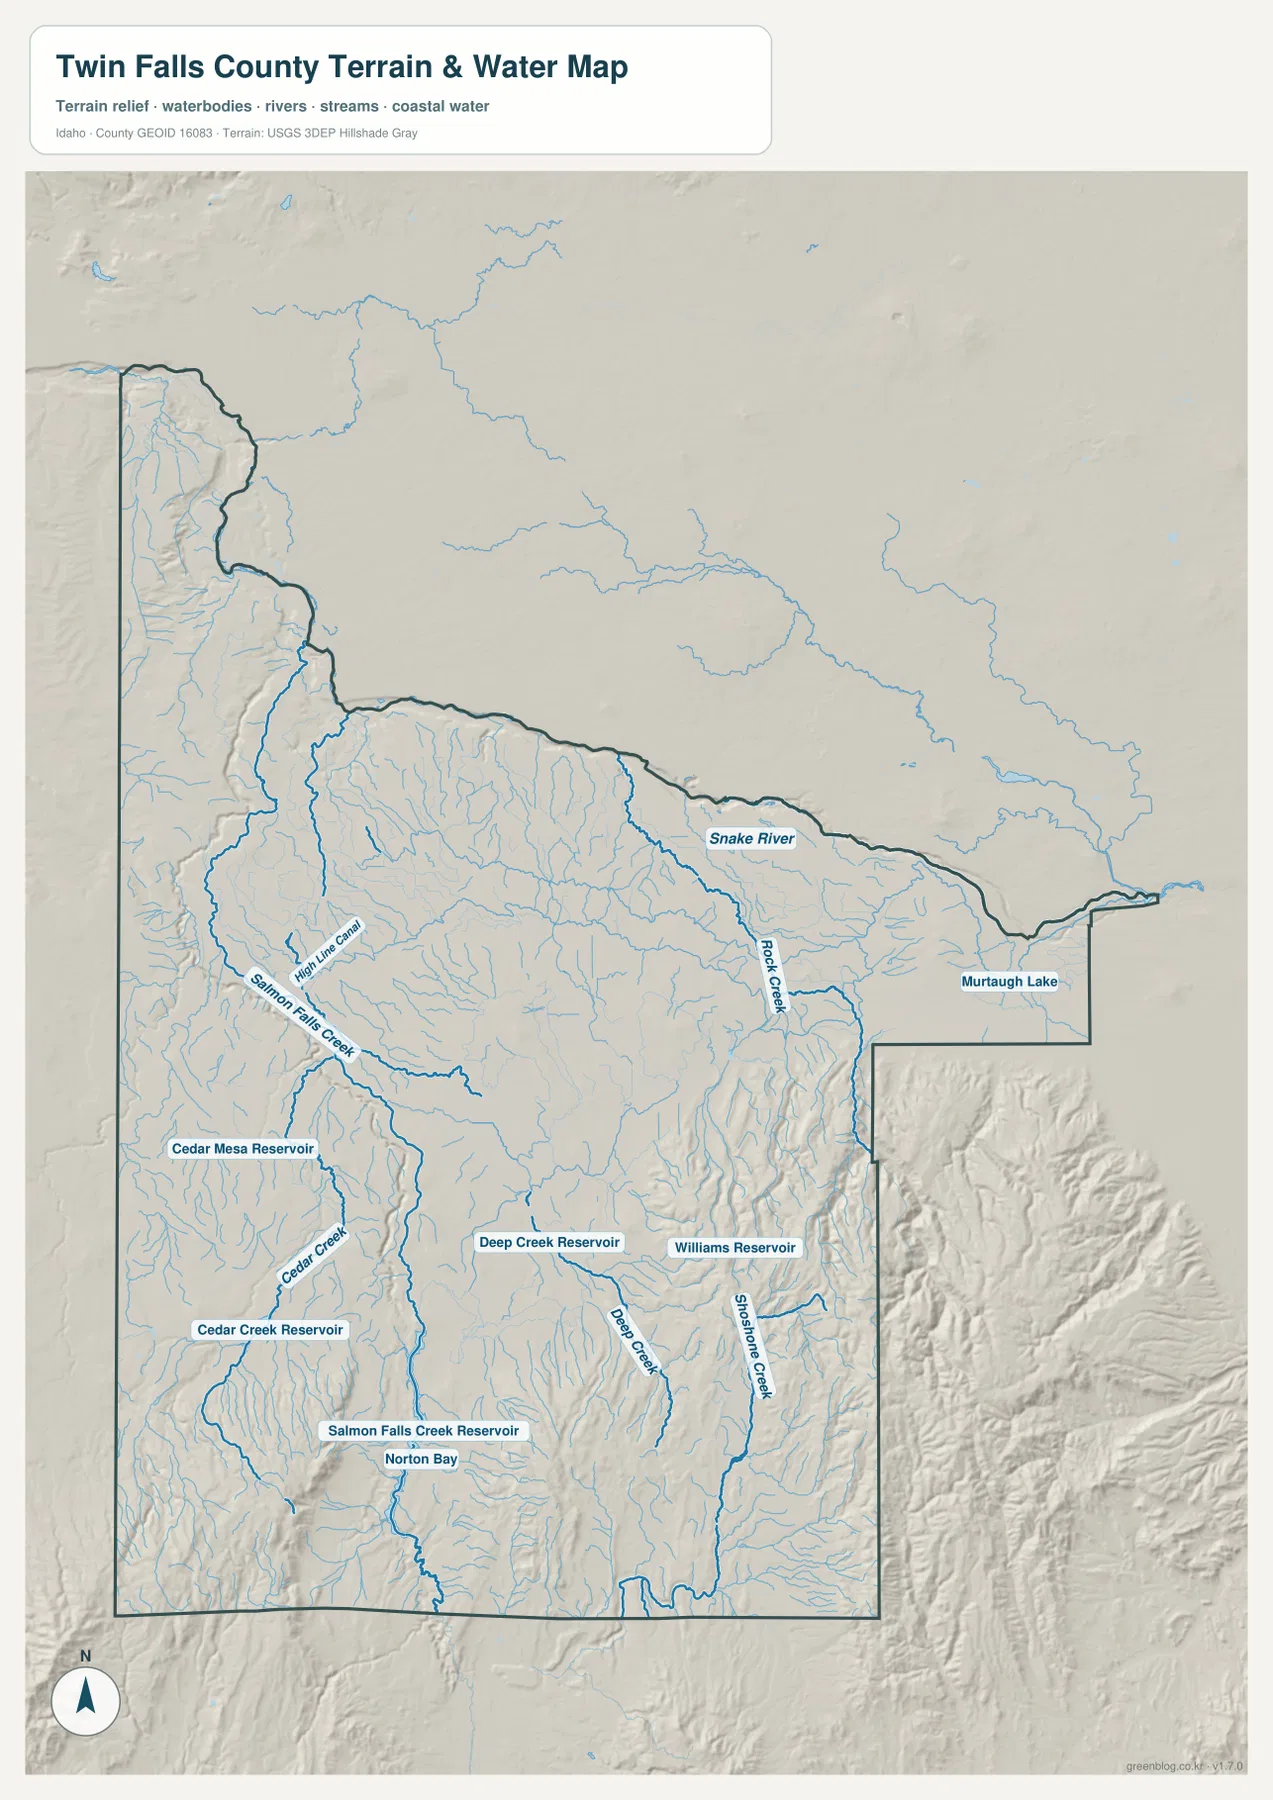
The shaded relief underneath the blue water lines is just as helpful as the labels. Rock Creek, Deep Creek, Shoshone Creek, Cedar Creek, and Salmon Falls Creek follow low corridors through more uneven terrain. The map is designed to show where those waterways and landforms sit relative to each other. It is not a floodplain map, a boating chart, a water-rights document, or a source for current stream conditions.
Start with Salmon Falls Creek Reservoir in the southwest
Salmon Falls Creek Reservoir is a useful anchor when the southern water map feels crowded. It sits near the lower-left portion of the county, with Salmon Falls Creek running northward from the reservoir system. Cedar Creek and its reservoirs lie farther north and west, while Deep Creek Reservoir and Williams Reservoir lie to the east. Locating these larger features first makes the smaller tributaries easier to place.
The same approach helps when comparing the water map with the general map. Find the US 93 corridor and Hollister, then look west toward Salmon Falls Creek and east toward Deep Creek and Shoshone Creek. That comparison gives the southern half of the county recognizable landmarks even though it contains far fewer city labels than the north.
Elevation rises away from the northern plain
The elevation map makes the north-south contrast even clearer. Much of the northern and central county appears in green shades, while yellows and browns become more prominent toward the south, especially in the southeastern and southwestern high country. The county’s actual elevation range printed on the map is about 810 to 2,385 meters, with a mean elevation of about 1,462 meters.
Those numbers summarize the county as a whole; they are not the elevations of Twin Falls, Hollister, or any other specific location. The useful message is the broad difference between the lower northern plain and the higher, more broken terrain near the southern edges. That pattern also helps explain why the city map looks so concentrated near the north while the southern half is dominated by creeks, reservoirs, and relief rather than dense settlement labels.
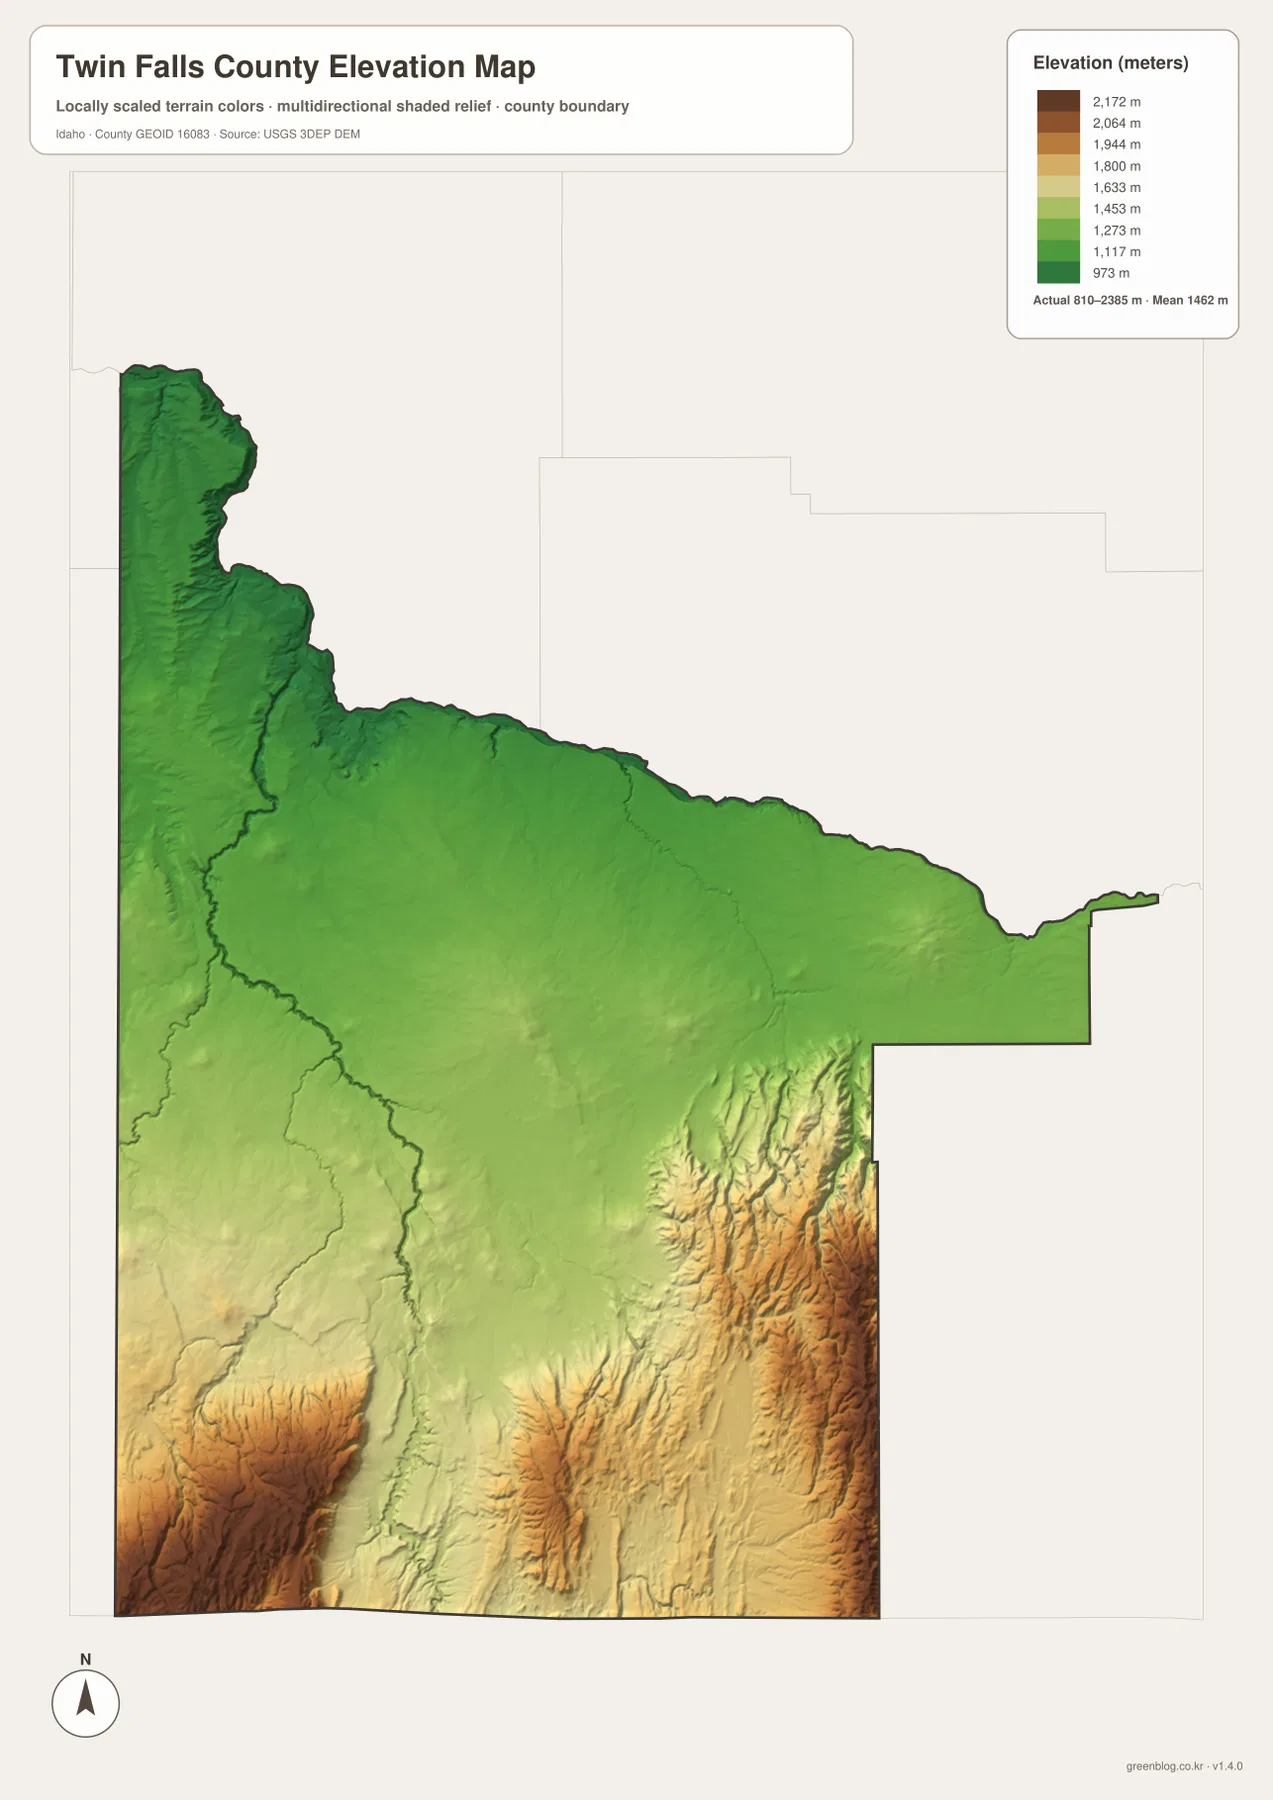
Comparing this image with the general map is especially useful. The northern cities occupy a relatively low, broad part of the county, while US 93 continues into terrain that becomes progressively more varied farther south. On the water map, many creeks follow valleys through this higher ground. The three views therefore reinforce one another without needing to place every road, stream, and elevation value on a single crowded map.
Use the colors for regional relief, not site surveying
The elevation colors are generalized across a continuous surface. A change from green to yellow does not mark a physical boundary where the ground suddenly changes height, and the map is not survey-grade or engineering-grade data. If you need the precise elevation of a building site, road crossing, reservoir structure, or trail point, use the original USGS elevation source at an appropriate resolution or a professional survey.
For classroom use, regional planning context, presentations, or basic geographic orientation, however, the map does its job well. It quickly shows why the county can contain a broad agricultural and urbanized north while also extending into a much rougher southern landscape. The color transition is easier to understand after you have already found Twin Falls, Hollister, and the major reservoirs on the other maps.
Choosing the right Twin Falls County map
Choose the general map when you need the county outline, major roads, nearby places, and a broad sense of settlement. Use the city map when the main question is where Twin Falls, Buhl, Filer, Kimberly, Hansen, and Hollister sit relative to one another. The terrain-and-water map is better for the Snake River, Salmon Falls Creek, Rock Creek, canals, and reservoirs, while the elevation map is the clearest choice for explaining the difference between the northern plain and the higher southern country.
When using more than one map, keep one or two shared landmarks in mind. Twin Falls and US 93 work well because both are easy to find in the orientation maps. From there, compare the Snake River to the north, Hollister farther south, and Salmon Falls Creek Reservoir in the southwest. Moving between maps with the same reference points prevents the four views from feeling like unrelated graphics.
Each map also has limits. The general map is not a legal parcel map or live navigation service. The city view is not a current demographic table. The water map does not determine flood risk, navigation safety, access rights, or real-time flow conditions. The elevation map is not a substitute for a survey. Used within those limits, the set works well for printing, teaching, presentations, trip preparation, and county-level geographic reference.
Frequently Asked Questions
Why are most labeled cities in the northern part of Twin Falls County?
The supplied maps place Twin Falls, Buhl, Filer, Kimberly, and Hansen on the lower northern plain near the Snake River side of the county. The county’s official planning document also describes the importance of irrigation to agricultural development and the growth of northern communities. The city and elevation maps make this contrast easiest to see.
Does the 810–2,385 meter range give the elevation of a specific place?
No. The range printed on the map summarizes the lowest and highest values across Twin Falls County in the supplied elevation surface. It is not the exact elevation of Twin Falls, Hollister, a reservoir, a road, or an individual property. Use original elevation data or survey information when precise height is required.
Can the water map be used for flood or boating decisions?
No. It is a geographic reference showing the Snake River, major creeks, reservoirs, canals, and terrain. It does not provide flood-zone status, current water levels, depths, boating conditions, property access, or water-right information. Check the appropriate agency’s current data before making safety or legal decisions.
Map File Information
The high-resolution JPG originals for the Twin Falls County general map, city map, terrain-and-water map, and elevation map are packaged together in one ZIP file. Each image is 2,572 × 3,638 pixels, providing enough detail for large-screen viewing and A3-size printing.
- Included Files: 4 high-resolution JPG maps
- Printable Size: 2,572 × 3,638 pixels each
Related Maps
Sources and References
This article was prepared from the supplied Twin Falls County maps and the official reference sources below. For legal boundaries, live road or water conditions, and precise elevation, use the latest data from the responsible agency rather than this explanatory map set.
- Twin Falls County official website – county government and local information
- Twin Falls County Comprehensive Plan – official county context for the Snake River Canyon, Nevada boundary, irrigation, and settlement history
- U.S. Census Bureau TIGER/Line Shapefiles – county boundary and geographic reference data
- USGS National Hydrography – reference data for rivers, streams, lakes, and reservoirs
- USGS 3D Elevation Program – national elevation and terrain data
Green Map creates custom-edited map images using open geographic data sources such as geoBoundaries, Natural Earth, OpenStreetMap, and government open data.
These maps are edited visual materials, not raw data files, and are provided for education, documents, presentations, and graphic reference.