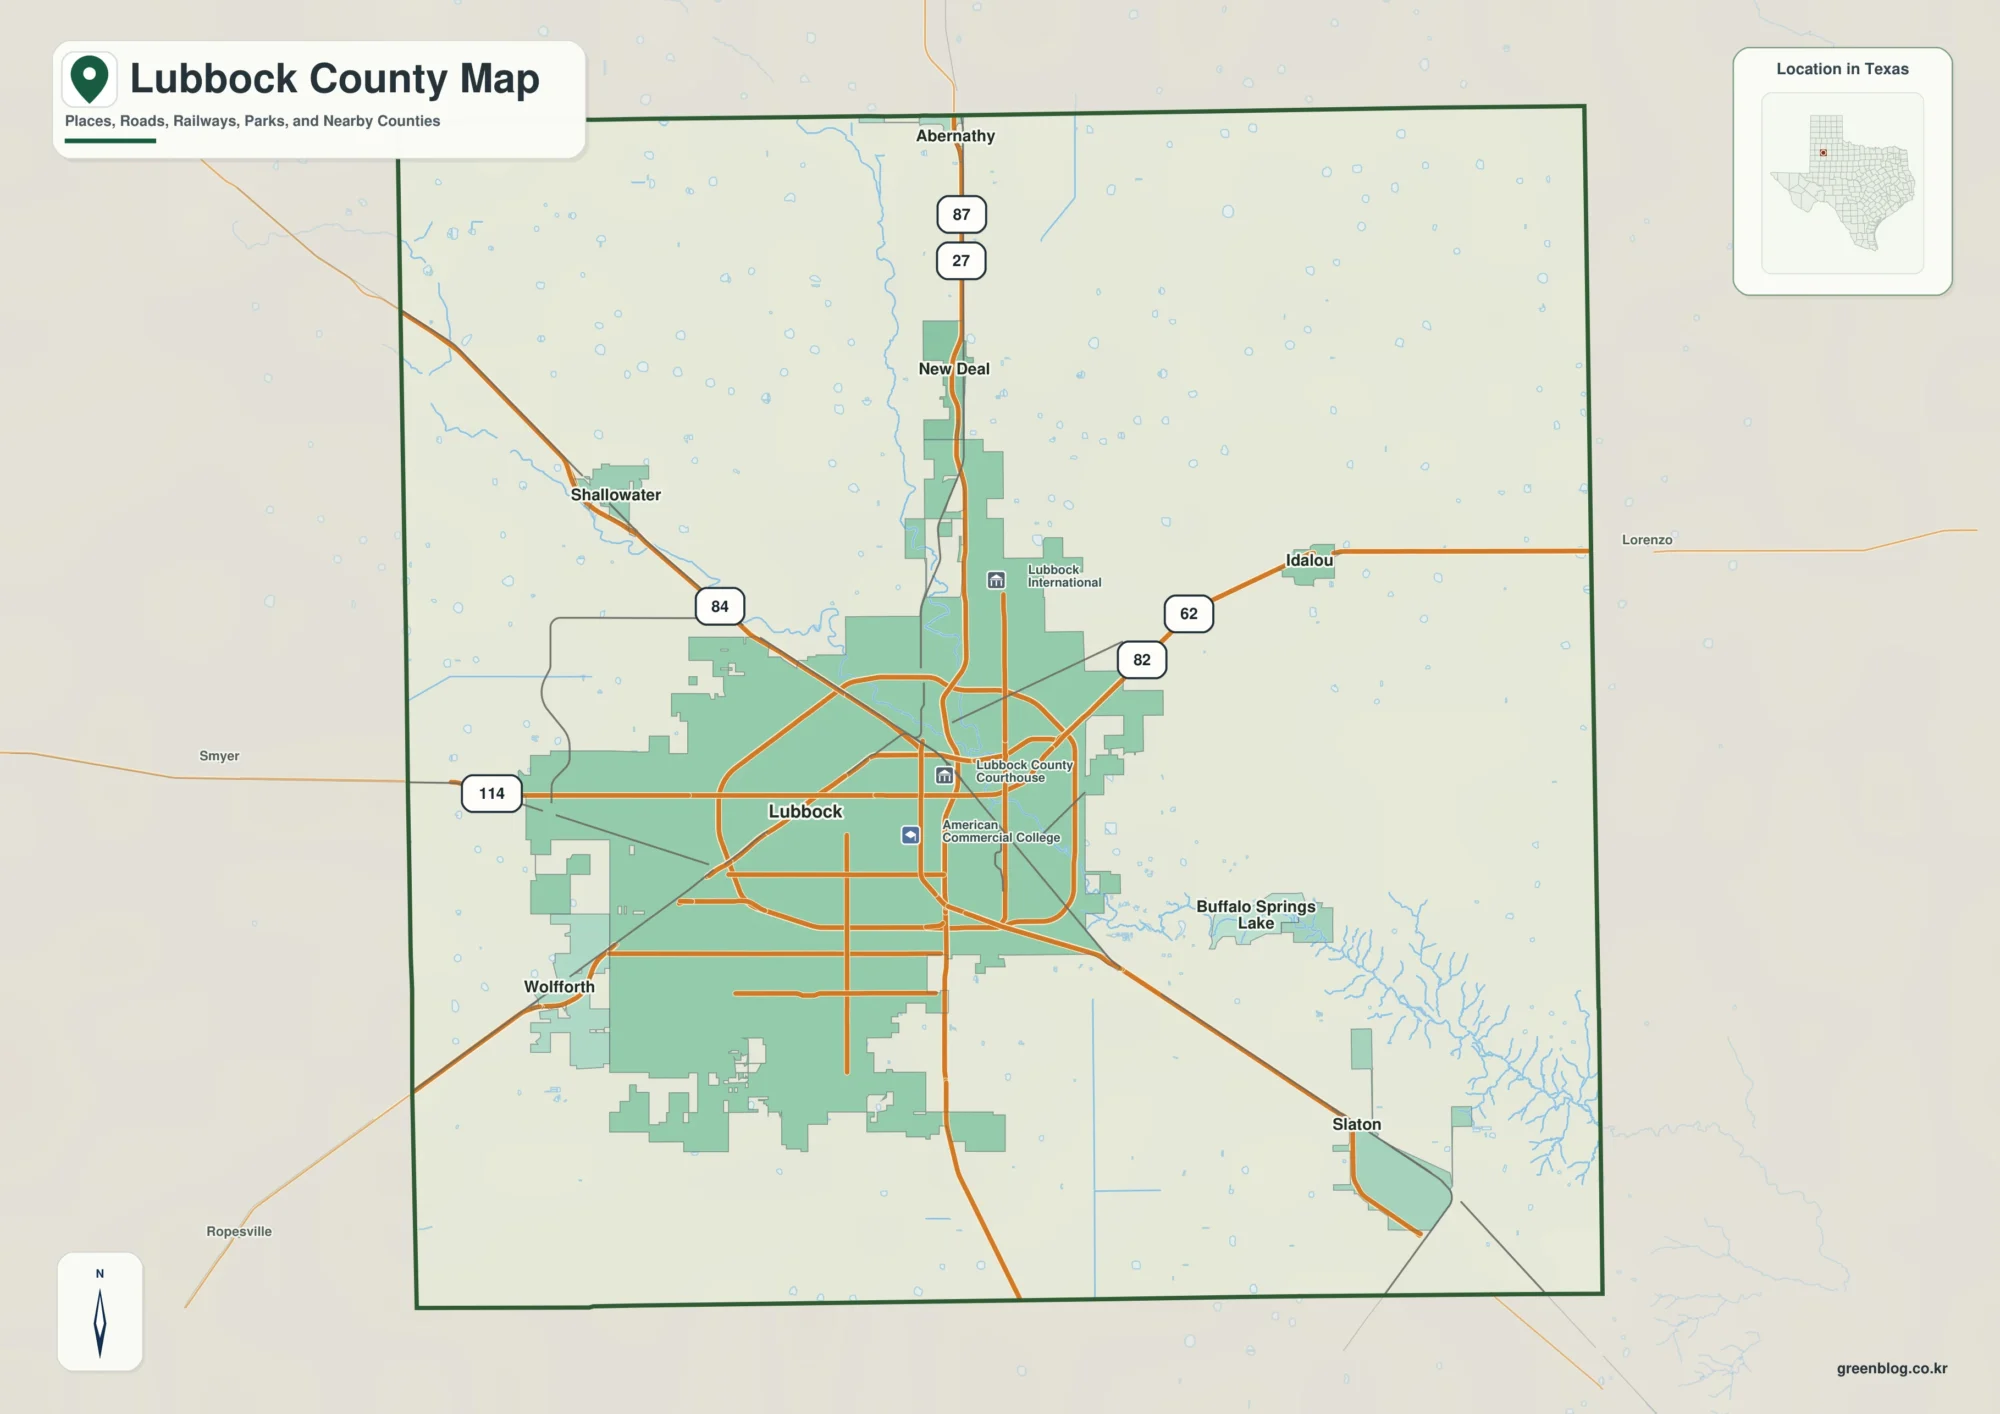
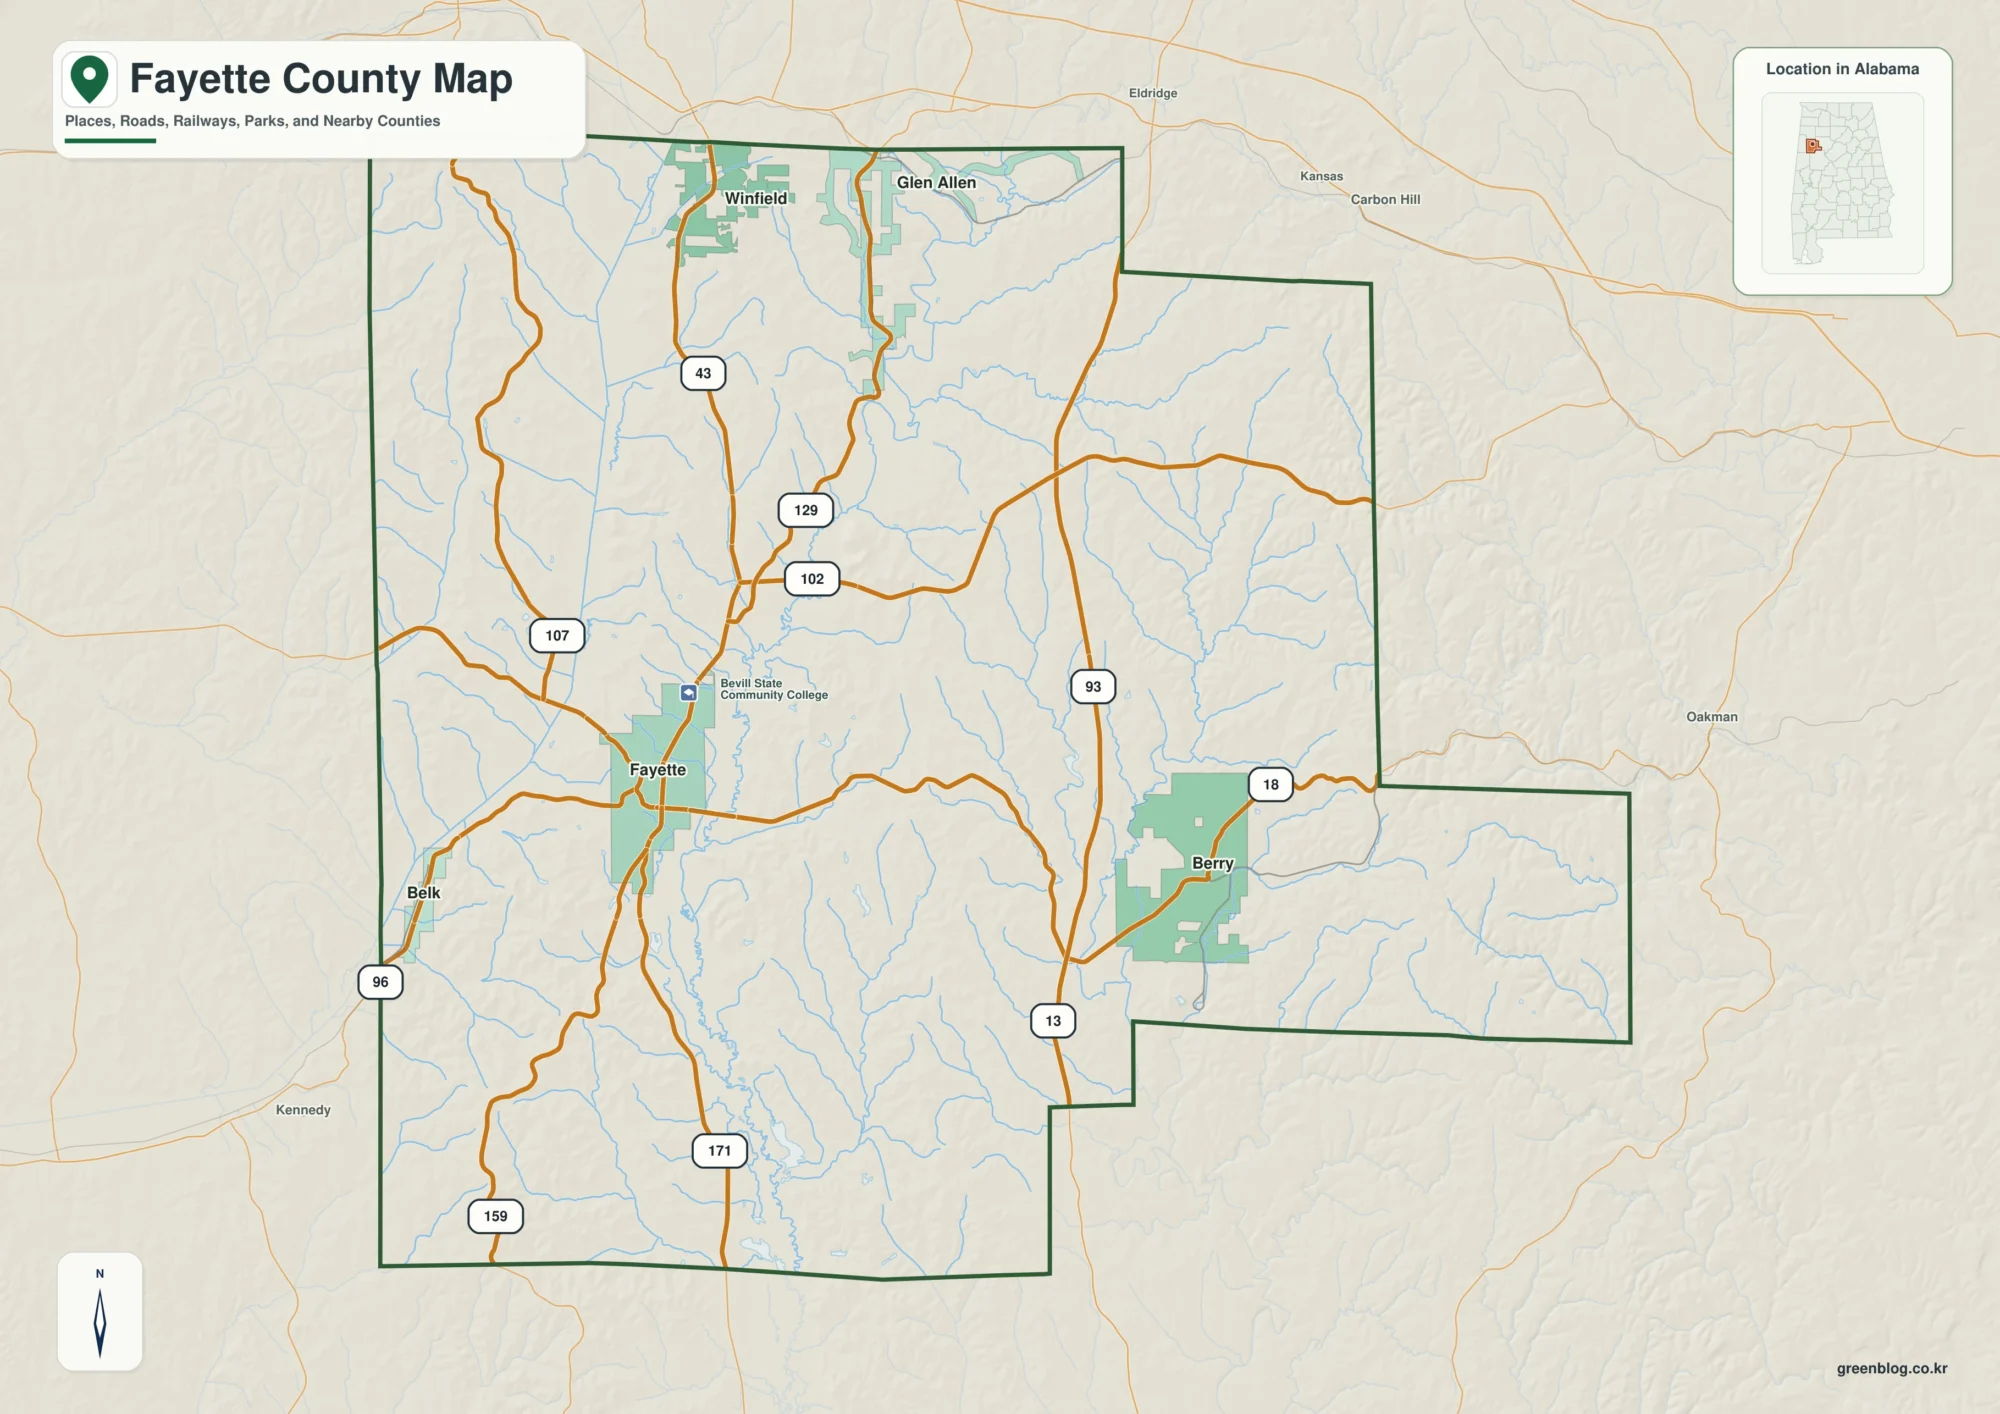
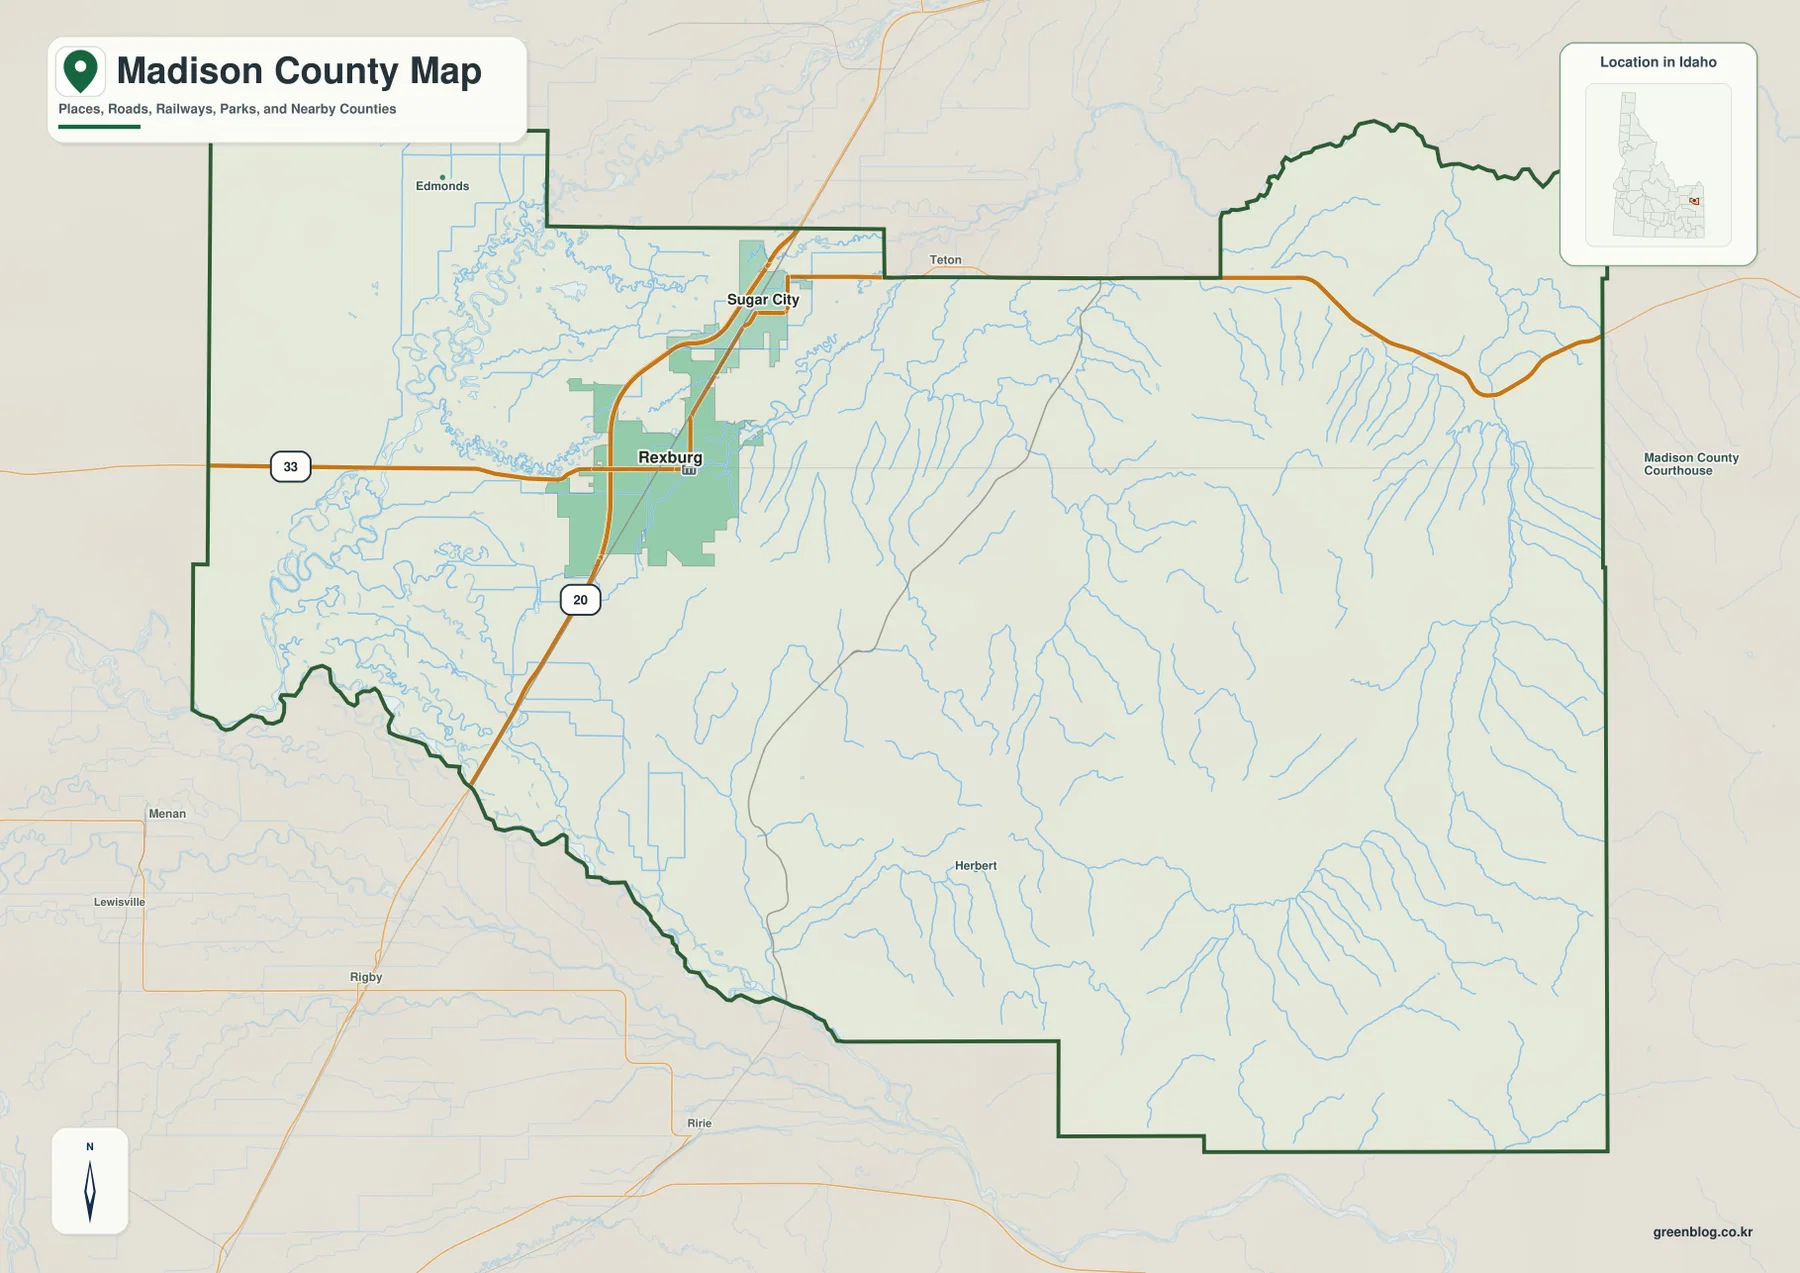
Madison County in eastern Idaho has a clear contrast between the settled western side and the broader, higher country to the east. Rexburg and Sugar City sit close together near the western half of the county, where Routes 20 and 33 provide the most visible road connections on the map. The terrain-and-water view brings out the Teton River, the Snake River, canals around Rexburg, and long creeks descending from the east. The elevation map then shows how the land rises from the lower western plain toward much higher ground along the eastern and southeastern sides. This page explains only the features shown in the supplied maps, and the same maps are available as high-resolution JPG files in the download ZIP.
Rexburg is the main labeled urban area on the general county map, with Sugar City just to its north. Much of the county east of these two places has no major city label, but it contains a dense network of streams and valleys. The city map also places Fremont County to the north, Teton County to the east, Jefferson County to the west, and Bonneville County to the southwest. Those surrounding labels make it easier to understand the county’s position before looking at the road, water, and elevation details.
The WebP images in the article are sized for quick viewing on the page. The download archive contains the original JPG versions of the county map, city map, terrain-and-water map, and elevation map, each at 3638×2572 pixels. The larger files are more useful when you want to zoom in on small road or water labels. These maps are not parcel surveys, legal road-boundary documents, flood-hazard maps, real-time traffic maps, or substitutes for site-specific elevation surveys, so official source data should be consulted for those purposes.
Table of Contents
Rexburg and Sugar City anchor the western road network
The general county map is easiest to enter through Rexburg. Route 33 crosses the western part of the county through the Rexburg area, while Route 20 approaches from the south and continues north toward Sugar City. The built-up area around Rexburg is noticeably larger than the other urban patches shown on the map. Sugar City sits a short distance north of Rexburg along the same north-south road corridor, giving the western side of Madison County a much more concentrated settlement pattern than the east.
Road detail becomes sparser as the map moves east from the Rexburg area. Instead of large urban labels, the eastern half is filled with branching valleys and watercourses. That visual change is one of the most useful features of the county map because it separates the flatter, more developed western area from the higher and more dissected terrain farther east. For a first look at Madison County, finding Rexburg and Sugar City and then following the county boundary eastward provides a simple way to understand its overall shape.
The boundary itself is irregular rather than rectangular. The northern edge steps in and out several times, the northeast has a raised projection, and the southern boundary changes direction in a series of bends. Jefferson and Bonneville counties provide western and southwestern reference points, Fremont County lies to the north, and Teton County is labeled along the east. The map is useful for relative county orientation, but it should not be used to determine a legal parcel or property boundary.
A two-city view makes the west-heavy settlement pattern obvious
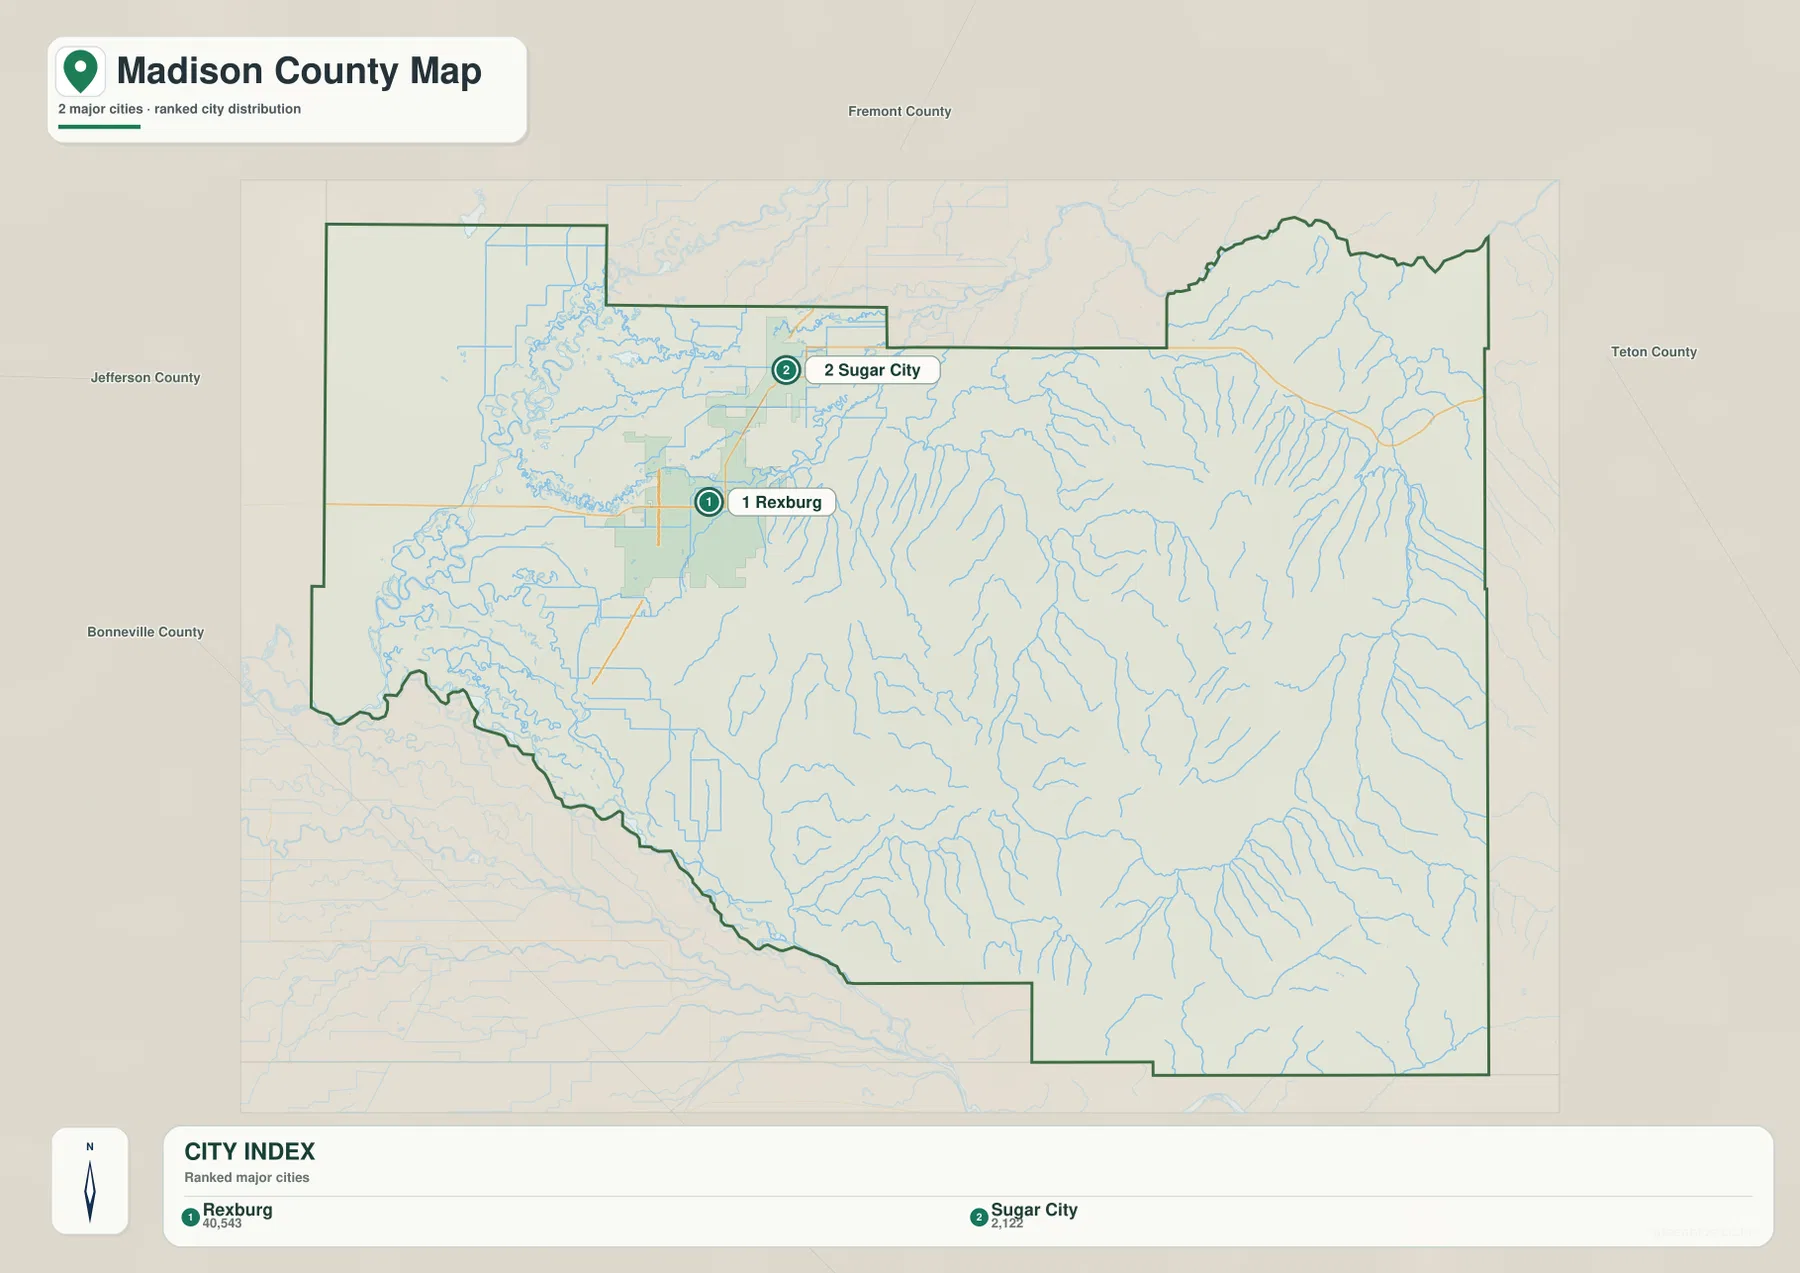
The city map strips away much of the road detail and emphasizes just two ranked major cities: Rexburg and Sugar City. Rexburg is positioned in the west-central part of the county, with Sugar City directly to the north. The large eastern portion of the county has no comparable major-city marker. That makes this view especially useful for understanding how concentrated the mapped urban pattern is, rather than treating the county as though its settlements were evenly spread from west to east.
The city index identifies Rexburg as number 1 and Sugar City as number 2. Rexburg also has the larger mapped urban footprint, while Sugar City appears as a smaller developed area along the corridor to the north. County labels outside the boundary add useful direction: Sugar City is closer to the Fremont County side, Rexburg is nearer the Jefferson County side, Bonneville County lies to the southwest, and Teton County borders the broad eastern side. Those relationships are easier to see here than on a map crowded with smaller place names.
No driving distance or travel time is printed on this city map. It should therefore be used for direction and relative position, not for estimating a road trip between the two cities. Current road routing is still needed for mileage, closures, or travel time. As an orientation tool, however, the map clearly shows that the county’s two featured cities occupy a small western portion of a much larger geographic area.
Teton River, Snake River, canals, and eastern creeks shape the water map
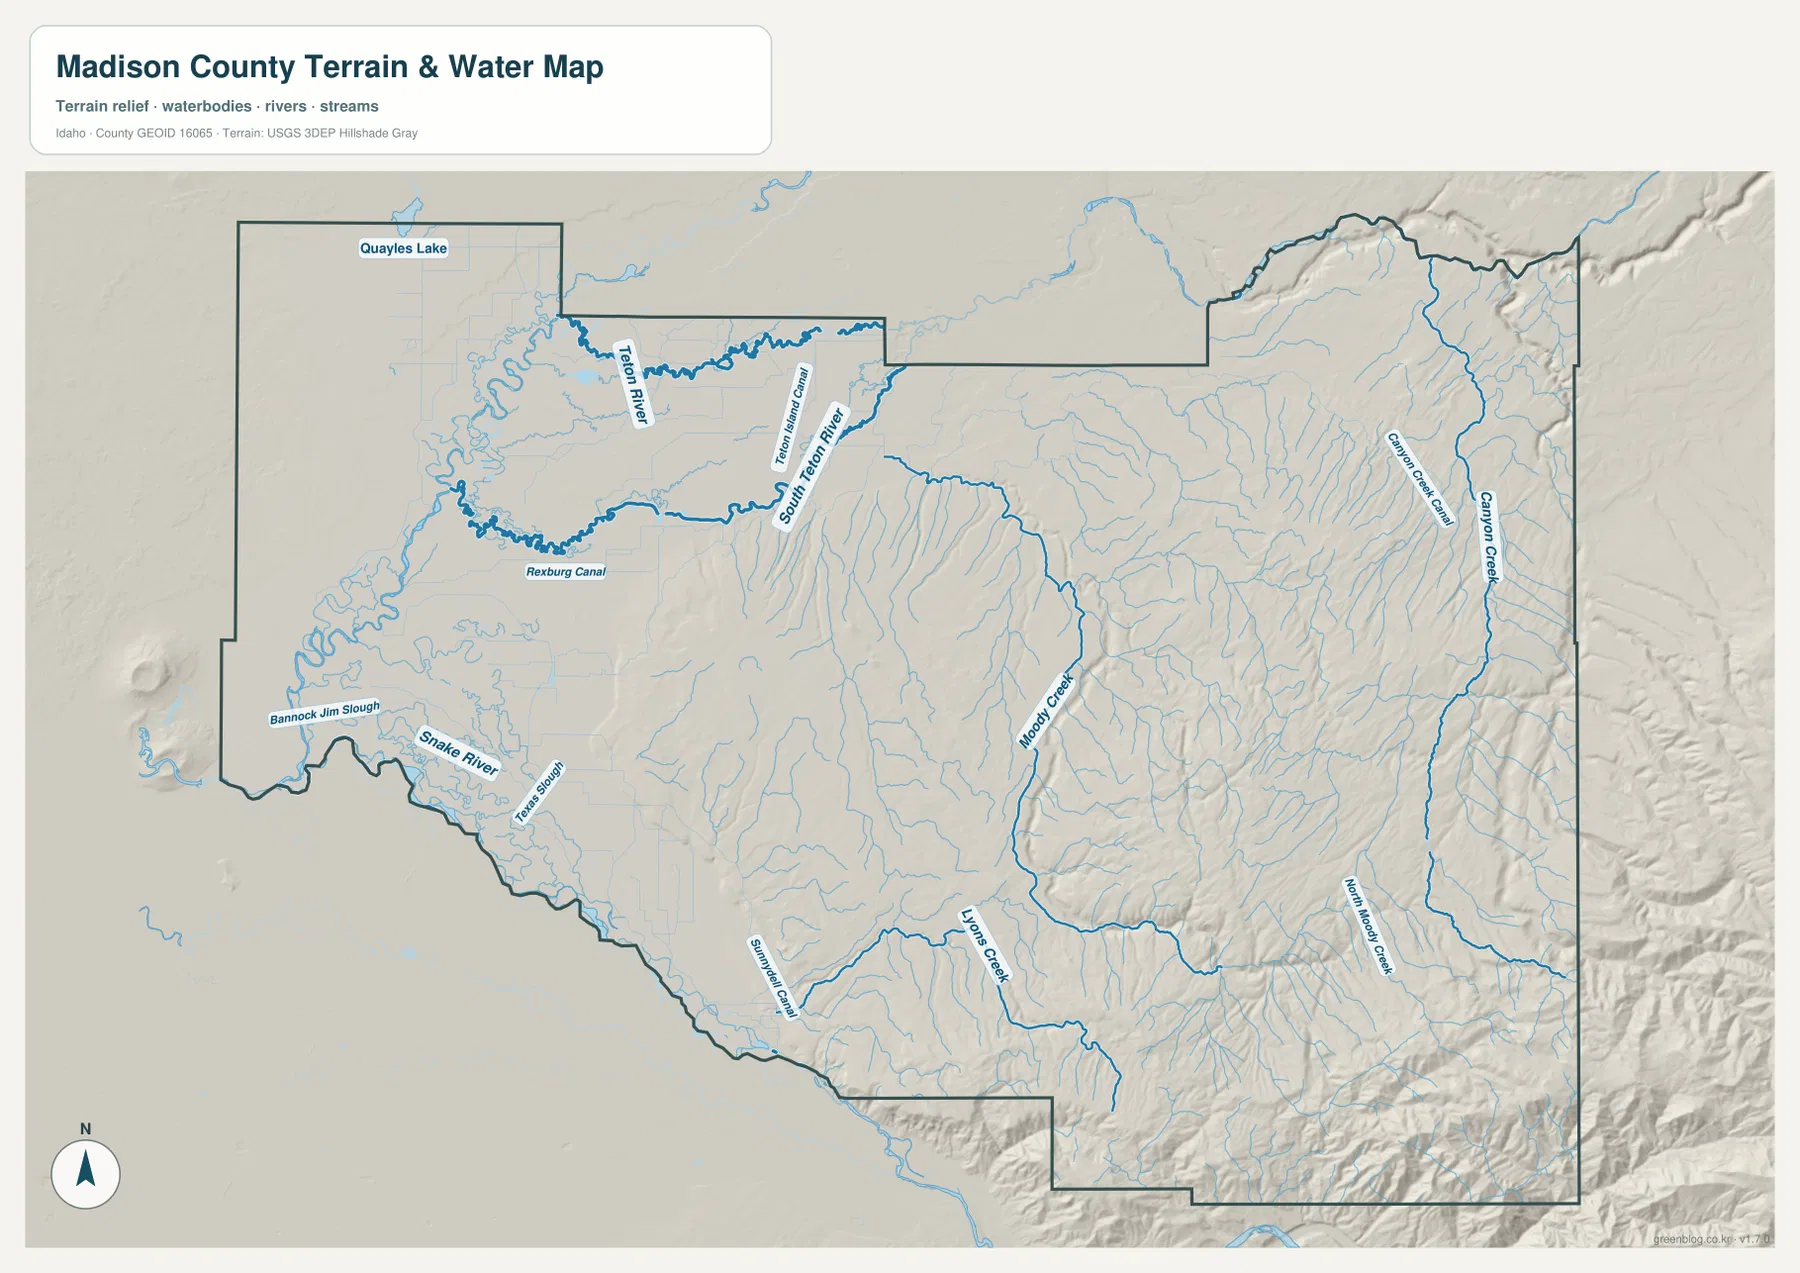
The terrain-and-water map adds another layer to Madison County by showing where the western plain meets a much more complex set of valleys. The Teton River is one of the strongest labels in the northwest, accompanied by the South Teton River and the Teton Main Canal. Near Rexburg, the Rexburg Canal is labeled separately, making it easy to distinguish a named canal from the nearby natural river system. Along the southwest side, the Snake River and smaller channels form a different water corridor near the county edge.
Farther east, the map changes from a canal-heavy plain to longer creek valleys. Moody Creek runs through the central-eastern area, while Canyon Creek and Canyon Creek Canal are labeled closer to the eastern side. Numerous smaller tributaries descend from the higher terrain and join these larger channels. The contrast between named canals in the west and natural creek valleys in the east is one of the clearest ways to see how landform and water distribution change across the county.
This view is designed to locate rivers, canals, creeks, and terrain, not to show flood zones, irrigation rights, seasonal water availability, or public access. A label such as Teton River, Snake River, Rexburg Canal, or Canyon Creek tells you where that feature is represented on the map, but not how much water it carries at a given time. Pairing the water map with the elevation map is more useful for understanding why western channels look different from the long drainage lines descending through the eastern slopes.
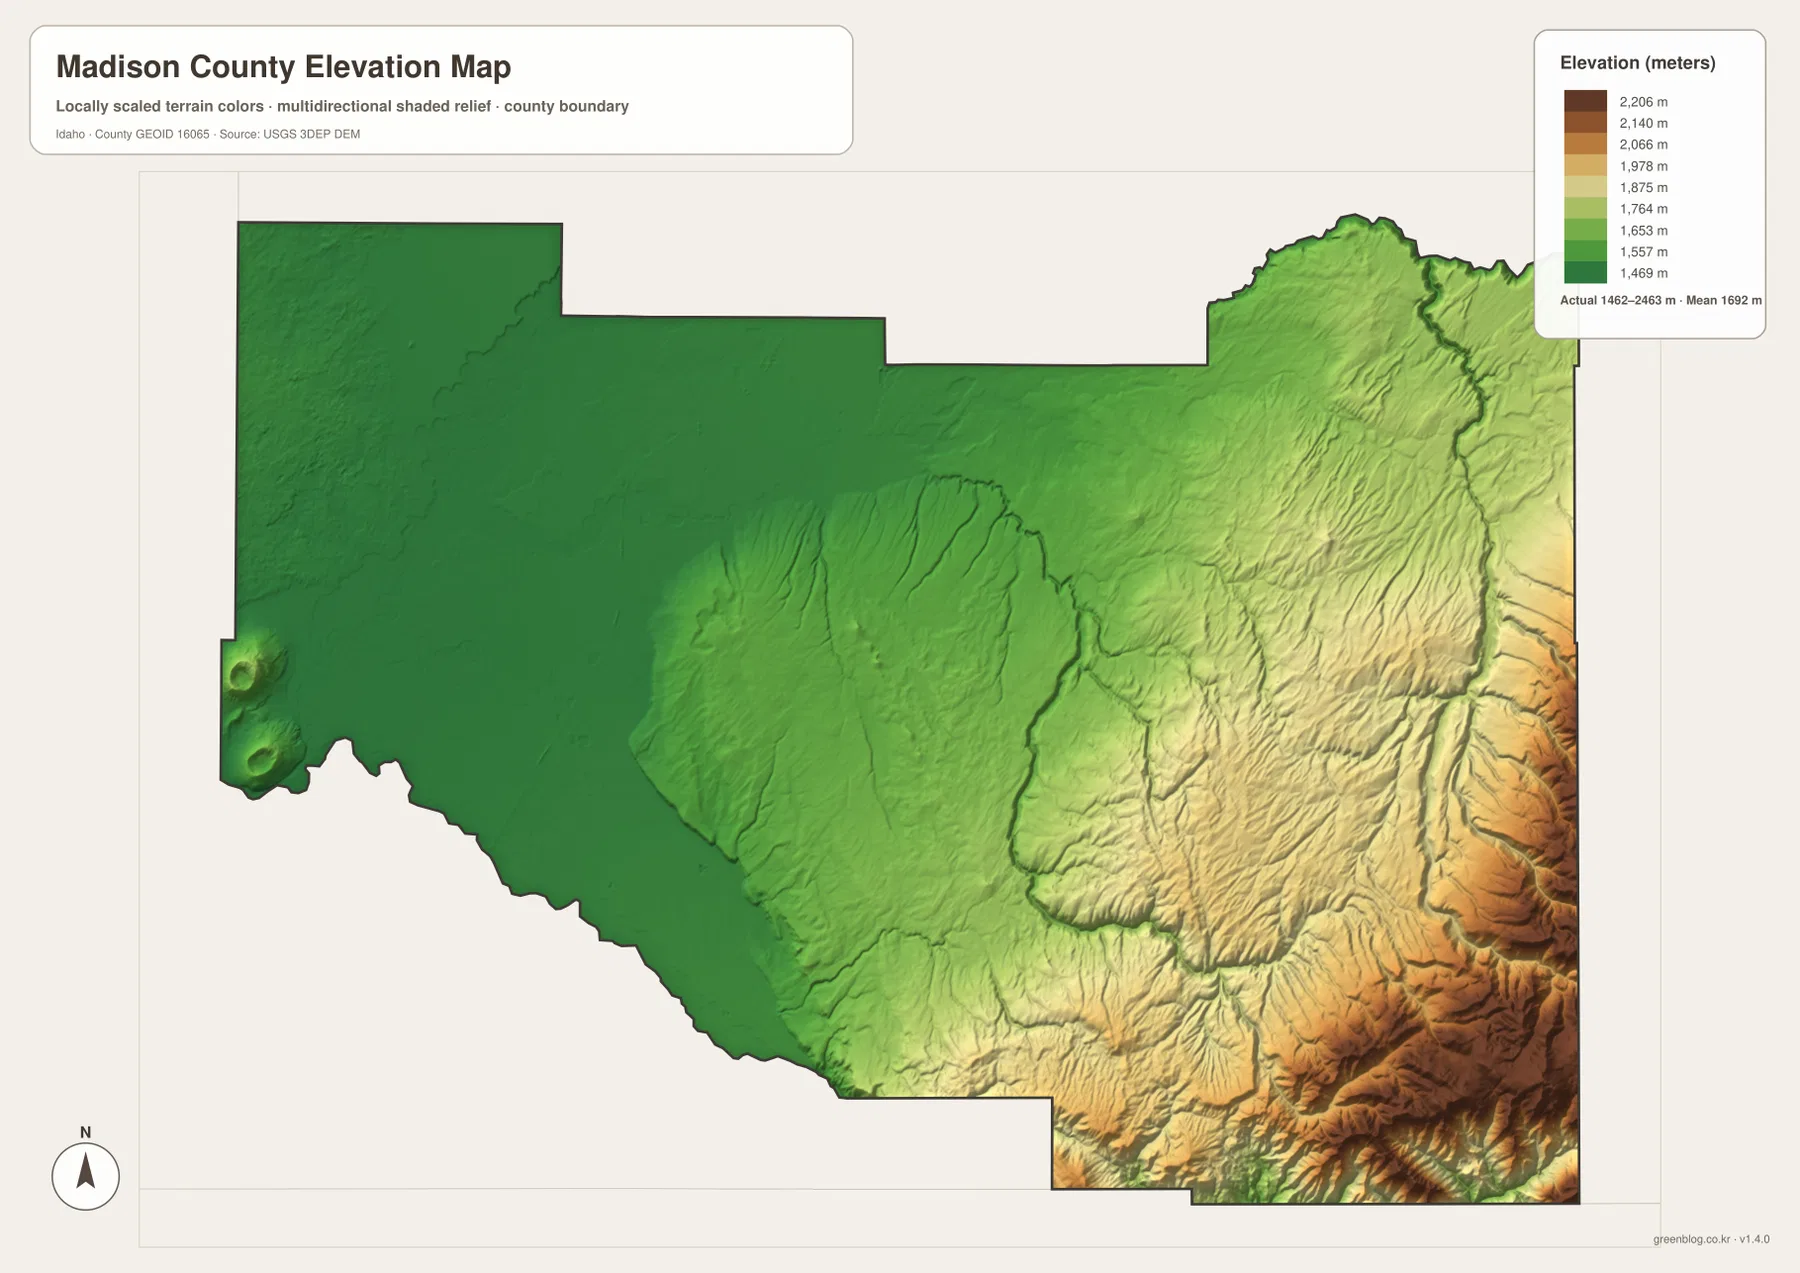
Elevation rises from about 1,462 meters in the west to 2,463 meters in the high east
The elevation map gives Madison County an actual mapped range of about 1,462 to 2,463 meters, with a mean elevation of about 1,692 meters. Dark green covers much of the west and northwest, marking the lower part of the county. Colors become lighter across the middle and shift toward yellow and brown along the eastern and southeastern edges. The strongest high-elevation colors are concentrated in the southeast, creating a sharp contrast with the Rexburg and Sugar City side of the county.
The rise is not a smooth, uniform slope. Stream valleys cut through the central and eastern highlands, and ridges alternate with lower drainage corridors. The southeast contains the broadest area of the warmest elevation colors, while the northeast is also elevated but does not show the same continuous deep-brown band. Looking first at the broad west-to-east change and then at the individual valleys is an easier way to read the map than trying to interpret every shaded ridge at once.
The elevation pattern also helps explain the water map. The lower western area contains the Teton River and several named canals, while the eastern highlands are crossed by longer creeks such as Moody Creek and Canyon Creek. The two maps complement each other, but the elevation layer remains a county-scale overview. For construction, engineering, surveying, or any task that requires a precise point elevation, USGS elevation data and site-specific measurements are more appropriate.
Choose the map by the question you need to answer
For a quick county overview, start with the general map. It keeps Rexburg, Sugar City, Routes 20 and 33, the county boundary, and nearby county context in one view. The city map is better when the main question is simply where the two featured cities sit within the larger county. Because it removes much of the extra detail, the west-heavy settlement pattern becomes especially easy to see.
The terrain-and-water map is the better choice for locating the Teton River, Snake River, Rexburg Canal, Moody Creek, Canyon Creek, and other labeled waterways. The elevation map is more direct when the goal is to compare the lower western plain with the much higher eastern and southeastern terrain. Using the water and elevation views together also makes it easier to connect western canals with flatter land and eastern creeks with deeper valleys and steeper slopes.
For classroom use, local reference material, or larger-format printing, the JPG originals in the ZIP are more practical than the on-page WebP previews. Each JPG is 3638×2572 pixels, so small labels remain easier to inspect when enlarged. The archive contains only the four map types described on this page; it does not add parcel, land-cover, flood, satellite, or real-time traffic maps.
Frequently Asked Questions
Which map is best for comparing Rexburg and Sugar City?
The city map provides the simplest comparison because it highlights only Rexburg and Sugar City as the two ranked major cities. Rexburg sits in the west-central area and Sugar City is just north of it. If you also need Routes 20 and 33 or the full county boundary, the general county map is the better follow-up view.
Can I see the Teton River, Snake River, and Rexburg Canal on one map?
Yes. The terrain-and-water map labels the Teton River and Snake River and also identifies the Rexburg Canal and Teton Main Canal. Moody Creek and Canyon Creek appear farther east, making it possible to compare the western river-and-canal system with the creek valleys of the higher terrain. The map does not show flood risk, water rights, or seasonal flow conditions.
Can the 1,462–2,463 meter elevation range be used for precise surveying?
No. The range and the mapped mean of about 1,692 meters summarize county-scale relief. They are useful for comparing the lower western plain with the higher eastern and southeastern terrain, but a specific parcel, road, or building site requires authoritative elevation data and professional or site-specific measurements.
Map File Information
Download the Madison County general map, city map, terrain-and-water map, and elevation map as high-resolution JPG originals in one ZIP file.
- Included Files: county map, city map, terrain-and-water map, elevation map
- Printable Size: 3638×2572 pixels for each JPG
Related Maps
Sources and references
County information can be checked through the Madison County, Idaho official website and the City of Rexburg official website. Administrative boundary and geographic reference data are available from the U.S. Census Bureau TIGER/Line Shapefiles.
Hydrography references are available from USGS National Hydrography, while elevation data can be checked through the USGS 3D Elevation Program.
Green Map creates custom-edited map images using open geographic data sources such as geoBoundaries, Natural Earth, OpenStreetMap, and government open data.
These maps are edited visual materials, not raw data files, and are provided for education, documents, presentations, and graphic reference.