If you need a printable Bear Lake County Map, this page provides the map files for direct download as high-resolution A3 JPG images in one ZIP archive. The maps cover the county boundary and roads, the main settlements, Bear River and smaller waterways, Bear Lake, and the large elevation contrast between the basin floor and the surrounding mountains. On the page, the WEBP versions are easier to browse quickly; the downloadable JPG files are better suited to printing, classroom handouts, presentations, or documents.
Bear Lake County occupies the far southeastern part of Idaho. Its geography is organized around a long lower corridor rather than a broad urban area. Georgetown lies in the north, Montpelier sits near the central road junction, and Paris, Bloomington, and St. Charles continue south toward Bear Lake. To the west and east, the land rises into mountain terrain cut by short creeks. Bear River enters from the north and bends through the basin, while Bear Lake forms the most prominent water feature at the southern end. Reading the maps together makes that valley-and-mountain structure much easier to see.
Table of Contents
The inhabited corridor runs from Georgetown through Montpelier toward Bear Lake
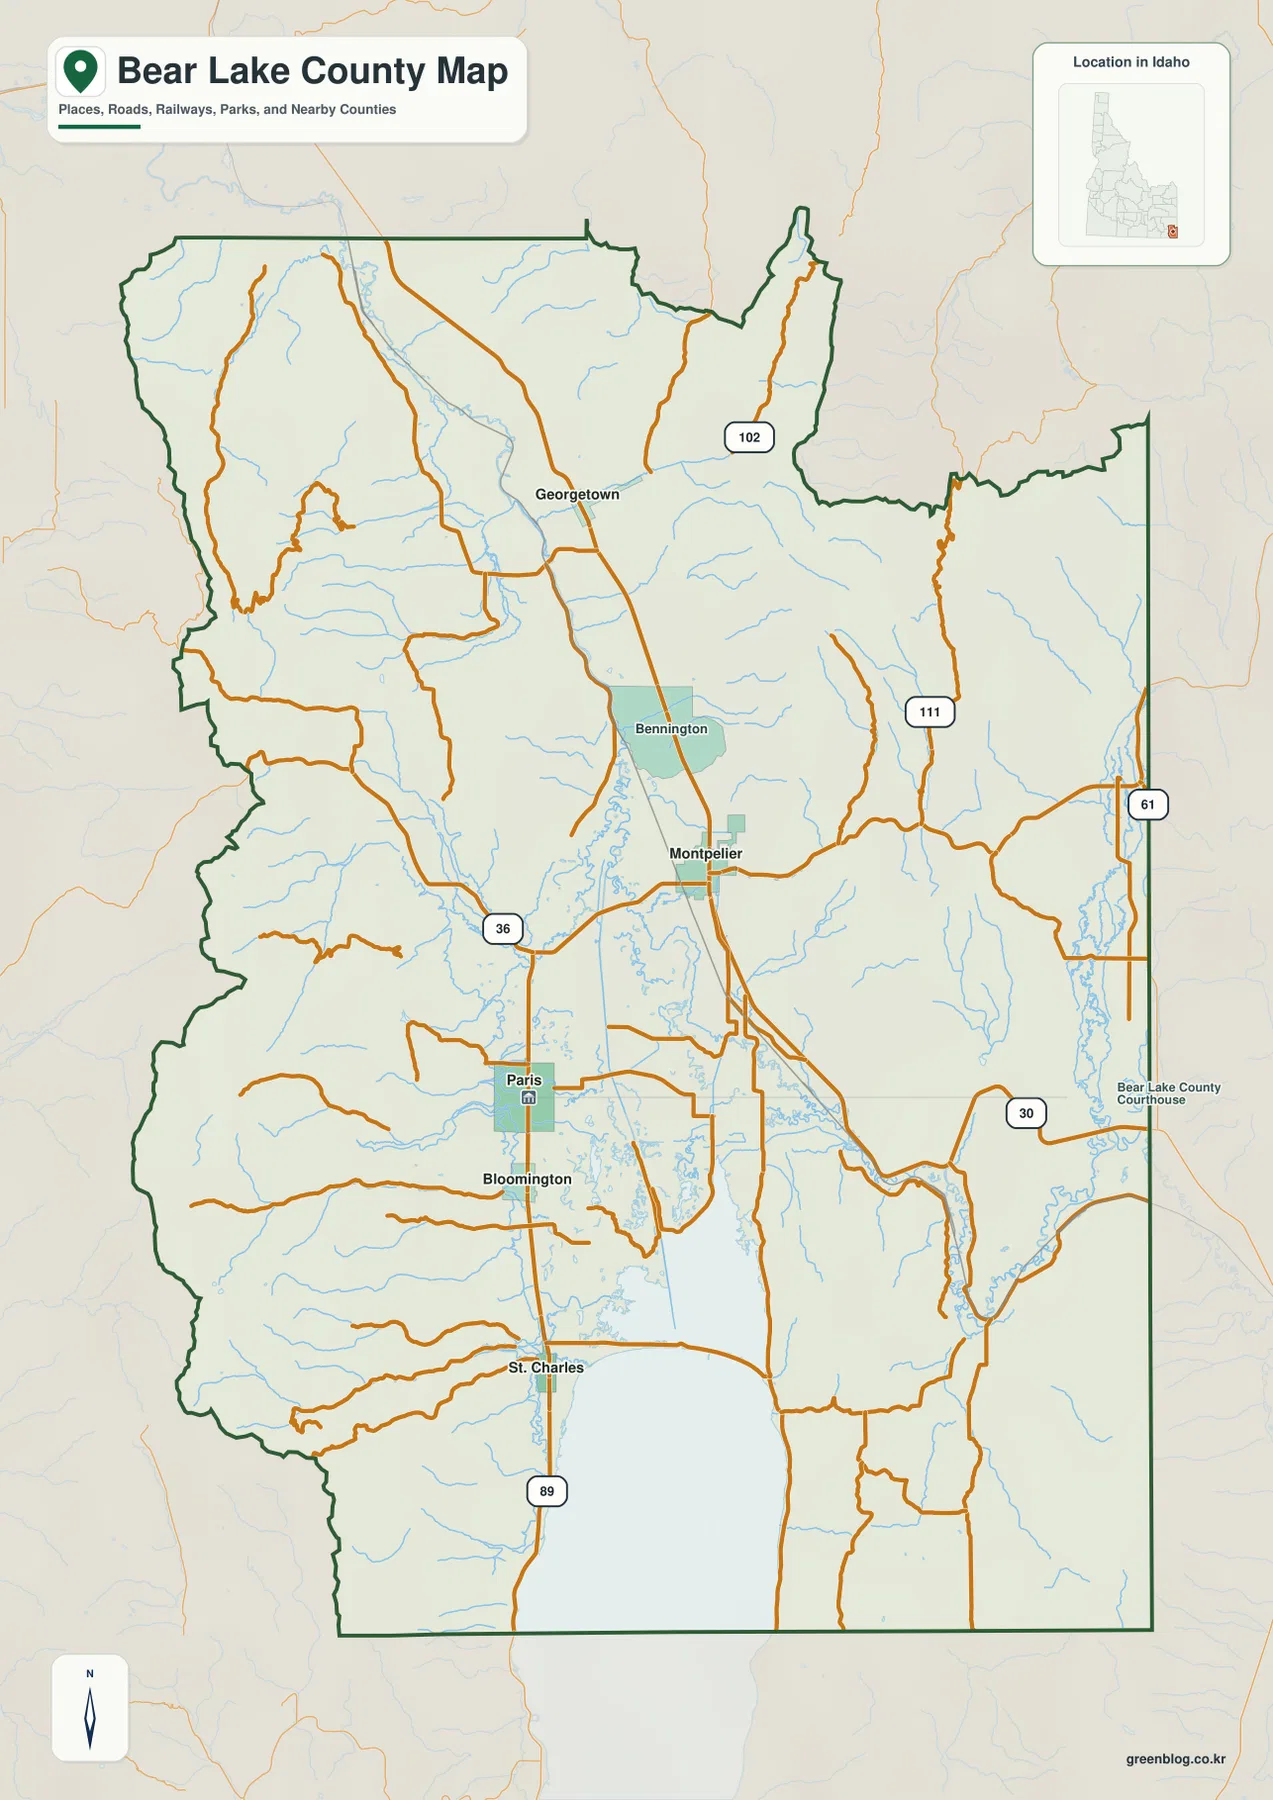
The general county map is the best place to establish orientation. Montpelier sits slightly south of the county’s middle and serves as the most obvious road reference point. U.S. 89 continues south through Paris, Bloomington, and St. Charles, while U.S. 30 crosses the Montpelier area and heads toward the southeast. The map also shows route shields 36, 61, 102, and 111, which help explain how the central basin connects with the mountain margins and the eastern side of the county. The City of Montpelier notes that U.S. Routes 89 and 30 meet in town, matching the road pattern shown here.
The county boundary is irregular, especially in the northeast and east. Roads are much denser through the lower central corridor than across the broken terrain along the western and eastern sides. Small streams spread through those mountain areas, but the longest continuous road-and-settlement pattern remains in the middle of the county. That contrast is useful because it shows why Montpelier, Paris, and the communities farther south are easier to connect on the map than places across the higher ridges.
Several named places make the county easier to read from north to south. Georgetown and Bennington are north of Montpelier. Paris and Bloomington appear farther south, followed by St. Charles near Bear Lake. Bear Lake County’s official website identifies the county courthouse in Paris, while Montpelier appears as the largest settlement in the supplied city index and as the main highway junction on the general map. Those two places therefore provide different but complementary reference points for understanding the county.
Montpelier anchors the settlement pattern, while smaller towns extend north and south
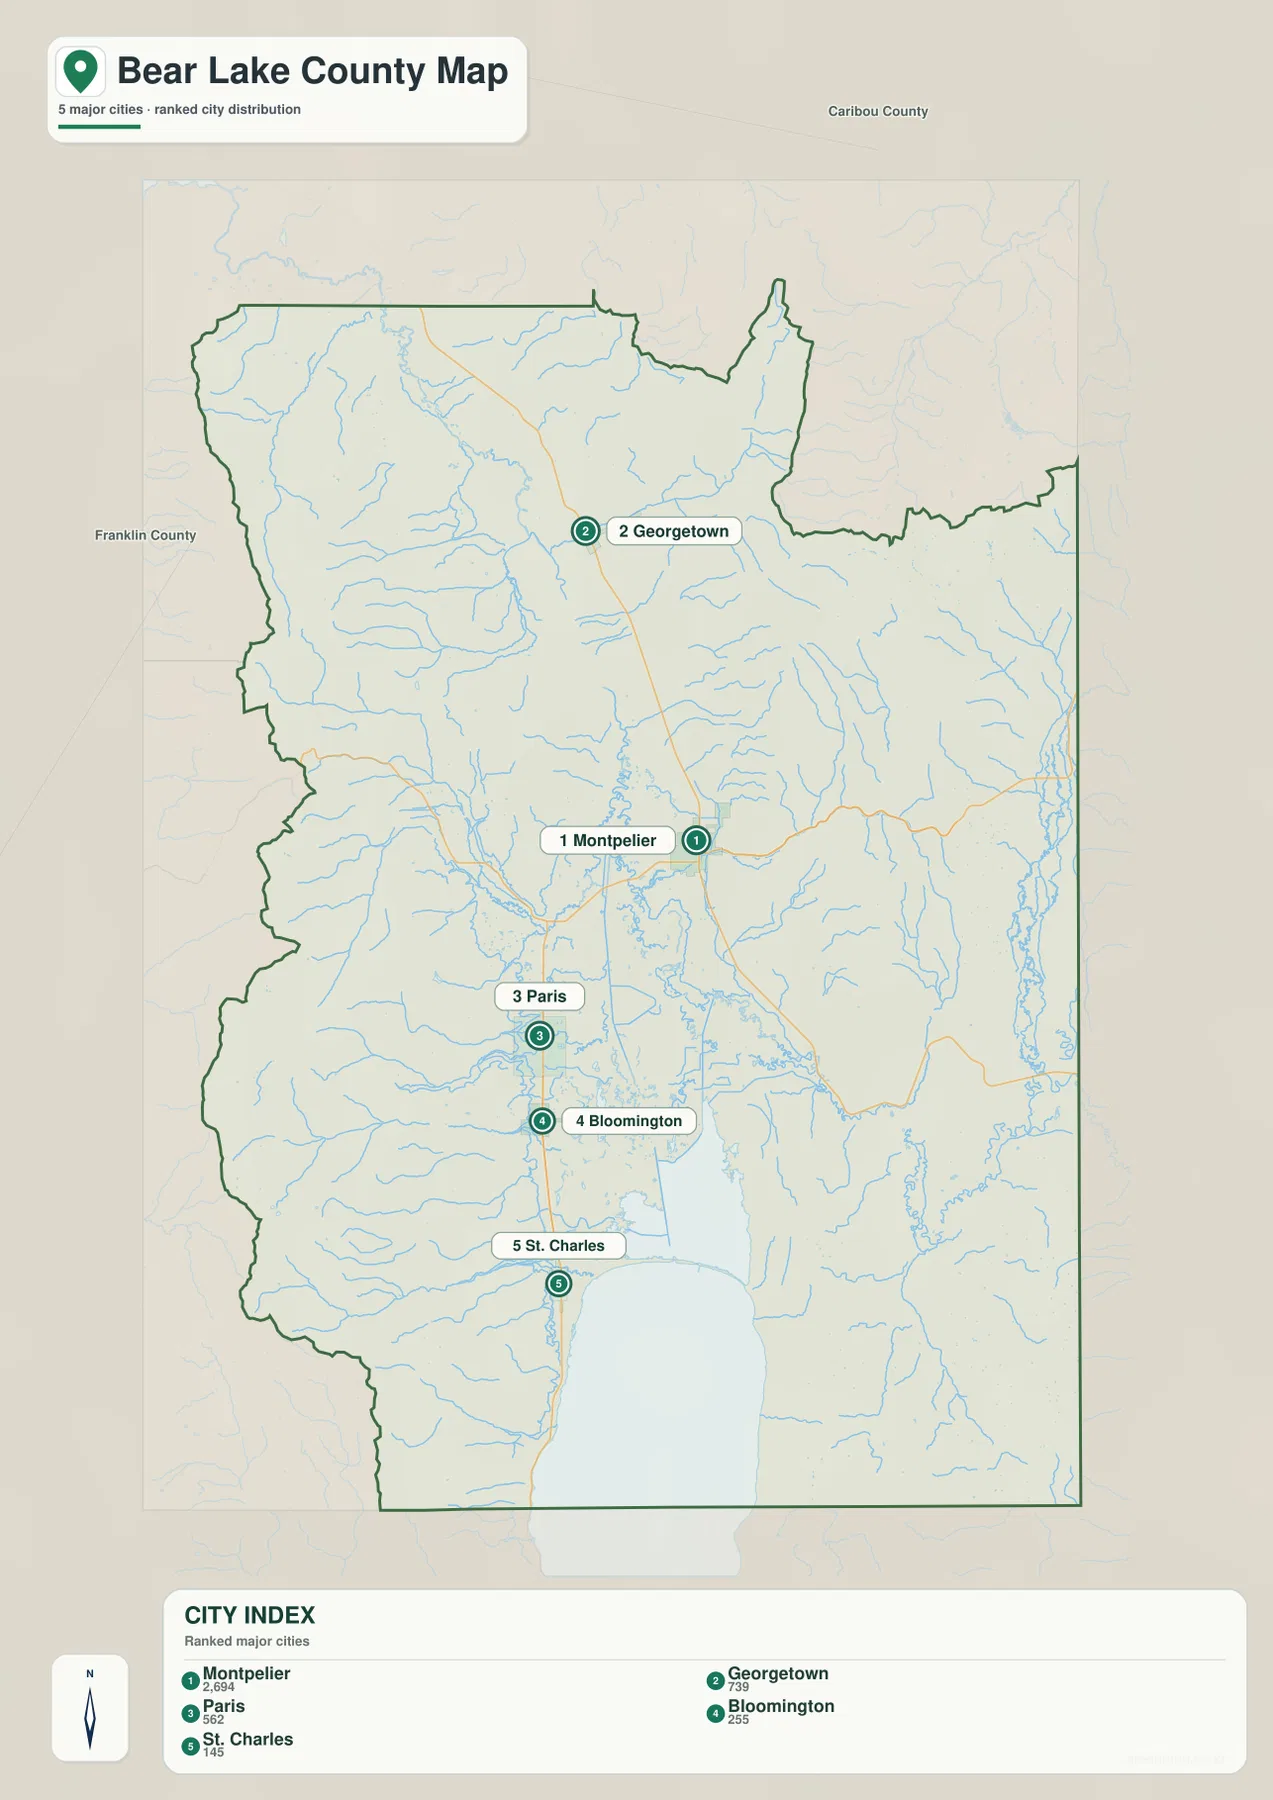
The city map strips away much of the road detail and emphasizes five ranked settlements. In the map’s city index, Montpelier is listed first at 2,694, Georgetown second at 739, Paris third at 562, Bloomington fourth at 255, and St. Charles fifth at 145. Those numbers should be treated as the values used by this particular map index, not as a substitute for a current official population table. Their main value here is to show relative prominence and location.
The arrangement is more revealing than the rankings themselves. Georgetown is separated from the southern group and sits well north of Montpelier. Montpelier occupies the middle of the inhabited corridor. Paris and Bloomington follow to the south, and St. Charles is the southernmost of the five, just above Bear Lake. This produces a long north-to-south chain rather than a compact cluster of towns. For a county profile, that pattern explains why the valley is a better organizing feature than the county’s full width.
Use the city map when the subject is settlement location or when a cleaner graphic is needed for a presentation. Use the general county map when roads and boundary context matter. The city graphic does not replace a route map: it is best for comparing where the five highlighted communities sit in relation to one another, while the general map is better for following U.S. 89, U.S. 30, and the smaller connecting roads.
Bear River bends through the basin as mountain creeks descend from both sides
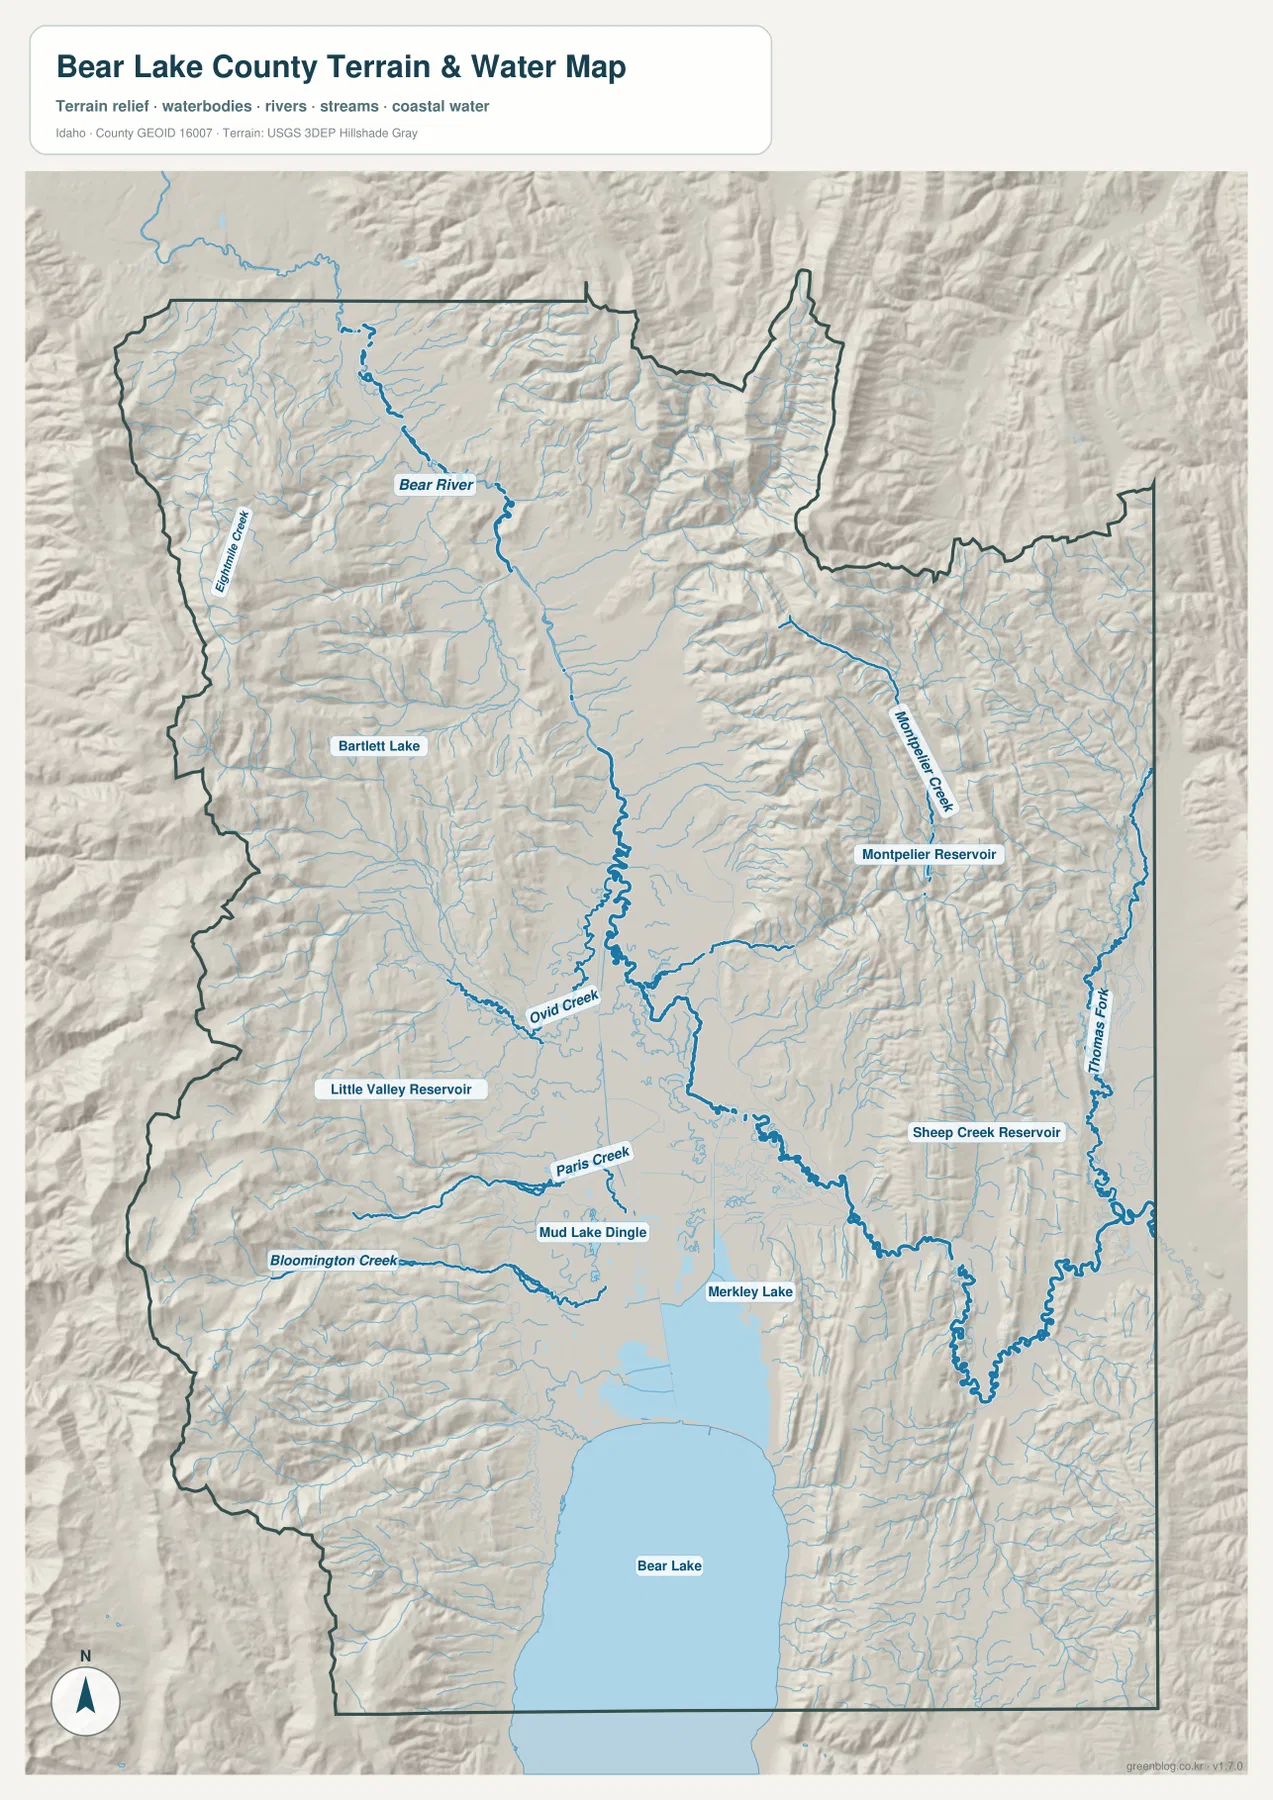
The terrain-and-water map shifts attention away from roads and toward drainage. Bear River enters the northern part of the county and curves through the lower central basin. Numerous shorter streams descend from higher ground on both sides. Emigration Creek is easy to follow along the west, while Ovid Creek, Paris Creek, and Bloomington Creek cross the western slopes and lower ground farther south. Because the water features are drawn over shaded relief, the direction from mountain terrain toward the basin is visually clear.
The eastern side has a different but equally visible network. Montpelier Creek comes out of the mountains toward Montpelier Reservoir. Sheep Creek Reservoir appears farther south, and Thomas Fork follows the eastern side for a long distance with many small tributaries entering it. Other named water features include Bartlett Lake, Little Valley Reservoir, Mud Lake Dingle, and Merkley Lake. These smaller features help show that the county’s water geography is not limited to Bear River and Bear Lake.
Bear Lake is the dominant water body at the southern edge. It extends beyond the county boundary, so the entire lake should not be treated as county territory simply because it occupies a large part of the map. The terrain-and-water image is intended for regional reference: it is useful for seeing rivers, creeks, reservoirs, lake position, and surrounding relief, but it is not a flood-zone map, parcel map, legal water-boundary document, or navigation chart.
Elevation explains why roads and towns favor the basin floor
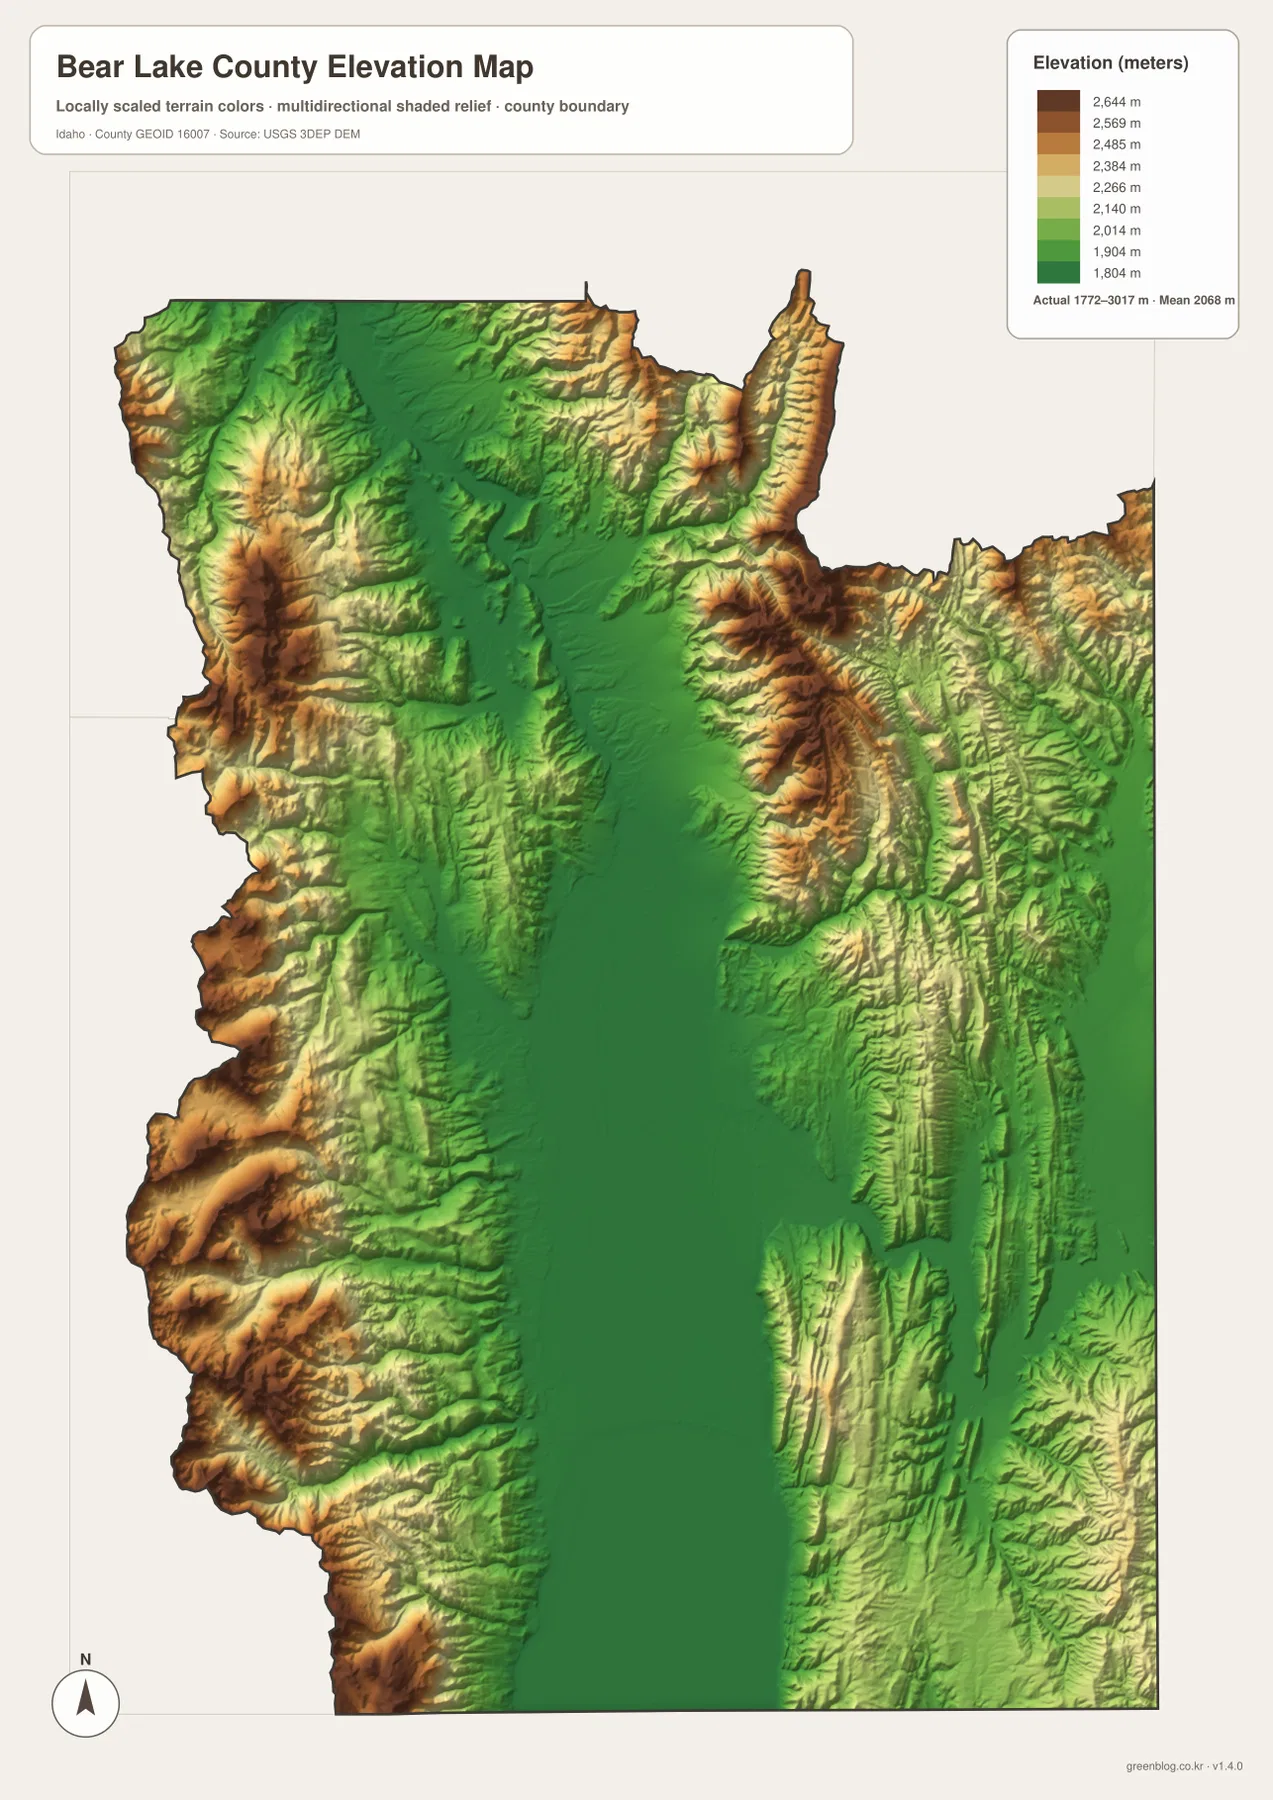
The elevation map makes the county’s basic shape especially clear. Dark green covers much of the central north-to-south lowland, while the western and eastern margins rise through lighter greens, yellows, tans, and browns. High ridges are concentrated along the mountain sides rather than in the populated corridor. The northeast and eastern mountain blocks stand out strongly, as do the rugged areas along the western boundary. When this map is compared with the road map, the reason for the central settlement pattern becomes easier to understand.
The map reports an actual elevation range of about 1,772 to 3,017 meters, with a mean near 2,068 meters. Its legend includes steps around 1,804, 1,904, 2,014, 2,140, 2,266, 2,384, 2,485, 2,569, and 2,644 meters. These values are useful for county-scale comparison, especially when distinguishing the lower basin from the surrounding mountains. They should not be read as site-specific survey elevations. Construction, property, engineering, or exact trail-point work requires original elevation data or professional measurements.
Water and elevation tell the same story from different directions. Bear River remains in the lower central area, while streams such as Emigration Creek and Montpelier Creek descend from higher terrain. Bear Lake sits in the broad low area at the southern end, yet steep slopes rise around much of the basin. The major road corridor and the chain of settlements therefore stay close to lower ground instead of crossing the highest ridges directly.
Choose the map by the question, then download the A3 files you need
For a first look at Bear Lake County, begin with the general map and locate Montpelier. From there, trace U.S. 89 south through Paris, Bloomington, and St. Charles toward Bear Lake, then look north toward Georgetown. If the goal is simply to explain where the main communities are, the city map gives the cleanest view. If the topic is physical geography, the water map and elevation map make a stronger pair because they show how streams descend from the mountain margins into the lower basin.
You do not need to use all of the maps in every project. A travel or local-orientation handout may need the general map and settlement map, while a lesson about landforms may be clearer with the water and elevation images. The on-page WEBP files are convenient for quick reference, but the downloadable archive contains the four corresponding high-resolution A3 JPG maps as separate files. That makes it easy to print one map, insert a single image into a report, or choose a different map for a slide without extracting information from one crowded composite.
Frequently Asked Questions
Does Bear Lake lie entirely inside Bear Lake County?
No. Bear Lake occupies the large southern water area on the supplied maps, but the lake continues beyond the county boundary. Read the shoreline and county outline together rather than treating the whole lake surface as county territory.
Which map is best for comparing Montpelier, Paris, and St. Charles?
Use the city map for the clearest comparison of their relative positions and north-to-south order. Then switch to the general county map if you also need U.S. 89, U.S. 30, the county boundary, and nearby streams.
Can the 1,772–3,017 meter elevation range be used for surveying?
No. The elevation image is a generalized county-scale reference that shows where terrain is relatively low or high. Surveying, engineering, construction, and exact site work should rely on original elevation data and appropriate professional measurement.
Map File Information
Download the Bear Lake County map set as four separate high-resolution A3 JPG files. The archive matches the maps shown on this page and keeps the county, settlement, water/terrain, and elevation views as individual files for easier printing and reuse.
- Included Files: four A3 JPG maps
Related Maps
Sources and Reference Links
- Bear Lake County official website – county government and courthouse information
- City of Montpelier – local community information and the U.S. 89/U.S. 30 junction
- U.S. Census Bureau TIGER/Line – boundary, road, and place reference
- USGS National Hydrography – waterway reference data
- USGS 3D Elevation Program – elevation and terrain reference data
Green Map creates custom-edited map images using open geographic data sources such as geoBoundaries, Natural Earth, OpenStreetMap, and government open data.
These maps are edited visual materials, not raw data files, and are provided for education, documents, presentations, and graphic reference.