A country table of general government expenditure can be badly misleading if the unit is ignored. General government total expenditure (current LCU) expresses government spending in each economy’s own current local currency unit. A dollar, yen, rupiah, rupee and rial are not the same monetary unit, so sorting the raw numbers does not create a valid international ranking of fiscal size.
The 2025 extract contains 185 country and area observations. The Republic of Korea is not included in this same-year set. The map below is intentionally not a fiscal-size ranking: it groups the written local-currency numbers by order of magnitude to show how strongly currency denomination affects the raw figures.
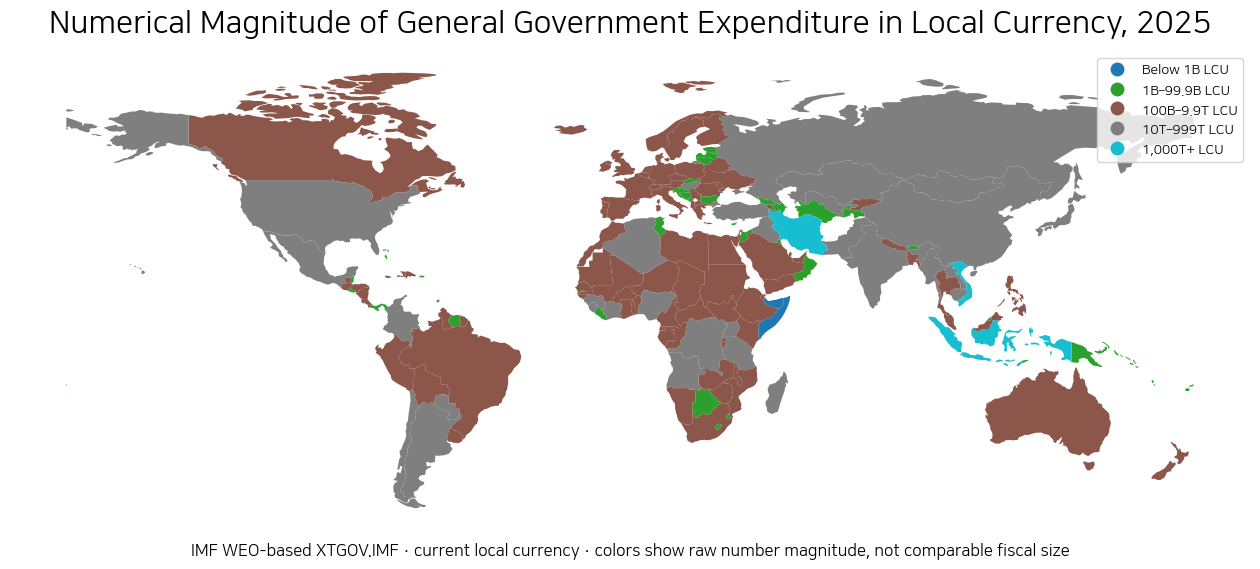
Table of Contents
Current LCU means current-price local currency
LCU stands for local currency unit. The word current means that the series is measured at prices prevailing in the observation year rather than at constant prices. For a single country, that can be useful for connecting fiscal expenditure with budgets and other domestic-currency data. It is a nominal series, so inflation can raise the number even when the real volume of government activity changes less.
Across countries, the local-currency unit introduces a second problem. Currency denominations differ enormously. One unit of the Japanese yen, Indonesian rupiah, Indian rupee or U.S. dollar does not represent the same monetary value. Without conversion to a common scale, raw current-LCU figures should not be divided or ranked as if they were directly comparable.
Why Indonesia or Iran can show a much larger raw number than the United States
A raw-number sort places economies such as Iran, Indonesia and Viet Nam far above the United States. That does not mean their governments spend more in comparable economic terms. It reflects, in part, the number of local-currency units required to express a nominal amount.
For example, the United States is about 11.568 trillion LCU in the supplied 2025 data, Japan about 244.240 trillion LCU, India about 98.109 trillion LCU and Indonesia about 3,913.576 trillion LCU. Those values are expressed in different currencies. Treating them as one common unit would produce a false comparison.
| Country | ISO3 | 2025 raw value |
|---|---|---|
| United States | USA | 11.568 trillion LCU |
| China | CHN | 47.059 trillion LCU |
| Japan | JPN | 244.240 trillion LCU |
| Germany | DEU | 2.239 trillion LCU |
| France | FRA | 1.706 trillion LCU |
| United Kingdom | GBR | 1.306 trillion LCU |
| India | IND | 98.109 trillion LCU |
| Indonesia | IDN | 3,913.576 trillion LCU |
| Brazil | BRA | 6.080 trillion LCU |
| Mexico | MEX | 10.295 trillion LCU |
| Australia | AUS | 1.121 trillion LCU |
| Canada | CAN | 1.421 trillion LCU |
General government is broader than central government
General government is not simply the central government’s budget. In IMF fiscal concepts it covers government units across levels of government, including central, state or regional and local government, and it can include social security funds. Public corporations that operate as market entities are normally outside the general-government boundary.
This institutional coverage matters when comparing a national finance-ministry budget with a general-government series. Federal systems, decentralized countries and economies with large social-insurance funds can show substantial differences between central-government expenditure and consolidated general-government expenditure.
Total expenditure is broader than government final consumption
General government final consumption, which Green Map also compares as a share of GDP, is a national-accounts consumption concept. Total expenditure is a broader fiscal concept and can include transactions such as transfers, interest and capital spending that are not equivalent to final consumption.
Two countries can therefore have similar final-consumption shares but different total-expenditure structures. The two indicators answer related but distinct questions and should not be substituted for one another.
For cross-country comparisons, expenditure as a share of GDP is more useful
If the goal is to compare the relative size of government spending across economies, general government total expenditure as a percentage of GDP is usually easier to interpret than current LCU. Using GDP as the denominator places expenditure against the size of each economy and removes the direct problem of different currency denominations.
A GDP ratio is still not a score of government efficiency or policy quality. The ratio can rise when GDP falls even if spending is stable, and it is influenced by social-insurance systems, interest costs, defence, demographics, federal structures and fiscal policy choices. It is simply a more coherent cross-country scale than unconverted local-currency amounts.
Common-currency conversion is another option, but exchange rates matter
Government expenditure can also be converted into a common currency such as U.S. dollars. That supports comparison of nominal amounts, but market exchange rates can move sharply. A country’s dollar value can fall even when its domestic-currency expenditure changes little if its currency depreciates.
Purchasing-power-parity conversion answers yet another question by adjusting for differences in domestic price levels. Current LCU, market-dollar expenditure, GDP shares and PPP-adjusted spending are different analytical views rather than interchangeable versions of the same statistic.
The 2025 figure should not automatically be treated as an audited final outturn
The fiscal series behind XTGOV.IMF is linked to the IMF World Economic Outlook. The WEO database contains macroeconomic results together with IMF staff estimates and projections, depending on the economy, year and database vintage. A 2025 WEO-series figure should therefore be described as the value in that fiscal dataset rather than automatically as a country’s final audited budget execution.
Detailed budget execution and final accounts are better checked against national finance ministries, statistical agencies or IMF Government Finance Statistics when available. The purpose here is to explain the meaning and limitations of the common 2025 current-LCU series.
A mean or median of mixed local currencies is not a meaningful global spending amount
The raw median of the 185 values is about 0.351 trillion LCU and the raw mean about 289.499 trillion LCU. Those numbers should not be presented as an average global government-expenditure amount because they combine unrelated currency units.
The raw numerical magnitudes span roughly log10 8.0 to 16.6. That enormous spread is partly a denomination effect. The map uses number-size bands only to make that problem visible; it does not interpret darker or larger-number bands as greater comparable fiscal spending.
Why the Republic of Korea is absent from this 2025 set
The 185-row 2025 extract does not contain a Republic of Korea observation. That is a missing observation in this same-year set, not a value of zero. No older Korean observation is substituted and relabelled as 2025.
For a Korea-inclusive fiscal comparison, a matched-year IMF WEO fiscal ratio or another official government-finance series should be used. Keeping missing data distinct from zero is essential in same-year international comparisons.
Education and health spending answer narrower functional questions
Government education expenditure and government health expenditure focus on specific functions of government and are often expressed as shares of GDP or total government spending. General government total expenditure is the broader fiscal envelope across functions.
A country can devote a high share of GDP to education while having a very different total government-spending structure from another country. To analyse fiscal priorities, it is useful to read the total-expenditure scale together with function-specific education, health and social-protection indicators.
Data source and interpretation
The 2025 country and area values are distributed through the UNESCO UIS Data Browser under XTGOV.IMF. UIS education-finance methodology identifies the IMF World Economic Outlook as the source used for total general government expenditure across all sectors.
The IMF WEO data conventions state that domestic-economy series are reported in national currency units. For that reason, no raw current-LCU country ranking is published here.
Frequently Asked Questions
Can current-LCU government expenditure be ranked directly across countries?
No. Each country uses a different local currency unit, so the raw numbers are not on a common monetary scale. A GDP ratio or common-currency conversion is more suitable for cross-country comparison.
Does general government mean only the central government?
No. General government is broader and normally includes central, regional or state, local government and social-security funds within the general-government sector.
Why is the Republic of Korea missing from the 2025 table?
The supplied 2025 XTGOV.IMF observation set does not contain Korea. Missing data are not treated as zero, and an older observation is not relabelled as 2025.
What is a better indicator for comparing government spending across countries?
General government total expenditure as a percentage of GDP is useful for comparing spending relative to economic size. Common-currency amounts can compare nominal scale but are sensitive to exchange rates.
Related Articles
- How Much of GDP Is Government Final Consumption? (2025)
- How Much of GDP Do Governments Spend on Education?
- How Much of GDP Does Government Health Spending Represent? (2023)
Green Map creates custom-edited map images using open geographic data sources such as geoBoundaries, Natural Earth, OpenStreetMap, and government open data.
These maps are edited visual materials, not raw data files, and are provided for education, documents, presentations, and graphic reference.