Sevier County occupies the southwest corner of Arkansas near Oklahoma, with De Queen serving as the county seat and the main road hub. The county stretches from higher, more broken ground in the north toward lower river country along the southern boundary. On the maps below, De Queen, Horatio, Lockesburg, Ben Lomond, and Gillham form useful place markers, while De Queen Lake, the Rolling Fork, the Cossatot system, and the Little River explain much of the county’s physical layout.
You can download the original high-resolution A3 JPG files from this Sevier County Arkansas Map set in one ZIP near the end of the page. Four files are included: the county reference map, city-connection map, terrain-and-water map, and elevation map. The first two are best for places and roads; the last two make the contrast between the higher northern terrain and the lower river valleys much easier to see.
Table of Contents
De Queen is the easiest place to start reading the county
De Queen is the county seat and the clearest orientation point on the general map. U.S. 70 crosses the western half of the county through De Queen, while U.S. 71 runs north toward Gillham and south toward Horatio. Several smaller routes branch away from the same area, so the town works as a practical center for understanding where the other communities lie rather than as just another label on the map.
Gillham appears north of De Queen along the U.S. 71 corridor, close to Route 59. Horatio sits to the southwest, and Lockesburg is farther east where Routes 24, 371, and 329 provide additional connections. Ben Lomond is well to the southeast, near the long narrow extension of the county. Those positions show how Sevier County’s communities are spread along road corridors instead of forming one continuous urban area.
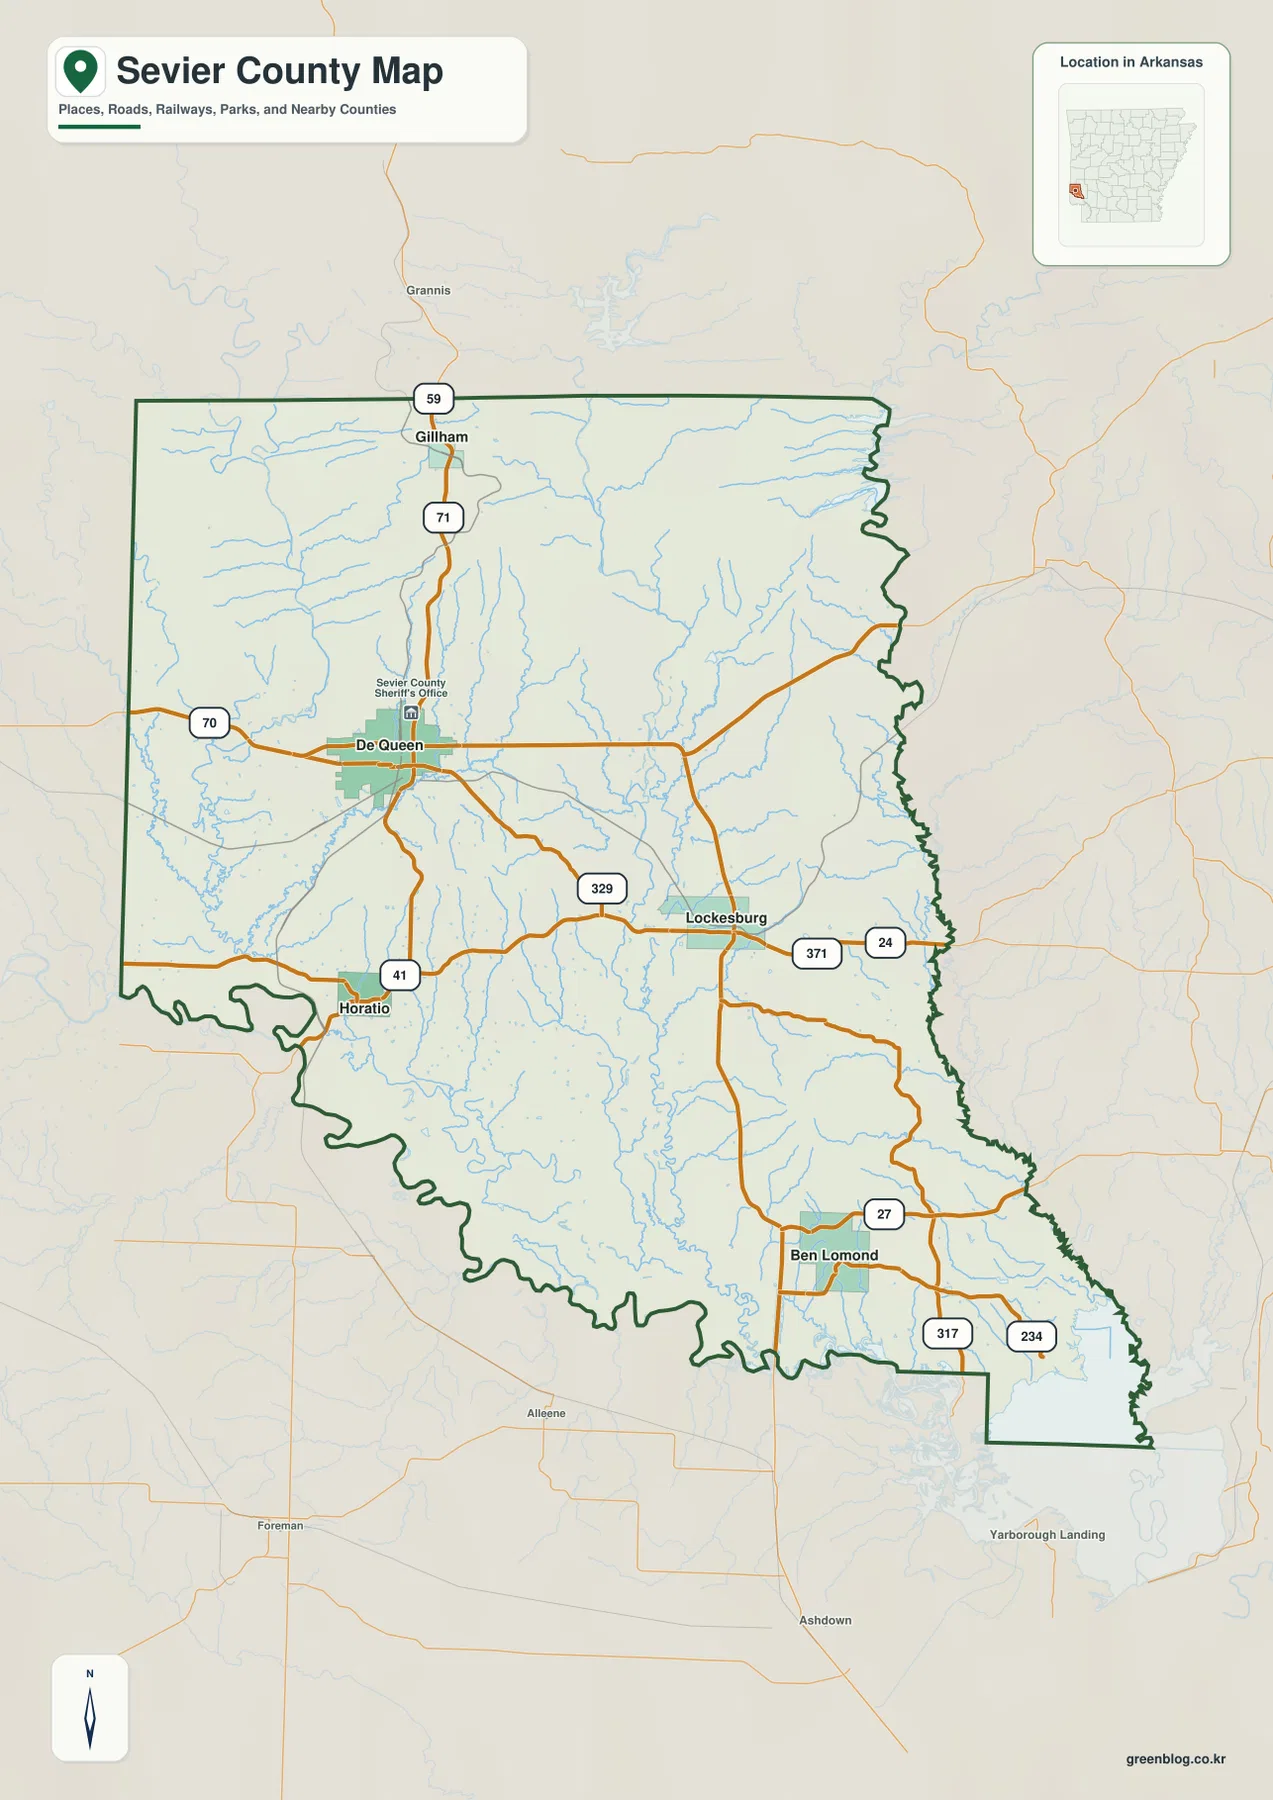
The county boundary also matters when using the road map. The northern edge is comparatively straight, but the south follows a much more irregular river boundary before the county narrows toward the southeast. Oklahoma lies to the west, Polk County is to the north, and Howard, Hempstead, and Pike counties appear along the eastern side in the supplied map context. Looking at the boundary and roads together makes it easier to tell when a route is leaving Sevier County.
The city view shows how far the smaller communities sit from De Queen
The city-connection map simplifies the county by using De Queen as the hub and highlighting Horatio, Lockesburg, Ben Lomond, and Gillham around it. That design makes the directional pattern immediately clear: Gillham is north, Horatio is southwest, Lockesburg is east, and Ben Lomond is southeast. The spacing between the labels is just as useful as the ranking because it shows that the county is made up of separated communities linked by rural roads.
De Queen has the strongest road concentration in the map set, while the other places sit at different points along a broader network. Lockesburg is important for the eastern half of the county, and Ben Lomond helps locate the narrow southeastern section. Gillham is a useful marker for the higher northern side, especially when the city map is compared with the elevation view. Horatio, by contrast, lies closer to the lower southern terrain and the Little River side of the county.
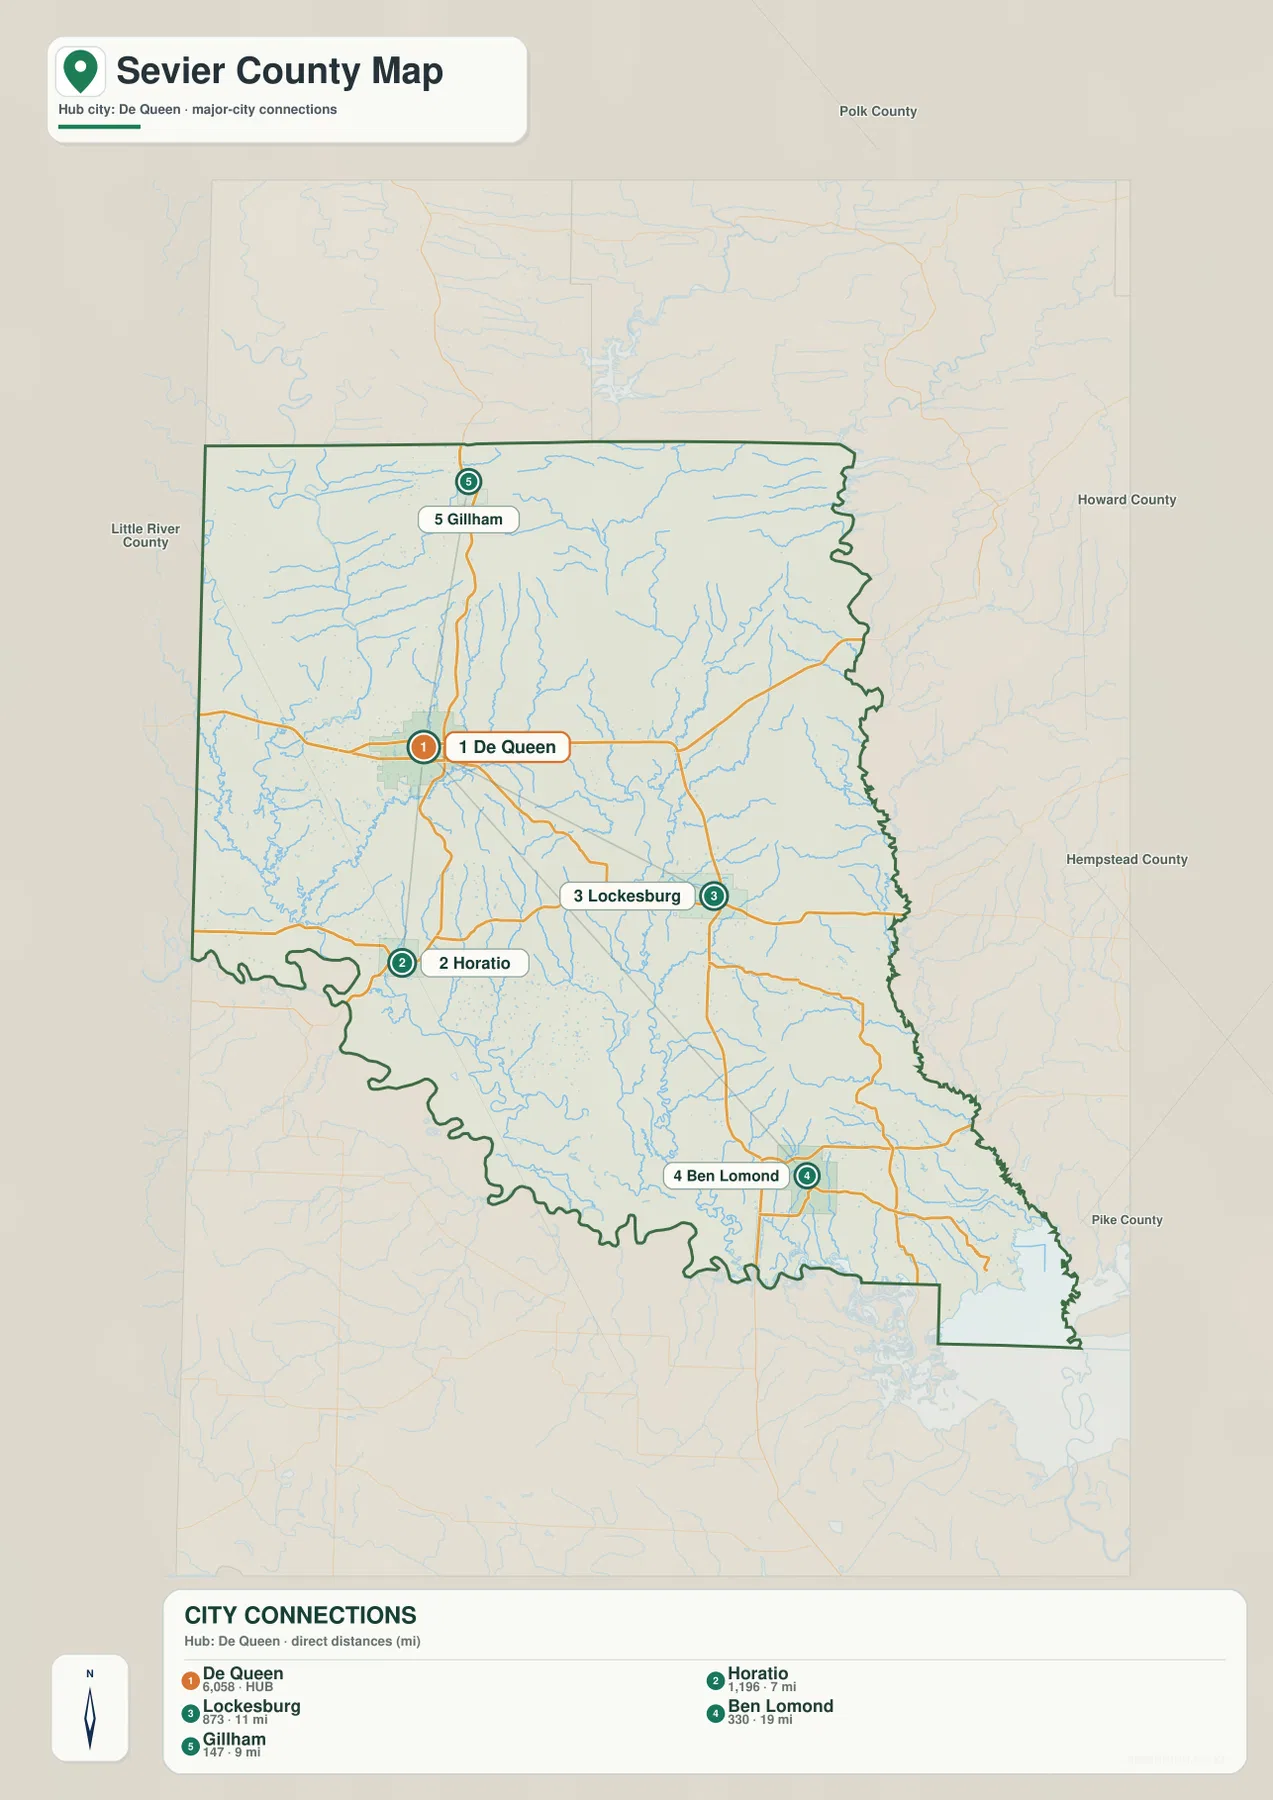
The figures printed on the supplied city graphic are best treated as the map’s comparison values rather than as a substitute for current Census estimates. Population figures can change, while the purpose of this image is mainly to show where the communities are located and how they relate to De Queen. For current demographic numbers, use an official statistical source rather than relying on a static map label.
Rivers and lakes give Sevier County much of its shape
Water is unusually important for understanding Sevier County. The county’s official history and the Encyclopedia of Arkansas describe the Little River along the southern boundary, the Saline River on the eastern side, and the Cossatot and Rolling Fork rivers running generally from north to south. The terrain-and-water map matches that broad pattern and adds many smaller tributaries that fill the spaces between the main river corridors.
De Queen Lake is the most obvious named water body in the northwest. The U.S. Army Corps of Engineers manages the lake, which lies north of De Queen in the foothill landscape. Downstream, the Rolling Fork River continues through the western side of the county, with smaller channels such as Bear Creek joining the network. The lake and river together make a good reference when comparing De Queen with the higher land toward Gillham.
The Cossatot River and Little Cossatot River are more prominent through the central and eastern interior. On the supplied water map, the Cossatot forms a long north–south line that receives many short tributaries from both sides. Farther south, those streams join the lower river system near the Little River boundary. The Saline River appears near the southeastern and eastern edge, while Pond Creek is one of the named channels closer to the lower western half.
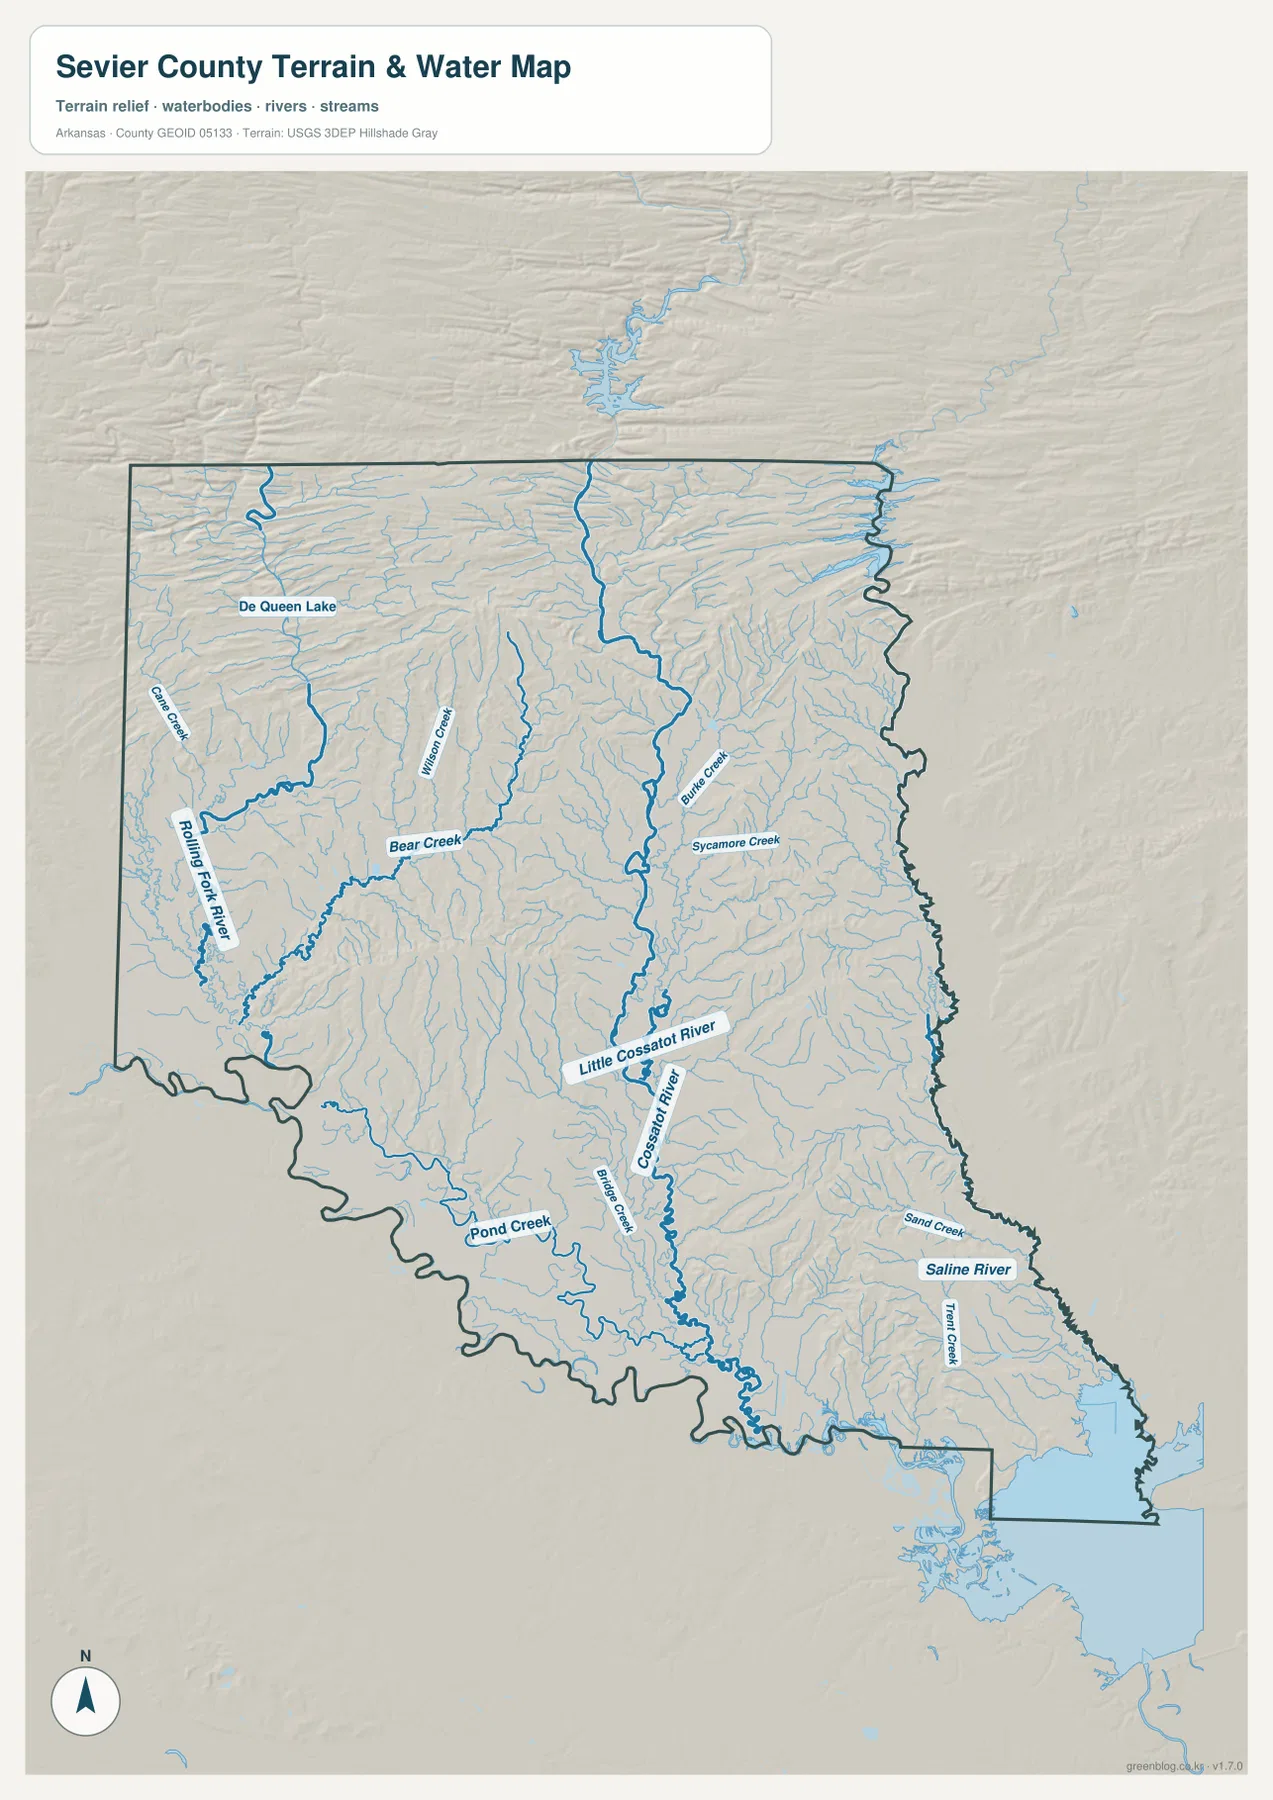
The smaller streams reveal an important terrain difference. In the northern hills, short tributaries branch from narrow ridges and descend toward the larger rivers. In the central and southern portions, the valleys broaden and the main channels cross wider areas of lower ground. When the water map is placed beside the elevation map, the relationship between the drainage routes and the surrounding hills becomes much easier to understand.
This map should be used for county-scale geographic reference, not for legal or safety decisions. It does not replace current flood-hazard maps, parcel boundaries, water-quality records, or navigation information. If a project depends on those details, consult the responsible agency’s current data rather than treating a general county map as a site-specific source.
Higher northern ridges give way to lower river valleys in the south
The elevation map gives an actual range of about 79 to 267 meters for Sevier County, with a mean near 130 meters. The highest colors are concentrated mostly along the northern and northwestern edge, where short ridges and broken hills stand above the rest of the county. Moving south from that band, the map becomes increasingly green, indicating lower terrain around De Queen and across much of the central and southern river country.
The northern edge is not one continuous high plateau. Instead, narrow ridges are separated by creek valleys, creating a textured pattern that is visible in both the elevation shading and the water map. Gillham lies close to this more elevated zone. De Queen sits farther south in a lower setting, and Horatio is also surrounded by broader low ground. Lockesburg has hills nearby, but the terrain around it is generally less elevated than the northern rim.
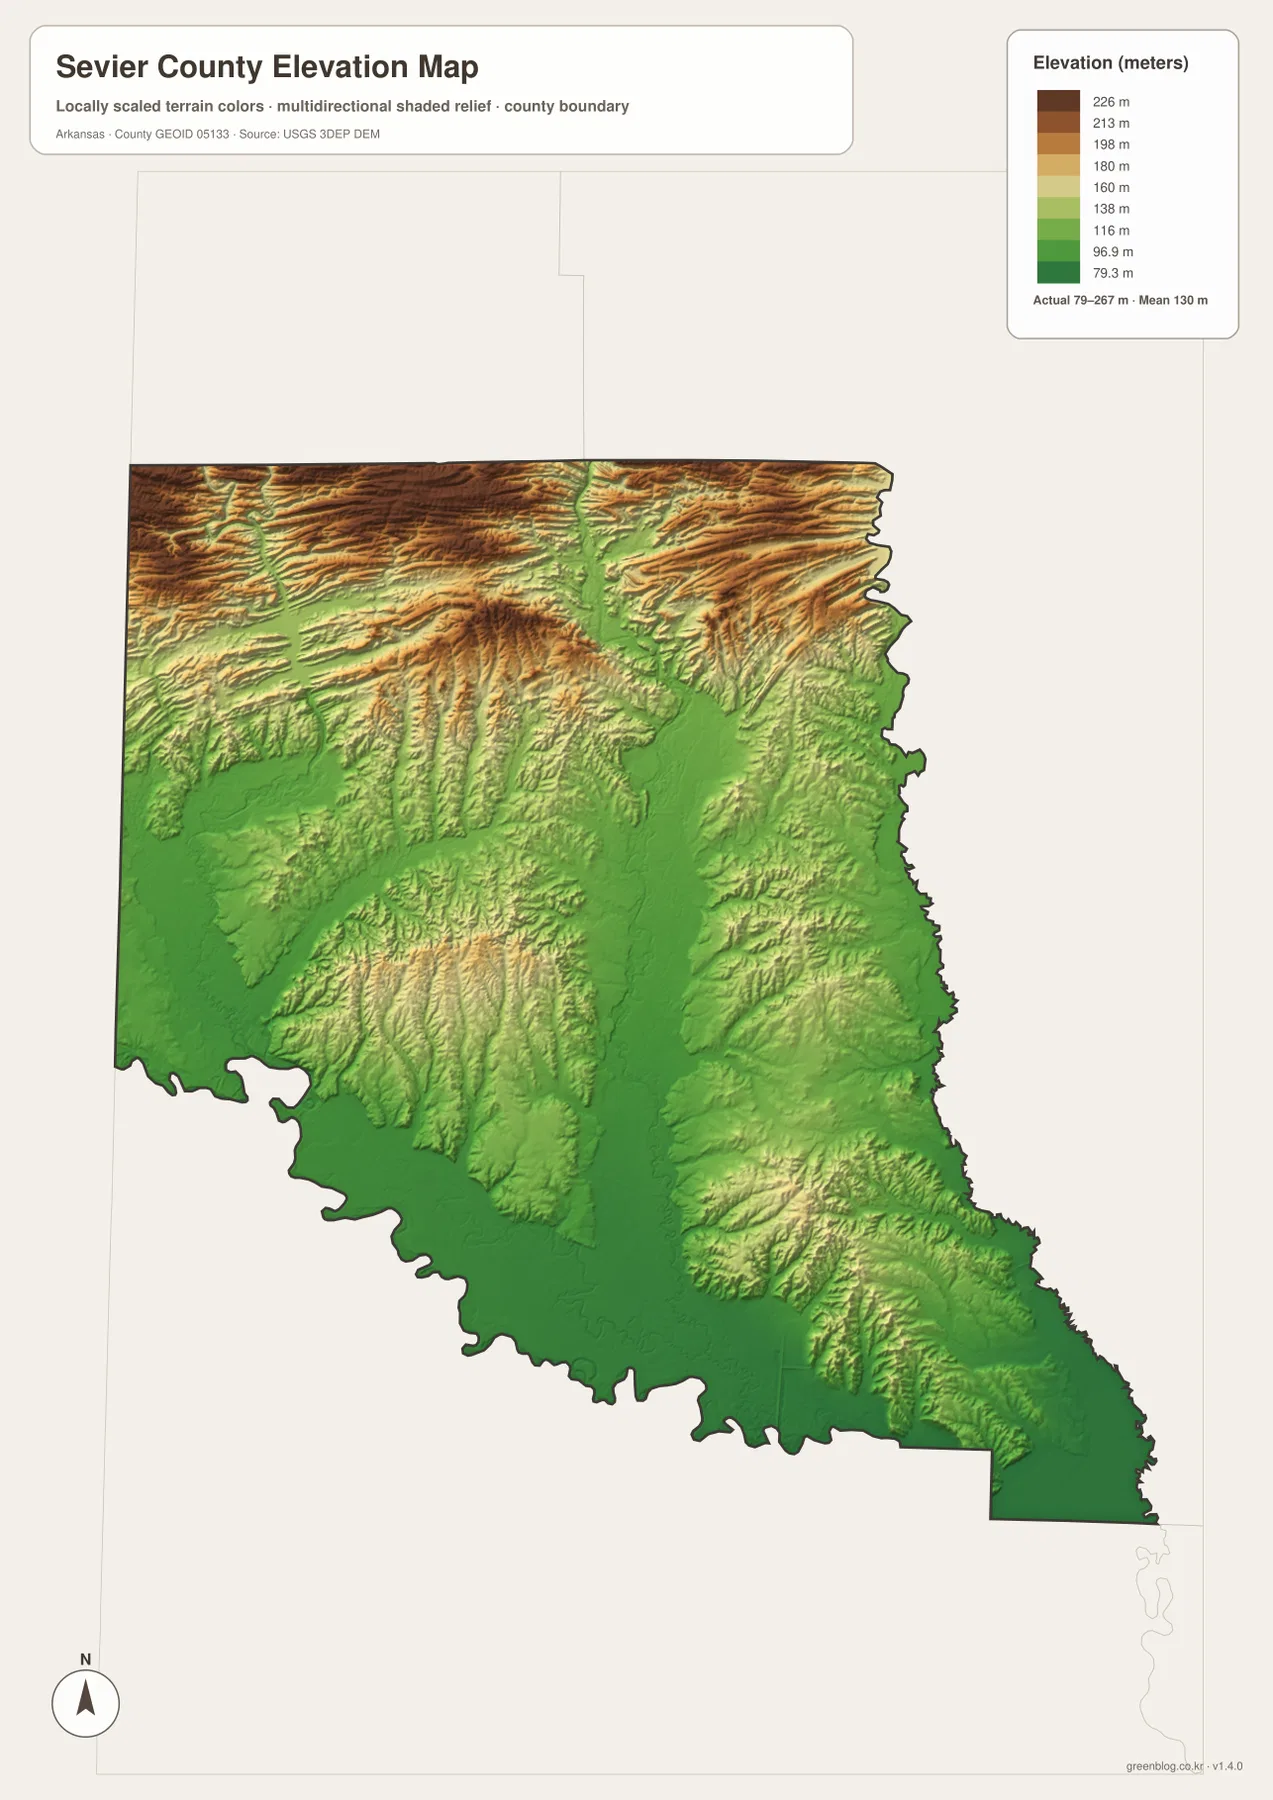
The Encyclopedia of Arkansas places Sevier County at the northern limit of the Gulf Coastal Plain, and the supplied elevation image makes that transition visible at county scale. The northern side has more pronounced relief, while the central and southern parts open into lower valleys connected to the county’s major rivers. This is why the water and elevation views complement each other particularly well for Sevier County.
The colors are intended to compare relative height across the county. They should not be used as survey-grade measurements for a building site, road design, drainage plan, or exact slope calculation. When precise elevations are required, detailed USGS 3D Elevation Program data or professional field measurements are more appropriate.
A simple route from De Queen helps connect roads, rivers, and terrain
For a first look, locate De Queen and use U.S. 70 and U.S. 71 to establish direction. U.S. 71 leads toward Gillham to the north and Horatio to the south, while U.S. 70 carries the eye eastward toward the road network leading to Lockesburg. Once those places are fixed, Ben Lomond identifies the southeastern extension of the county. This approach is easier than trying to follow every numbered route at once.
Next, add the water features. De Queen Lake marks the northwest, the Rolling Fork helps define the western drainage, and the Cossatot provides a long central reference. The Little River boundary marks the lower edge, while the Saline River helps identify the eastern side. These features explain why the county outline is irregular and why many smaller roads and settlements occupy lower corridors rather than the higher northern ridges.
The same sequence works when comparing elevation. Find Gillham and the northern boundary on the reference map, then look at the same area on the elevation image to see the higher ridge belt. Shift south toward De Queen and Horatio, and the colors drop into lower terrain. Move east toward Lockesburg and south toward Ben Lomond, and the map shows a mixture of low valleys and smaller hills rather than the stronger relief of the north.
Pick the map that matches the information you need
The general county map is the best choice for roads, communities, surrounding counties, and a quick overview of the boundary. The city-connection map removes much of that detail and makes the relative positions of De Queen and the other principal communities easier to compare. For rivers, lakes, and creek valleys, use the terrain-and-water view. For the contrast between the higher northern edge and lower southern country, the elevation map is the clearest option.
Two maps together can explain more than a single view. A lesson about De Queen can pair the reference map with the water map to show the town’s position south of De Queen Lake and near the Rolling Fork system. A discussion of Gillham and the northern part of the county can combine the road map with the elevation image. For Lockesburg and Ben Lomond, the water and elevation views help show how the eastern and southeastern valleys differ from the northern hills.
The WebP images on this page are sized for convenient viewing. The downloadable originals are 2572 × 3638-pixel JPG files, which are better suited to printing, zooming into labels, or inserting into a document. Keep the original aspect ratio when resizing so roads, rivers, and the county outline do not become distorted, and check your printer’s margins before producing an A3 copy.
Frequently Asked Questions
What is the county seat of Sevier County, Arkansas?
De Queen is the county seat. On the reference map, it is also the most useful orientation point because U.S. 70 and U.S. 71 meet in the area and connect toward Gillham, Horatio, Lockesburg, and the rest of the county.
Which waterways are most useful for understanding Sevier County?
De Queen Lake and the Rolling Fork are important in the northwest and west, while the Cossatot system runs through the central part of the county. The Little River forms the southern boundary, and the Saline River helps define the eastern side. Together they explain much of the county’s irregular shape and lower valley terrain.
Is the elevation map accurate enough for a property survey?
No. It is designed to compare higher and lower terrain across the county, not to provide parcel-level engineering or survey elevations. Use detailed official elevation data or a professional survey when exact measurements are required.
Map File Information
The ZIP contains the original Sevier County reference, city-connection, terrain-and-water, and elevation maps as high-resolution JPG files.
- Included Files: County reference map, city-connection map, terrain-and-water map, elevation map
- Printable Size: 2572 × 3638 pixels each
- File Type: Four high-resolution JPG files in one ZIP archive
Related Maps
Sources and References
- Sevier County Government – County History – Local history and official background on the Little, Saline, Cossatot, and Rolling Fork rivers.
- Encyclopedia of Arkansas – Sevier County – County-seat, geographic, historical, river, and lake background.
- U.S. Army Corps of Engineers – DeQueen Lake – Official information about De Queen Lake and its management.
- USGS National Hydrography – Official information about U.S. rivers, streams, lakes, and hydrographic data.
- USGS 3D Elevation Program – Official elevation and terrain data information.
Green Map creates custom-edited map images using open geographic data sources such as geoBoundaries, Natural Earth, OpenStreetMap, and government open data.
These maps are edited visual materials, not raw data files, and are provided for education, documents, presentations, and graphic reference.