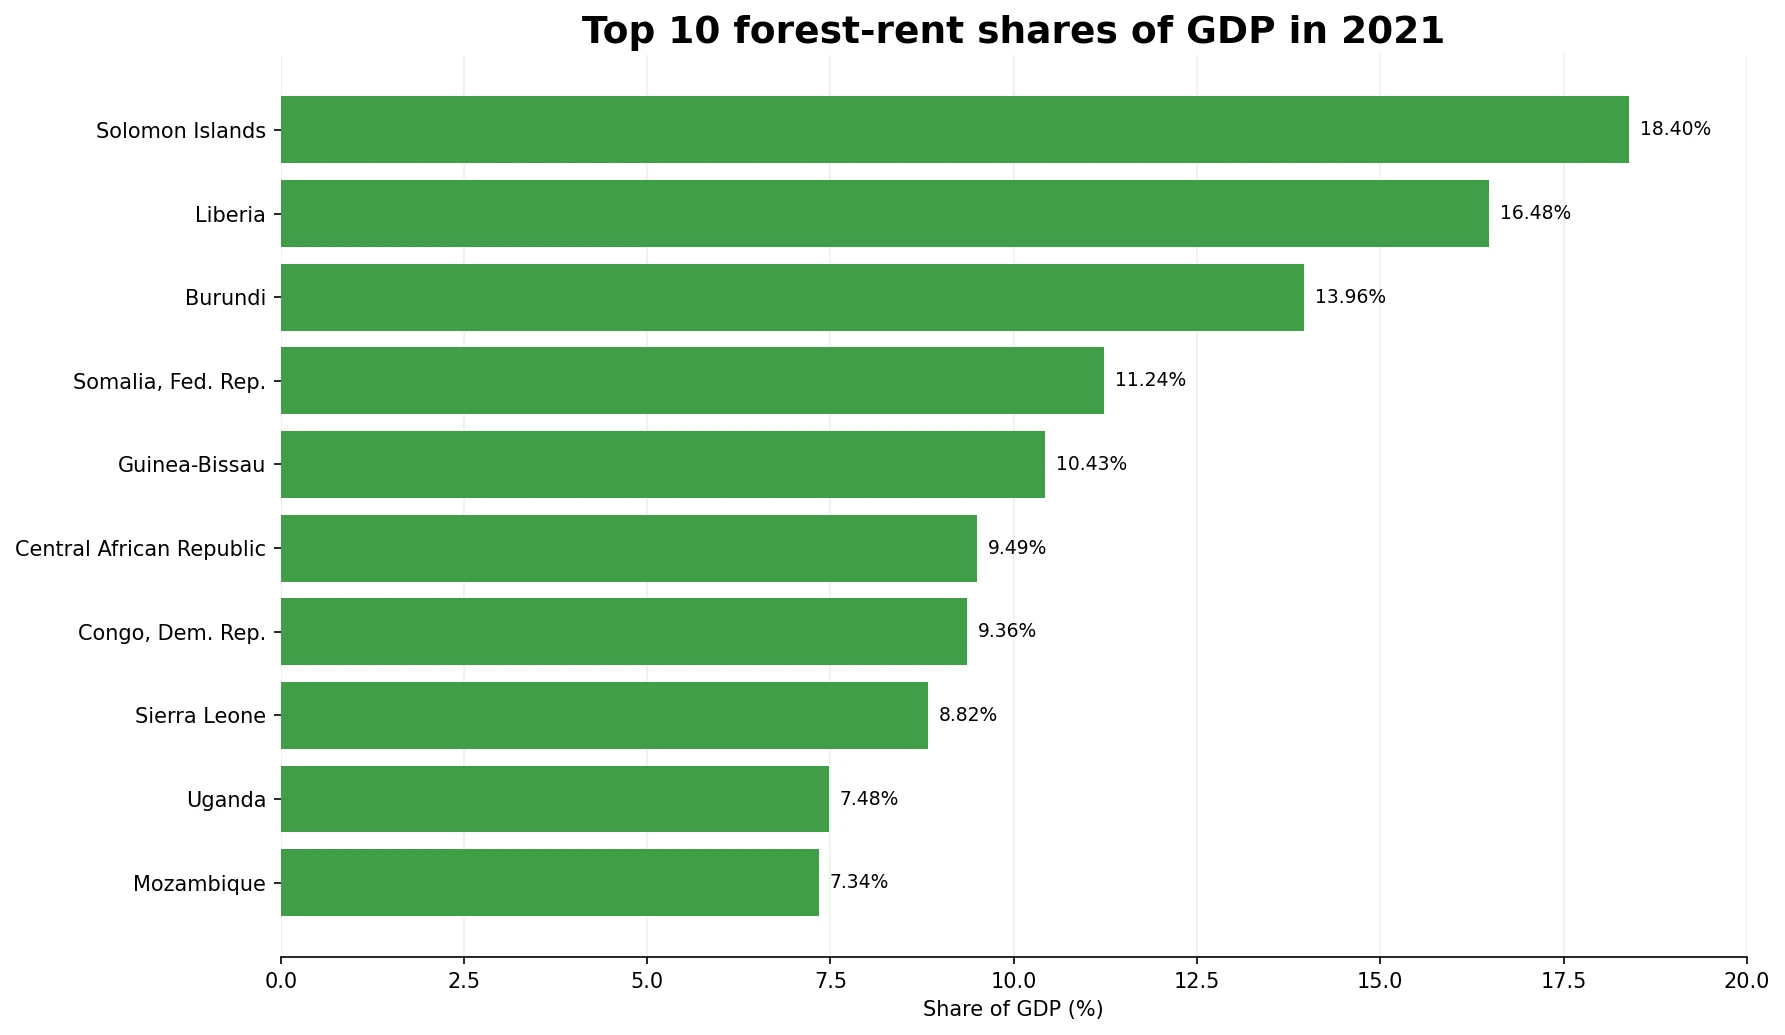
Countries with extensive forests are not necessarily the countries where forest rents make up the largest share of the economy. The World Bank indicator Forest rents (% of GDP) measures estimated economic rent associated with roundwood harvest relative to gross domestic product. Restricting the comparison to observations dated 2021 leaves 197 countries and separately reported economies. The Solomon Islands ranks first at 18.40% of GDP, followed by Liberia at 16.48% and Burundi at 13.96%. The median across the same 197 observations is only 0.164%, so the global distribution is dominated by many small values and a short upper tail of very large ones.
This measure should not be read as forest-sector sales, forest area, or the total value of everything forests provide. World Bank methodology for natural-resource rents is based on the difference between a resource price and average production or harvesting cost, applied to the physical quantity extracted or harvested. For forest rents, the metadata describes a calculation based on roundwood harvest, regional prices, and a regional rental rate. A high percentage therefore means that estimated forest rent was large relative to GDP in that year; it does not by itself say that a country has more forest, healthier forest, or more sustainable forestry.
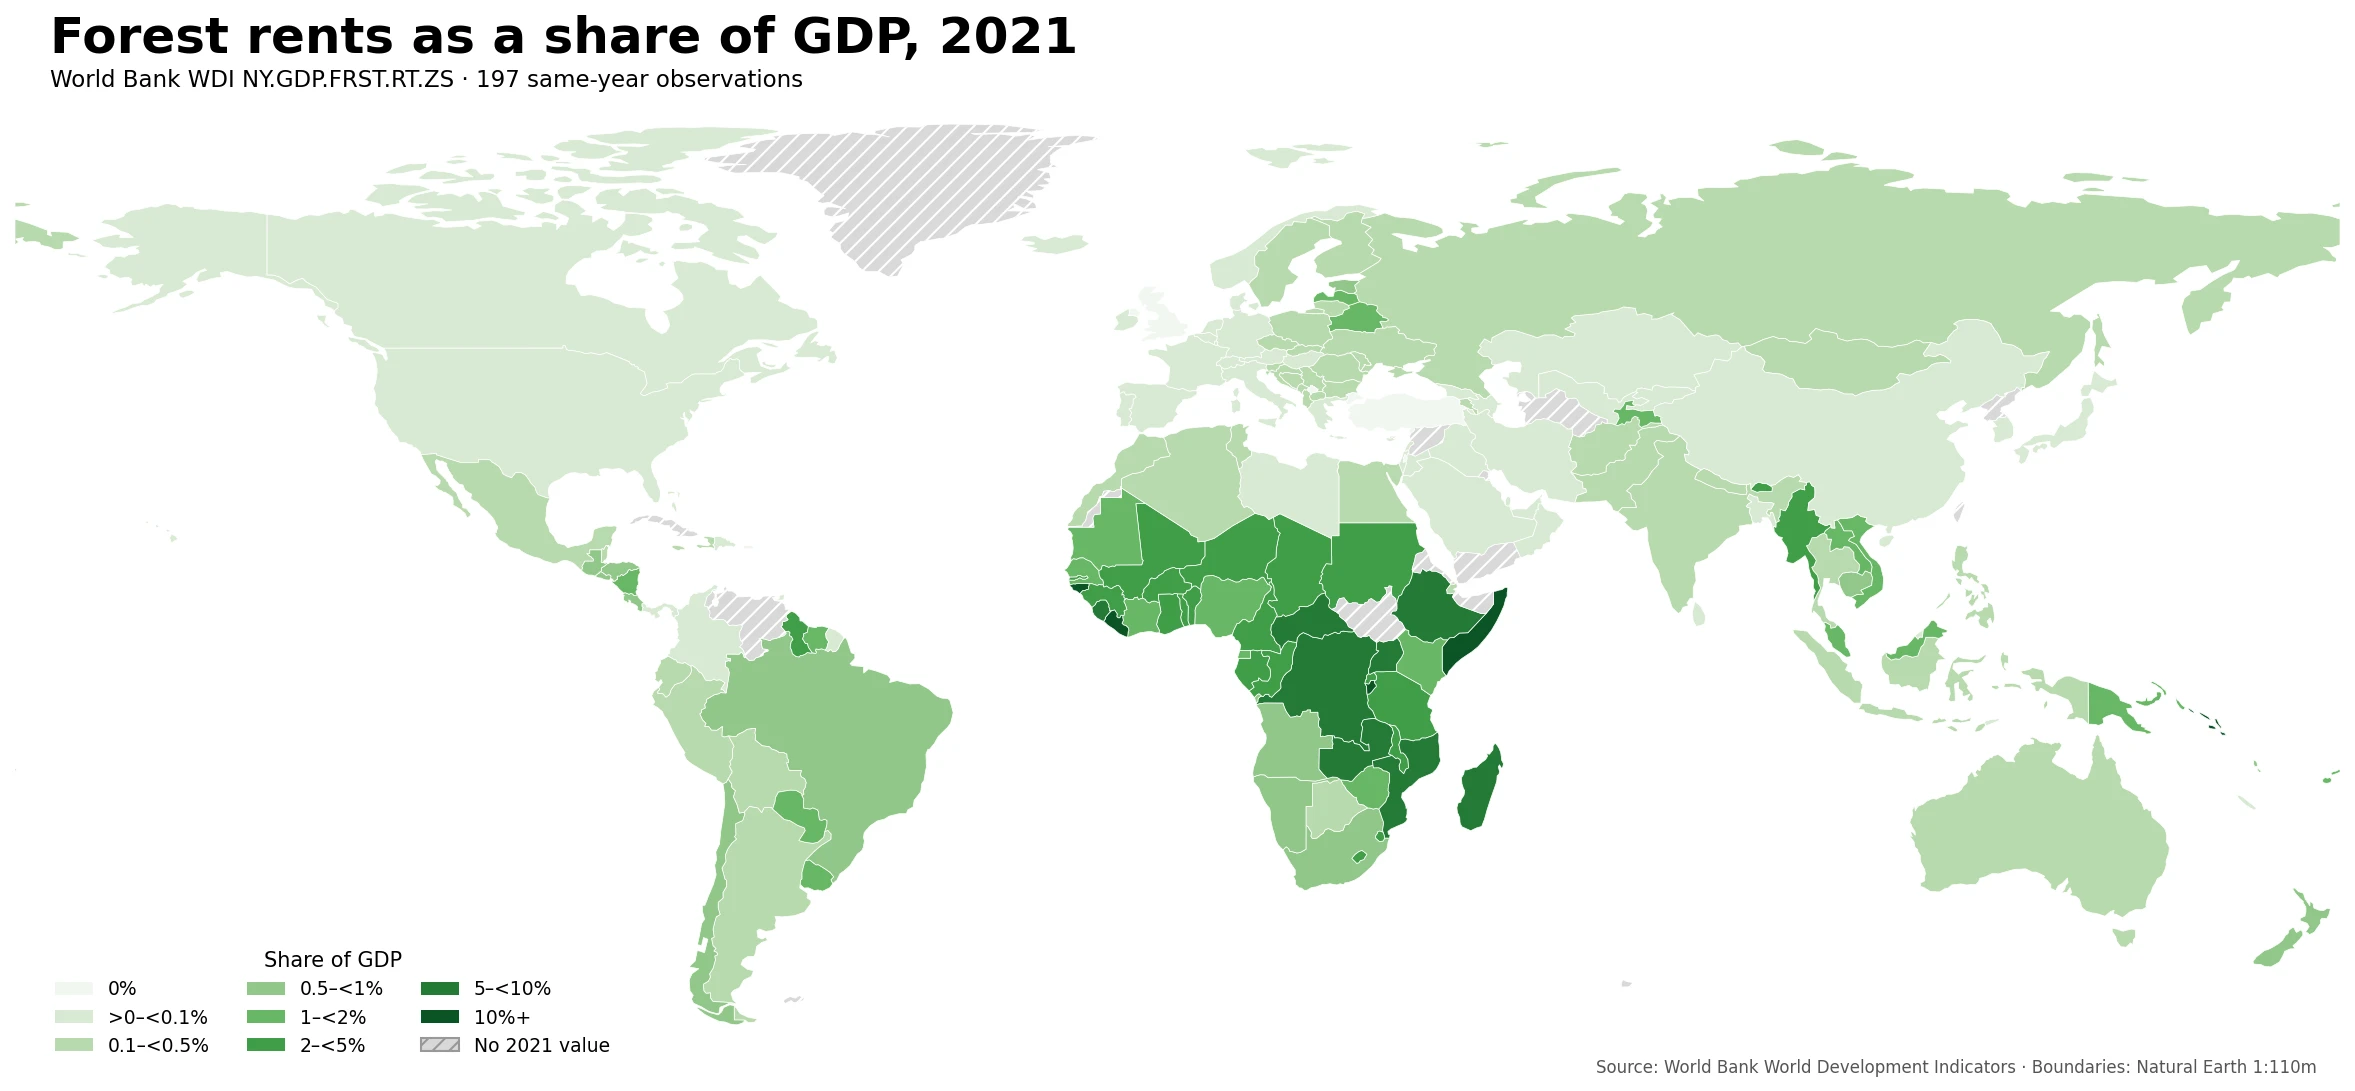
Table of Contents
A same-year comparison leaves 197 usable 2021 observations
The source series contains 214 latest non-empty country or economy observations, but 17 of those latest values are dated between 2007 and 2020. Venezuela, for example, has a latest retained observation from 2014, while several other economies end in 2018, 2019, or 2020. Mixing those values with 2021 data would turn a geographic comparison into a partly geographic and partly time-period comparison. Every ranking, distribution count, average, table, and map statistic in this article therefore uses only the 197 observations whose recorded year is actually 2021.
The World Bank metadata classifies the indicator as annual and lists a reference period of 1970–2021. That makes 2021 the most recent standardized year available for this indicator in the supplied WDI series, even though readers may be viewing the article several years later. Preserving the source period is more informative than silently substituting older values for countries without a 2021 observation or implying that the indicator has been updated to a later year when it has not.
Across the 197 same-year observations, the unweighted mean is 1.276% of GDP and the median is 0.164%. The mean is almost eight times the median because a small number of high values pull it upward. The first quartile is about 0.012% and the third quartile about 1.134%, meaning that the middle half of reported economies lies within a relatively narrow low range. Values above 5% or 10% are therefore not representative of the typical observation; they belong to the upper end of a strongly right-skewed distribution.
Africa contains the clearest cluster of high forest-rent shares
The geographic pattern is unusually concentrated. Nine of the ten highest 2021 observations are in Africa, and 19 of the top 20 are African. In West Africa, Liberia reaches 16.48%, Guinea-Bissau 10.43%, and Sierra Leone 8.82%. Central and eastern Africa contain Burundi at 13.96%, the Central African Republic at 9.49%, the Democratic Republic of the Congo at 9.36%, Uganda at 7.48%, and Zambia at 6.78%. Mozambique adds another high value at 7.34% in southeastern Africa.
The largest non-African outlier is the Solomon Islands at 18.40%, the highest value in the entire same-year sample and about 112 times the global median. Other Pacific economies sit much lower: Papua New Guinea is 1.96%, Fiji 1.13%, and Vanuatu 0.57%. This gap is a useful warning against treating a broad region as economically uniform. The indicator combines harvest quantities, price and cost assumptions, and the size of GDP, so countries that are geographically close or share similar forest biomes can still occupy very different parts of the scale.
Many European and East Asian economies lie in the lightest map classes. The Russian Federation is at 0.314%, Finland 0.294%, Sweden 0.180%, China 0.071%, Japan 0.029%, and South Korea 0.015%. These small percentages do not demonstrate that forestry is economically unimportant in those countries. GDP is the denominator, and the indicator measures resource rent rather than the full value added of logging, wood products, pulp and paper, furniture, transport, and other activities in the forest-based value chain.
The Solomon Islands, Liberia, and Burundi form the top three
| Rank | Country or economy | Forest rents, 2021 (% of GDP) |
|---|---|---|
| 1 | Solomon Islands | 18.40% |
| 2 | Liberia | 16.48% |
| 3 | Burundi | 13.96% |
| 4 | Somalia | 11.24% |
| 5 | Guinea-Bissau | 10.43% |
| 6 | Central African Republic | 9.49% |
| 7 | Democratic Republic of the Congo | 9.36% |
| 8 | Sierra Leone | 8.82% |
| 9 | Uganda | 7.48% |
| 10 | Mozambique | 7.34% |
Only five observations exceed 10% of GDP. Even Mozambique in tenth place, at 7.34%, is roughly 45 times the median. A single continuous color scale would allow those upper-tail values to dominate the map and make differences among the many low observations almost invisible. The choropleth therefore uses separate classes for 0%, above 0–0.1%, 0.1–0.5%, 0.5–1%, 1–2%, 2–5%, 5–10%, and 10% or more.
142 of 197 observations are below 1% of GDP
Low values are much more common than the top-ten table might suggest. Twenty-one observations are reported at 0%, and 84 are below 0.1%. Expanding the threshold to below 1% captures 142 of the 197 observations, or about 72% of the sample. At the other end, only 34 reach at least 2%, 13 reach at least 5%, and five reach at least 10%. The median of 0.164% is therefore a better description of the middle country or economy than the much higher simple mean of 1.276%.
| Share of GDP | Number of observations | Interpretation |
|---|---|---|
| 0% | 21 | Reported as zero for this specific forest-rent indicator in 2021 |
| >0–<0.1% | 63 | Very small share |
| 0.1–<0.5% | 45 | Small share |
| 0.5–<1% | 13 | Below 1% but above most of the lowest observations |
| 1–<2% | 21 | Clearly above the global median |
| 2–<5% | 21 | Upper part of the distribution |
| 5–<10% | 8 | High share |
| 10%+ | 5 | Extreme upper class |
A reported 0% should not be translated into “no forest.” It is a zero for this particular economic-rent calculation. Forest area, timber harvest, forestry employment, forest-product manufacturing, biodiversity, and carbon storage are different variables. A heavily forested country can have a very small forest-rent share of GDP, while a country with a smaller forest area can record a larger ratio if its harvest-related rent is large relative to the overall economy.
Neighboring countries can occupy very different classes
The map also exposes sharp border-to-border contrasts. Liberia is at 16.48%, while neighboring Côte d’Ivoire is 1.22%, a difference of about 15.26 percentage points. Burundi is 13.96%, compared with Rwanda at 3.97% and Tanzania at 2.39%. Uganda is 7.48% while Kenya is 1.22%, even though the two share a long border. These differences are too large to treat the African high-value cluster as a single uniform block.
The Democratic Republic of the Congo records 9.36%, while the Republic of the Congo is 2.97% and Angola 0.68%. Geographic proximity alone cannot explain the ratio. Roundwood harvest, prices, average harvesting costs, the rental-rate assumptions used in the World Bank methodology, and GDP all matter. Border contrasts identify places where further forestry and economic data may be worth examining; they do not establish why one country has a higher value than another.
Selected large and familiar economies show why forest area and forest rent are different questions
| Country | Forest rents, 2021 (% of GDP) |
|---|---|
| Democratic Republic of the Congo | 9.36% |
| Uganda | 7.48% |
| Gabon | 2.65% |
| Tanzania | 2.39% |
| Papua New Guinea | 1.96% |
| Malaysia | 1.70% |
| Brazil | 0.76% |
| Indonesia | 0.42% |
| Russian Federation | 0.31% |
| Finland | 0.29% |
| Sweden | 0.18% |
| China | 0.07% |
| Canada | 0.07% |
| United States | 0.04% |
| Japan | 0.03% |
| Korea, Rep. | 0.01% |
Brazil is known for its enormous absolute forest area and a high forest share of land, yet its forest-rent ratio in this series is 0.76%. Canada is 0.07% and the United States 0.04%. By contrast, Liberia and Burundi are far higher relative to GDP. This is not a ranking of how much forest each country possesses. It is a ratio between estimated forest-resource rent and the size of the national economy, so large and diversified economies can have small percentages even when forestry activity is substantial in absolute terms.
Finland and Sweden provide another useful example. Both have extensive forest-based industries, but their forest-rent shares are below 0.3%. That does not mean their wood, pulp, paper, engineered timber, furniture, transport, and related services contribute only the same tiny percentages to GDP. The WDI forest-rent indicator has a narrower resource-rent concept. Sector value added and manufacturing output require separate national-accounts or industry indicators.
What does Forest rents (% of GDP) actually measure?
The official WDI code is NY.GDP.FRST.RT.ZS. The World Bank metadata defines forest rents using roundwood harvest together with regional prices and a regional rental rate. The broader natural-resource-rent methodology estimates unit rent as the resource price minus average unit production or harvesting cost, then multiplies that rent by the physical quantity extracted or harvested. The resulting forest rent is expressed here as a percentage of GDP.
“Rent” in this context does not mean a lease payment. It is also not gross timber sales, accounting profit for forestry companies, the market value of all forests, or the combined value of ecosystem services. Carbon storage, watershed protection, recreation, biodiversity, and many other forest benefits are outside this single indicator. A practical plain-language reading is: how large the estimated economic rent from roundwood harvesting was relative to the size of the economy in 2021.
A higher ratio is not automatically good or bad. It does not reveal whether harvest levels are sustainable, whether forest area is rising or falling, how revenues are distributed, or whether public and private institutions reinvest the proceeds. A low ratio likewise does not prove that a country lacks forest resources or manages them sustainably. Those questions require separate physical forest, depletion, governance, trade, employment, and fiscal data.
Forest area and net forest depletion add different context
Forest area as a share of land answers a physical land-cover question: what portion of national land is classified as forest? Forest rents answer an economic-ratio question tied to roundwood harvest. The two can move independently. A country can be heavily forested yet have a modest rent-to-GDP ratio, or have a smaller forest share but a larger rent ratio because its harvest-related rent is high relative to GDP.
Net forest depletion is different again. World Bank adjusted-savings indicators estimate depletion when roundwood harvest exceeds natural growth and apply resource rents to that excess. Forest rents do not require the same “harvest above natural growth” condition. Reading the forest-rent map alongside forest-area and net-depletion maps therefore prevents a common mistake: interpreting a high economic-rent share as direct evidence of forest loss or unsustainable harvesting.
Data source and mapping method
The numeric source is World Bank World Development Indicators series NY.GDP.FRST.RT.ZS. The metadata lists the unit as a percentage share of GDP, the frequency as annual, and the reference period as 1970–2021. For the geographic comparison, only the 197 observations dated 2021 are retained. Seventeen latest non-empty observations dated from 2007 through 2020 are excluded from rankings and map statistics rather than backfilled, converted to zero, or blended into the 2021 comparison.
ISO-3 country codes are joined to a simplified Natural Earth 1:110m country boundary layer. All 197 same-year observations remain in the statistical calculations, while 160 can be rendered directly as polygons at this map scale. Small islands and separately reported territories may therefore have valid 2021 values without appearing as distinct filled shapes on the world map.
The indicator definition and methodology can be checked in the World Bank WDI Metadata Glossary. Country observations are available through the World Bank API. The geographic boundary source is Natural Earth 1:110m Cultural Vectors.
Frequently Asked Questions
What does forest rents as a share of GDP measure?
World Bank NY.GDP.FRST.RT.ZS expresses estimated forest-resource rent associated with roundwood harvest as a percentage of GDP. It is not gross timber revenue or forest area.
Which country has the highest 2021 forest-rent share?
Among the 197 observations dated 2021, the Solomon Islands is highest at about 18.40% of GDP, followed by Liberia at 16.48% and Burundi at 13.96%.
Why are only 197 of the 214 latest observations used?
Seventeen latest non-empty observations are dated from 2007 through 2020. They are excluded so rankings and map statistics compare one common reference year rather than mixing periods.
Does a high forest-rent share mean more forest or more deforestation?
No. The indicator measures economic rent relative to GDP. Forest area and net forest depletion answer different physical and sustainability questions and should be checked separately.
Related Articles
These Green Map comparisons help separate forest economic rent from broader resource rents, forest depletion, forest extent, and sector value added.
- How Large Are Natural Resource Rents Relative to GDP? 2021 World Map
- Global Net Forest Depletion Map – 2021 Country Comparison
- Global Forest Area Share Map – 2023 Country Comparison
- Global Agriculture, Forestry and Fishing Value Added Map – 2024 Country Comparison
Green Map creates custom-edited map images using open geographic data sources such as geoBoundaries, Natural Earth, OpenStreetMap, and government open data.
These maps are edited visual materials, not raw data files, and are provided for education, documents, presentations, and graphic reference.