You can download four high-resolution JPG maps of Lyman County in one ZIP while using the page to compare roads, communities, waterways, and elevation. Oacoma sits at the eastern edge beside the Missouri River, while Kennebec and Presho lie farther west along the county’s main east-west travel corridor. The county outline follows broad river bends on the north and east and becomes irregular again along the White River on the south. The elevation map adds another layer to that picture, with higher ground across much of the west and a second high area in the narrow southeastern section.
The four supplied maps are most useful when read as views of the same county rather than as separate illustrations. The general map is best for placing Oacoma, Kennebec, Presho, Vivian, and the numbered highways. The city-connections map simplifies that picture by using Oacoma as a hub and showing straight-line distances to Reliance, Kennebec, and Presho. The water map brings out the White River, Medicine Creek, Cedar Creek, American Crow Creek, and several small lakes, while the elevation map shows an actual range of about 413 to 682 meters with a mean near 537 meters.
Lyman County has a shape that is easy to recognize once the river boundaries are noticed. Its main body stretches west from the Missouri River, then a narrower southeastern section drops below the rest of the county. The map also shows West Brule and Fort Thompson near the northeastern river bends, with Chamberlain across the river from the Oacoma area. Those outside labels help orient the county, but the article concentrates on places and features inside the supplied Lyman County maps.
Table of Contents
Follow the main road corridor west from Oacoma to Kennebec and Presho
Oacoma is the clearest eastern reference point on the county map. The Missouri River forms the large curving edge beside it, and Chamberlain is labeled on the opposite side. From Oacoma, Interstate 90 runs west across the county toward Kennebec and Presho, creating the strongest continuous road line on the map. Other numbered routes branch from that corridor: 248 appears near the east-central section, 273 near Kennebec, and 183 farther south of the main route. At the western side, Vivian appears close to the 83 and 16 labels, while the long southeastern extension contains 49 and 47.
The boundary itself is part of what makes this map useful. South Dakota law describes the Missouri River and White River as important parts of the county boundary, and the supplied map shows the same broad shape. The northern and eastern edges curve with the Missouri, while the southern edge becomes jagged where the White River bends. In contrast, several western and interior boundary segments are comparatively straight. Once this outline is familiar, it becomes much easier to transfer a place from the road map to the water or elevation map without losing orientation.
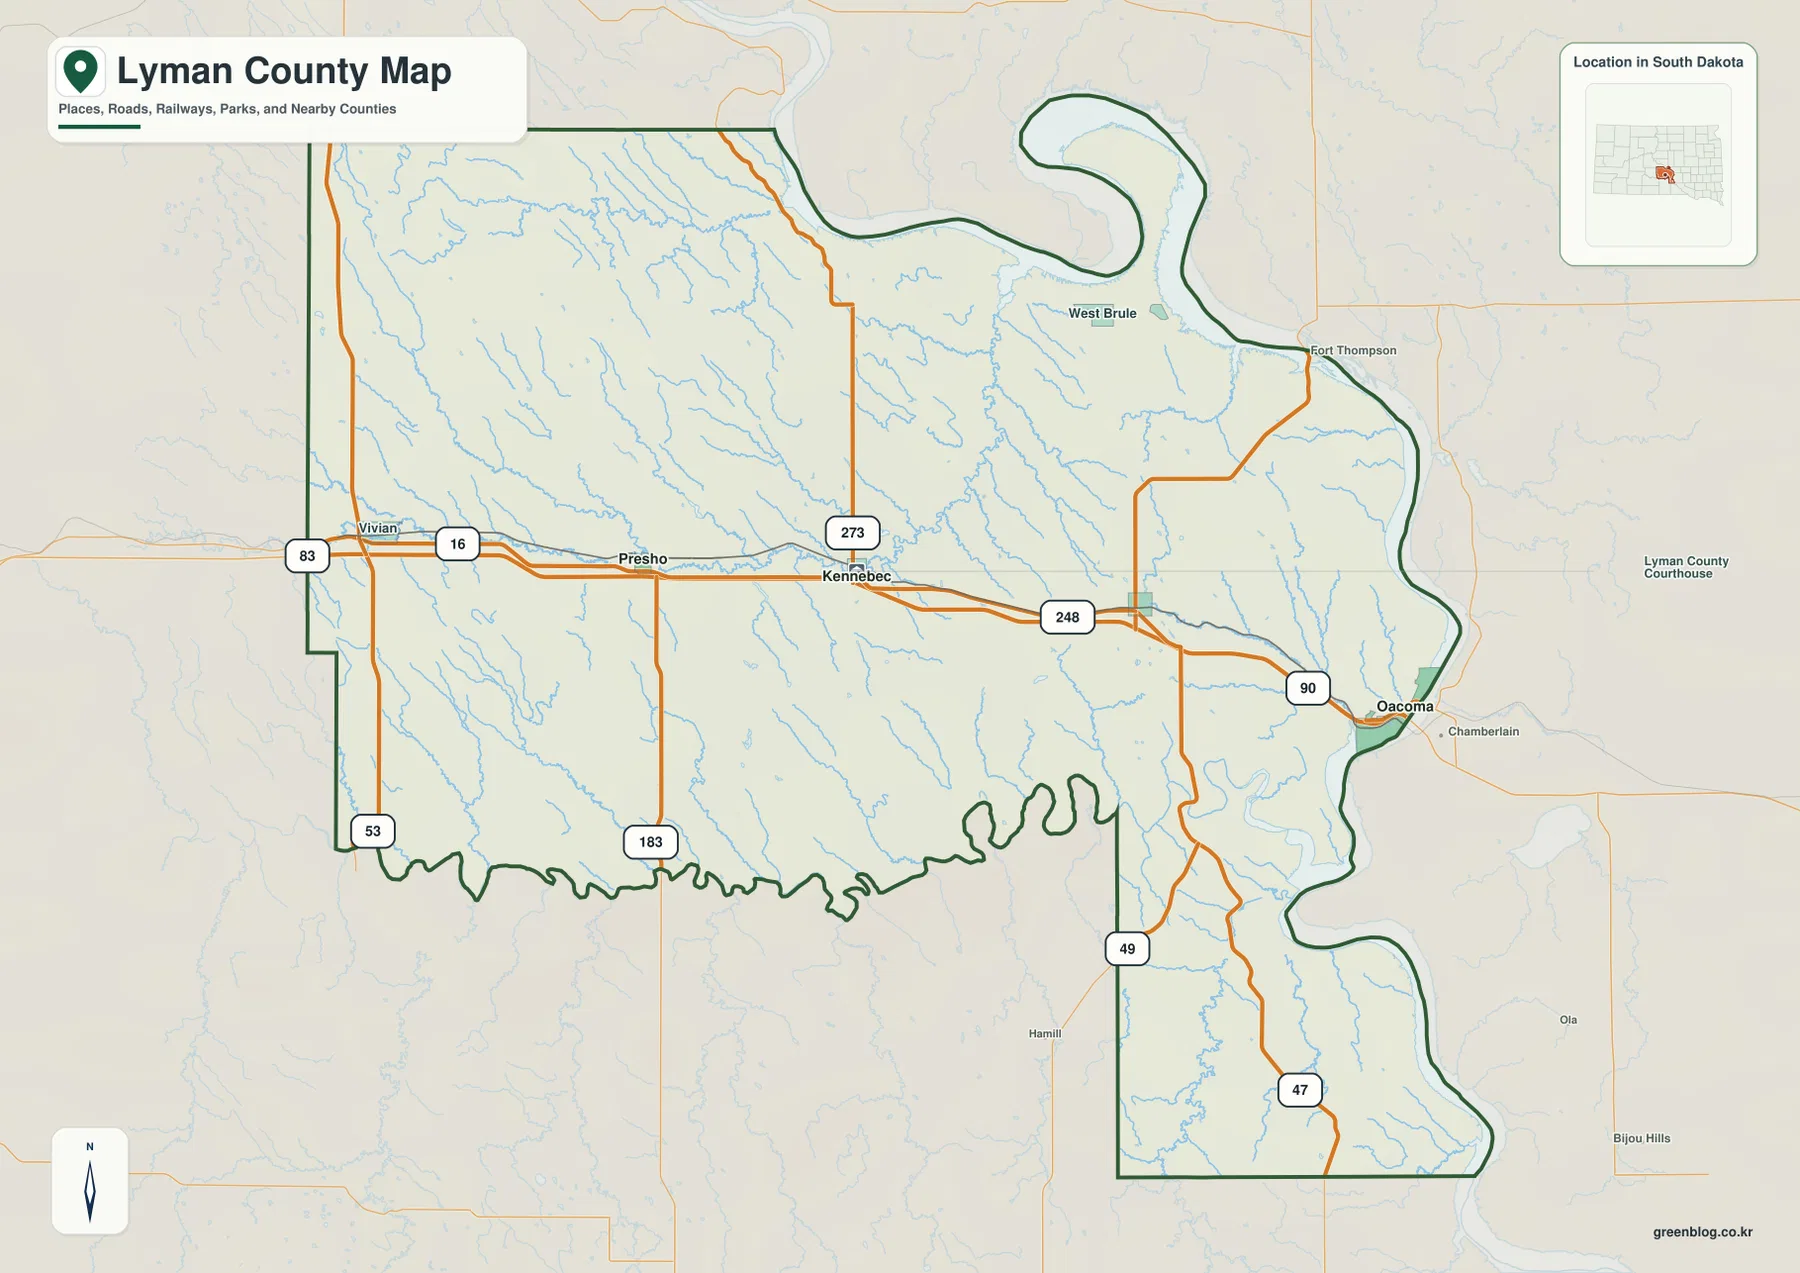
This general map is a location reference rather than a live transportation map. It does not show current closures, construction zones, travel times, or road conditions, and the county outline should not be treated as a parcel or property boundary. For those purposes, current transportation or land-record sources are needed. The value of this image is that it gives the towns, road numbers, neighboring labels, and distinctive county outline in one view before the more specialized maps are introduced.
The Oacoma hub map places Reliance, Kennebec, and Presho at clear intervals
The city-connections map uses Oacoma as the hub. Reliance lies closest to it, Kennebec is farther west, and Presho is farther west again. The legend gives direct distances of about 13 miles from Oacoma to Reliance, 26 miles to Kennebec, and 36 miles to Presho. The three destinations line up broadly with the same east-west corridor visible on the general map, so the simplified city view makes the spacing between those communities easier to understand.
Those numbers are straight-line distances, not driving distances. A road trip may be longer because the route must follow actual highways, intersections, and access roads. The map is therefore best used to compare relative location rather than to estimate travel time. Vivian appears on the general county map but is not included in this particular connection set, so no Oacoma-to-Vivian distance should be inferred from the image.
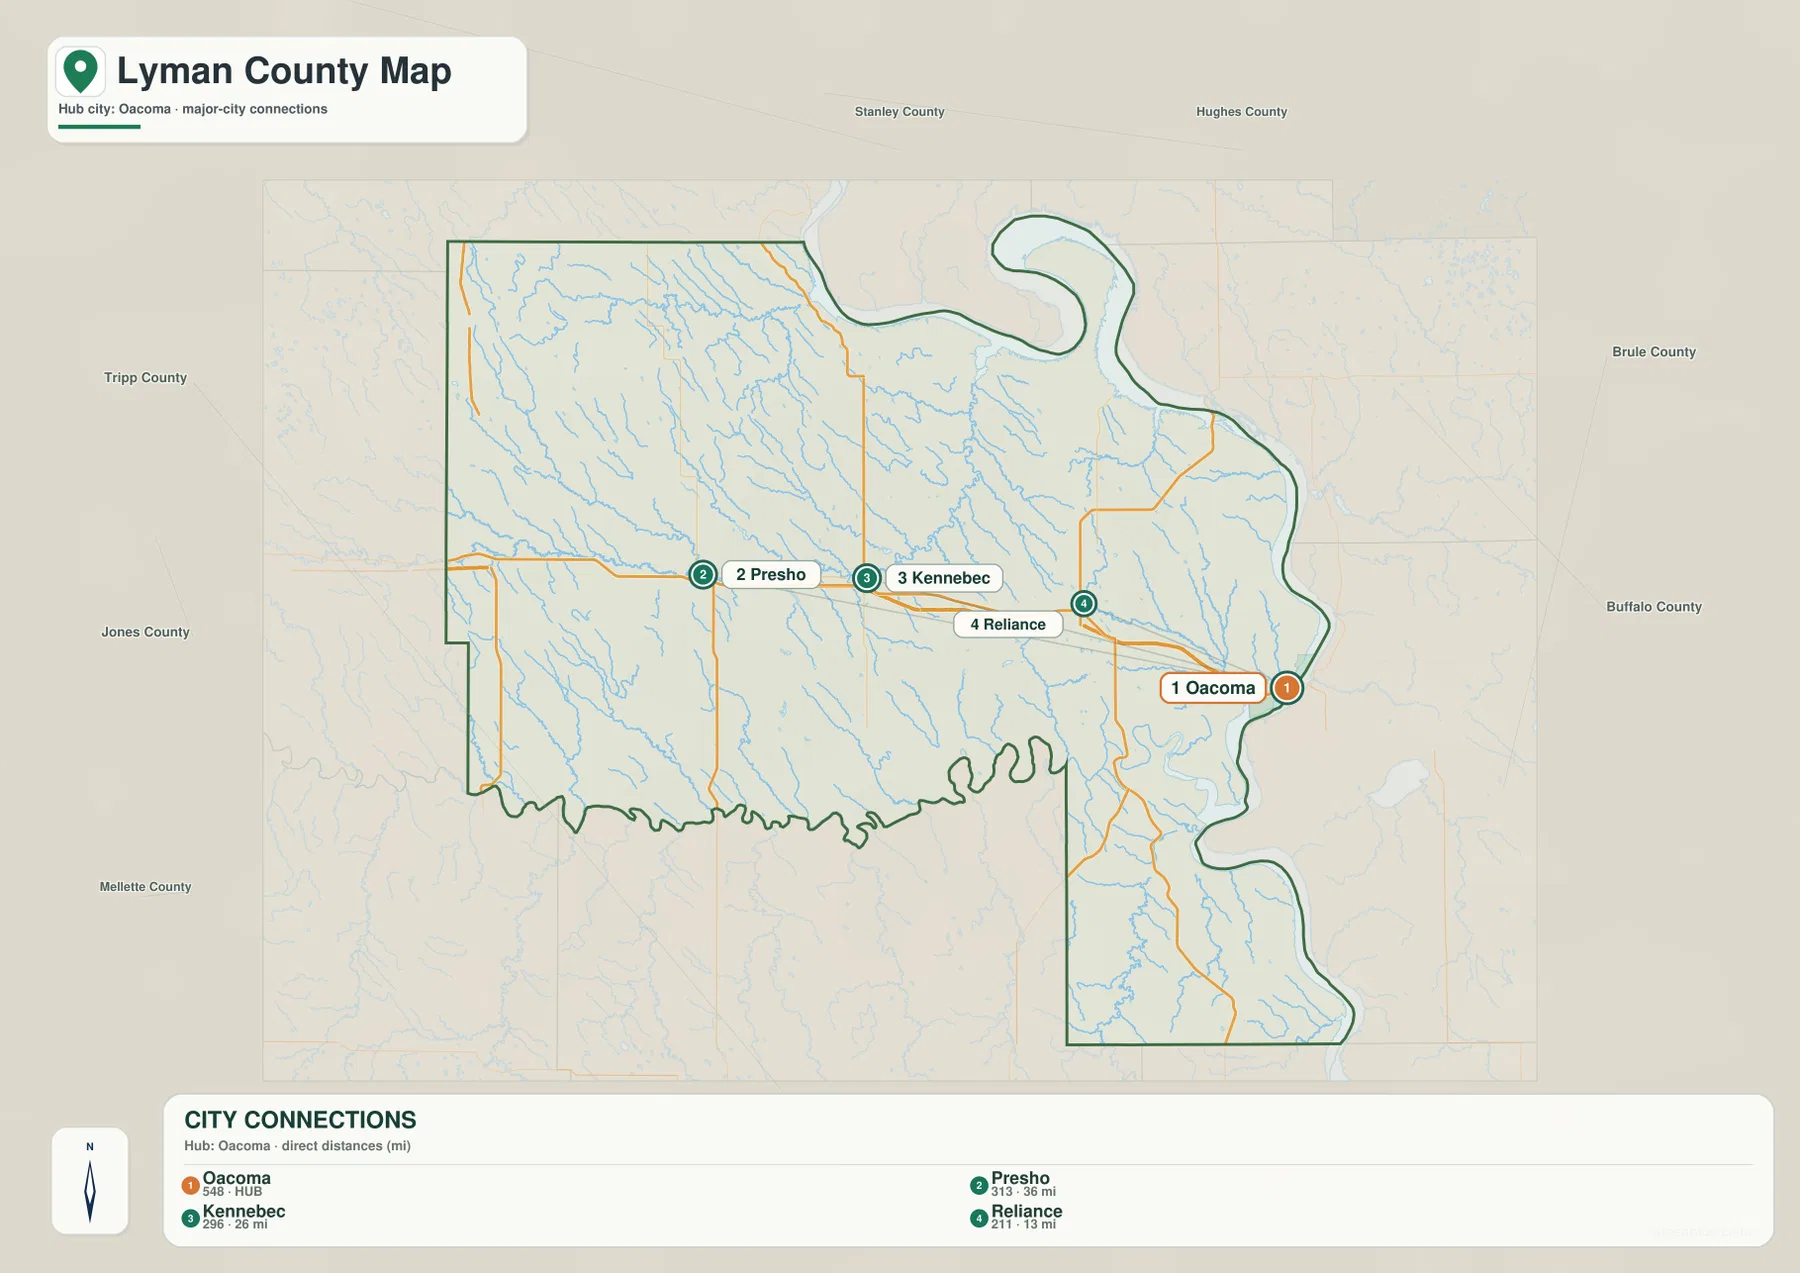
The numbered circles on the city map identify the places in the connection set; they are not highway numbers. That distinction matters because the county’s road map also contains many numbered route shields. If the goal is to plan a drive, use a current routing service. If the goal is to see how the major communities are distributed across the central and eastern part of Lyman County, this map provides a much cleaner view than the more detailed road map.
White River, Medicine Creek, and smaller tributaries divide the county into distinct valleys
The water and terrain map changes the emphasis from roads to drainage. White River is the major named river along the southern part of the county. It enters from the west, follows a strongly winding course along part of the county edge, and continues toward the Missouri River. Medicine Creek crosses the west-central part of the county and is joined by a dense network of smaller channels. Farther north, Cedar Creek is labeled across the upper part of the map, while Stony Butte Creek appears in the west-central area.
The eastern half contains a different mix of waterways and small lakes. American Crow Creek runs toward the Missouri River near the east-central side. Reliance Lake and Heap Lake are shown nearby, while Kennebec Lake and Jackson Lake sit farther west and south. In the narrow southeastern section, Bull Creek and Lake Agnes stand out. The result is not a county dominated by one single internal stream; instead, several creek systems and small lakes feed toward the large river boundaries.
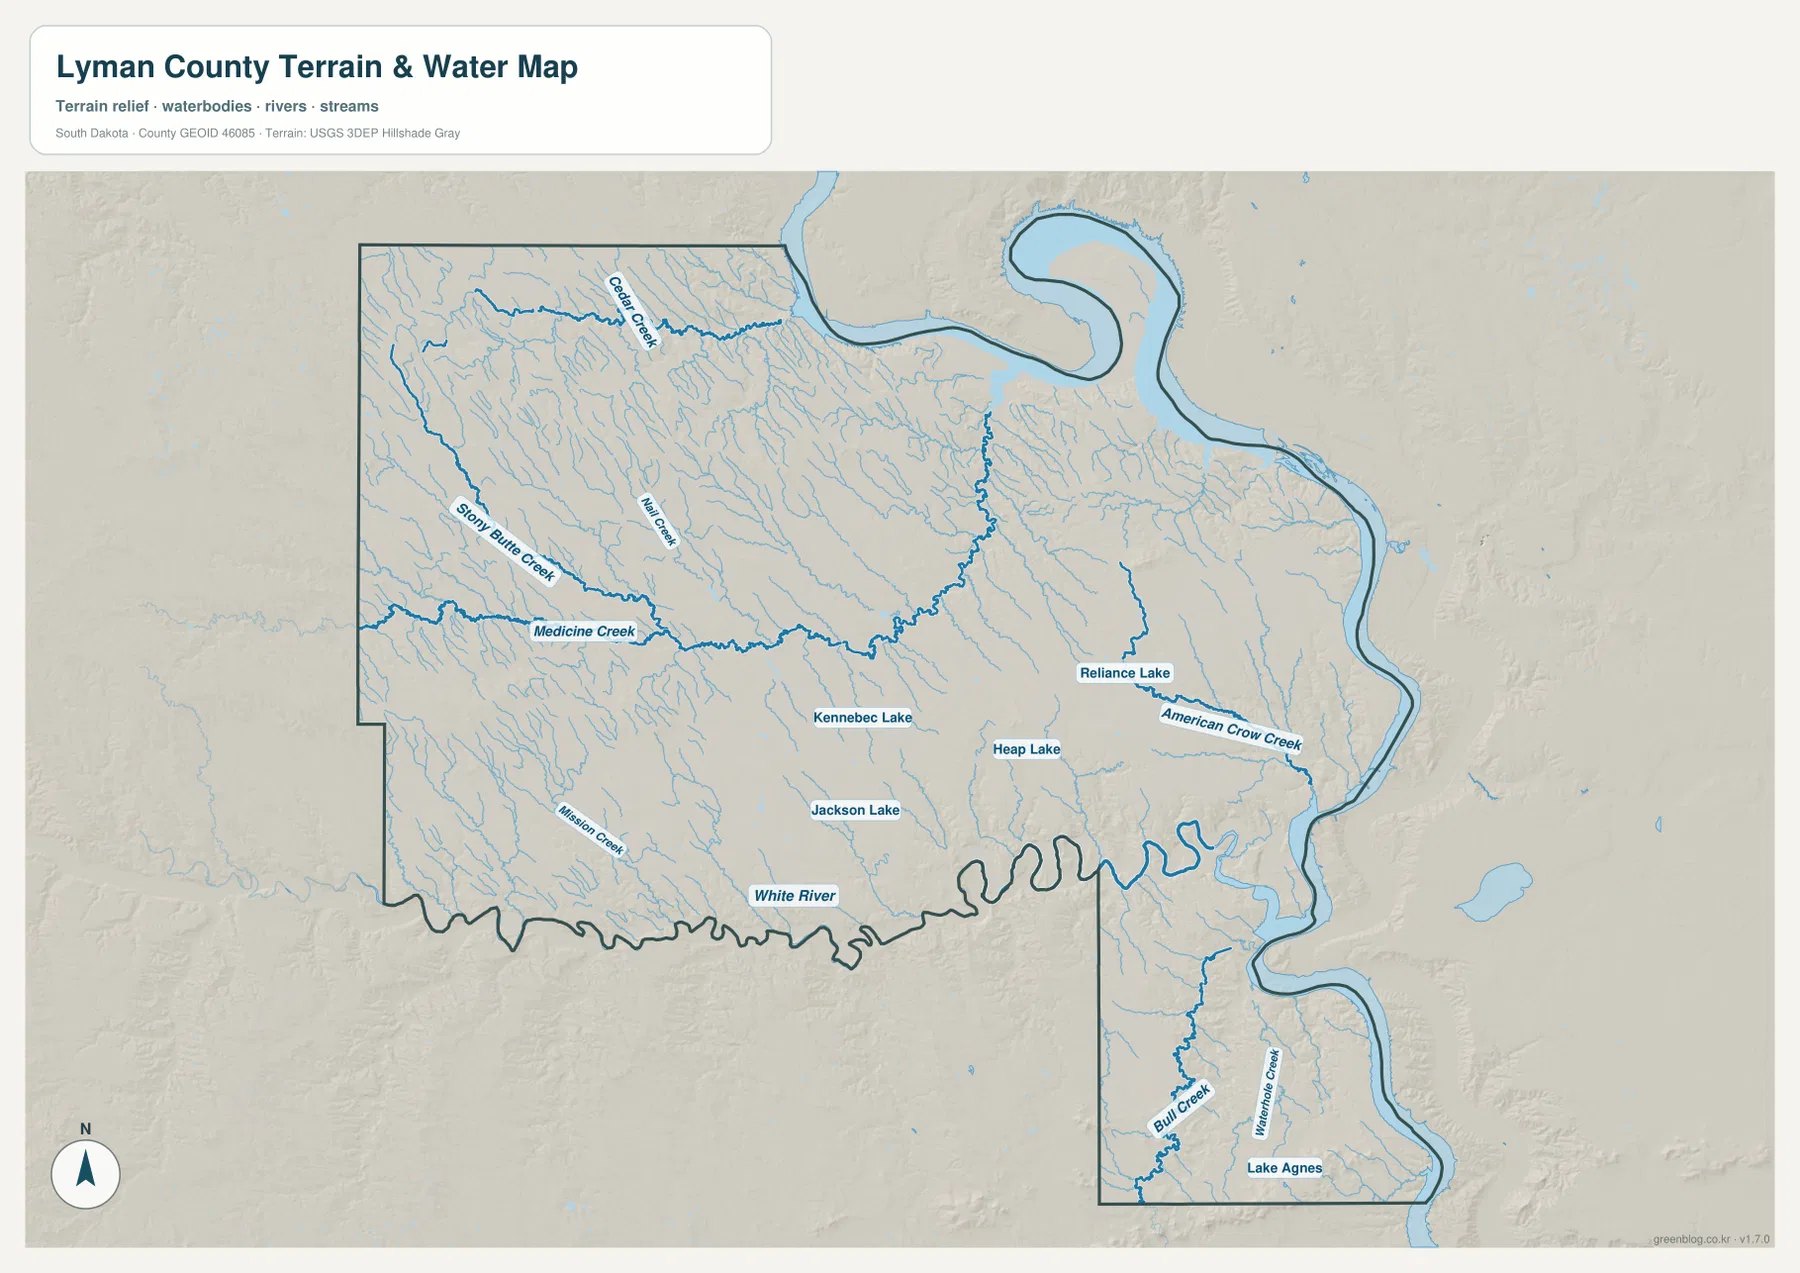
This is a reference map for named water features and terrain, not a flood, navigation, or real-time water-level product. A blue line does not indicate constant flow, a safe crossing, or a particular water depth. Stream conditions can change with season and weather, and legal water boundaries require appropriate official records. For current hydrography, the USGS National Hydrography program is the better source to consult alongside this map.
Elevation rises across the west while river valleys remain lower
The elevation legend shows an actual county range of roughly 413 to 682 meters and a mean of about 537 meters. Much of the western side appears in tan and brown shades, indicating higher ground than the large river corridors. A second high area is visible at the southern tip of the narrow southeastern section. By contrast, the northern and eastern bends near the Missouri River are shown in darker green, and lower channels cut through the interior wherever streams descend toward the larger rivers.
The difference between the lowest and highest values is about 269 meters. That change is large enough to produce a clear contrast between uplands and river valleys on a county-scale map. Medicine Creek and White River correspond with lower incised areas in many places, and small tributaries create branching green corridors within the higher terrain. The western edge does not form one flat plateau; ridges, slopes, and narrow valleys break it into a more varied surface than the general road map alone suggests.
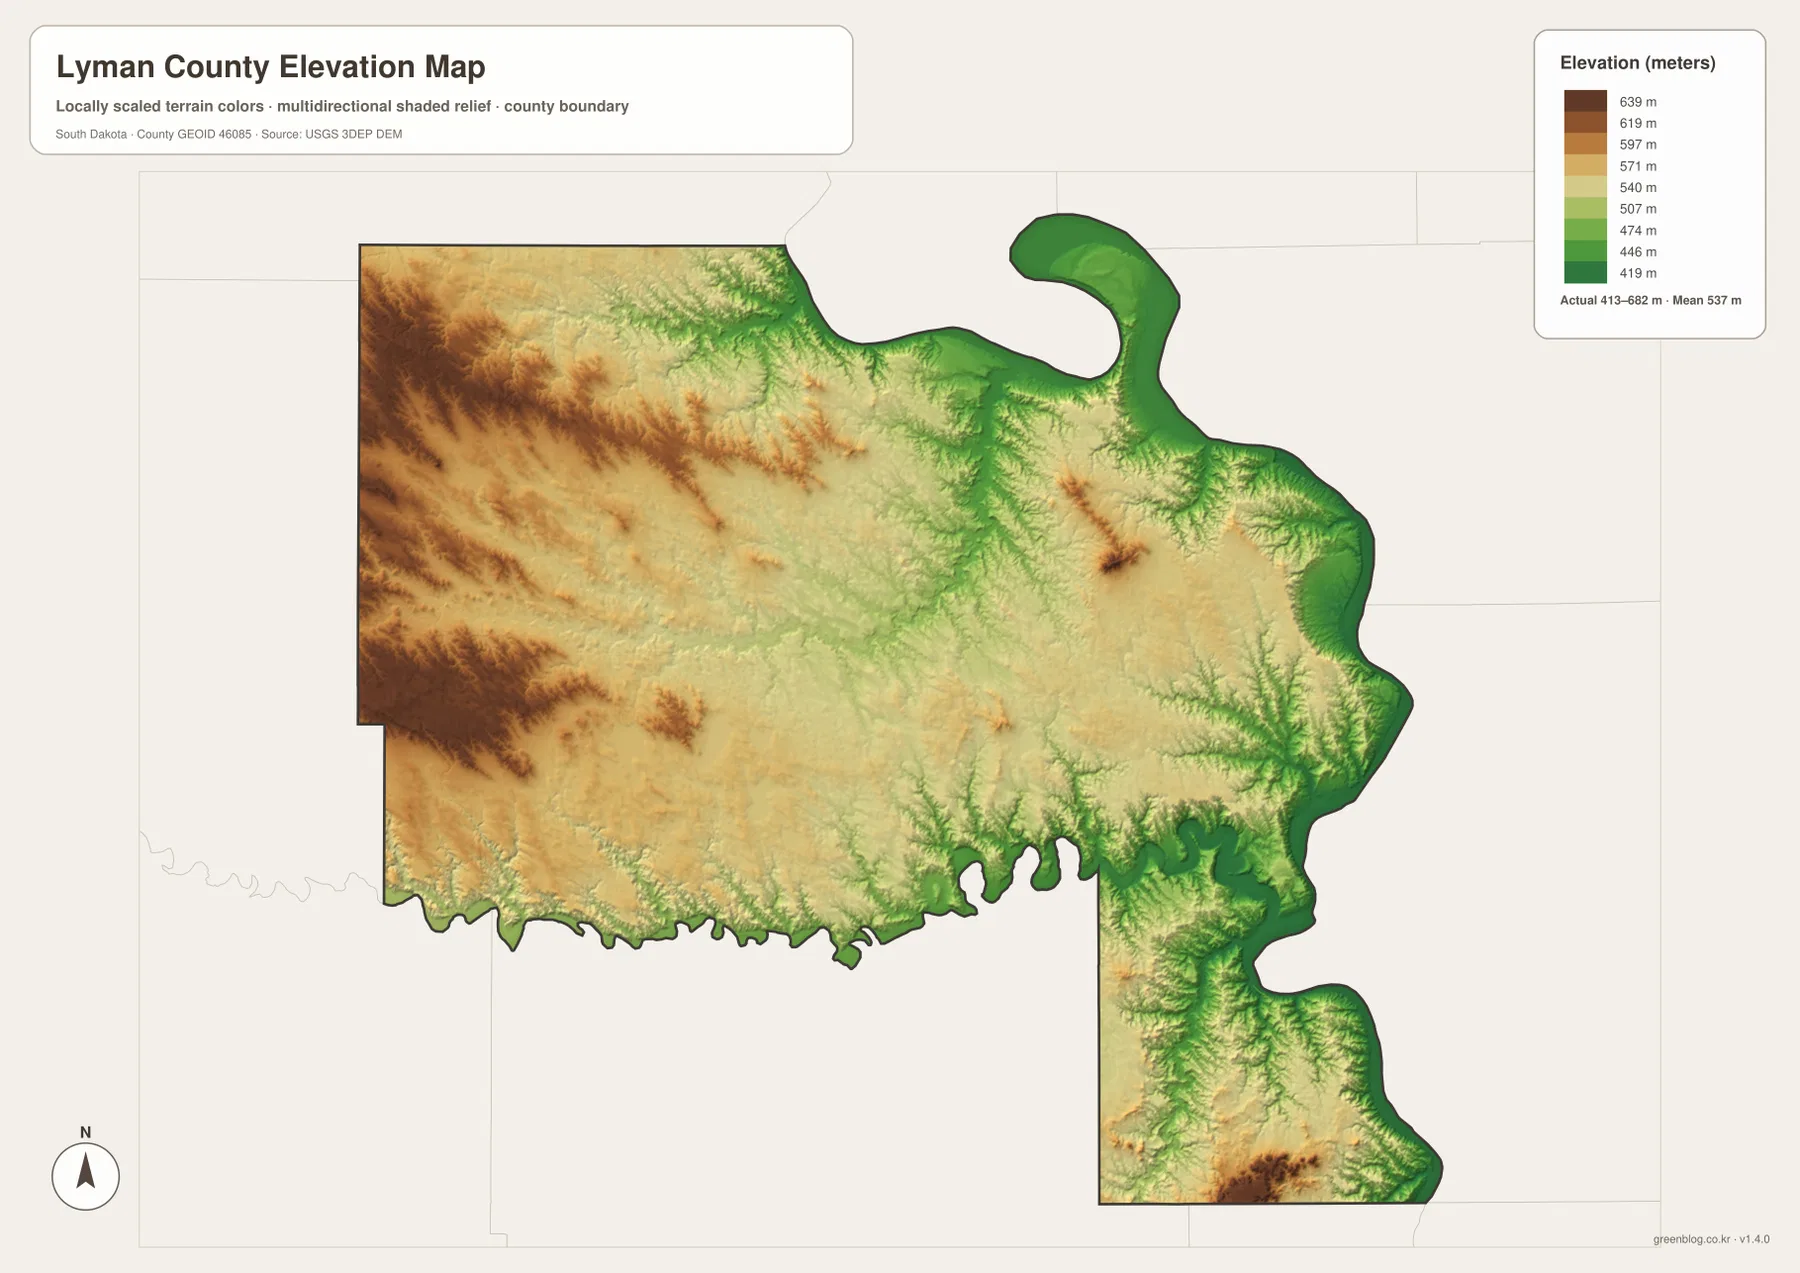
The elevation image is intended for county-wide comparison, not engineering or survey work. Its locally scaled colors make broad differences easy to see, but they do not provide a certified elevation for a road, building site, or property corner. Anyone who needs point elevations or the underlying digital elevation model should consult the USGS 3D Elevation Program. For ordinary map reading, the most useful comparison is simply the high western ground against the lower Missouri and White River corridors.
Use Oacoma, Kennebec, and White River as anchors when switching between maps
A practical way to compare the four maps is to keep a few anchors in mind. Start at Oacoma on the east. The general map gives the Missouri River edge and Interstate 90, the city map shows Oacoma as the distance hub, and the elevation map shows the nearby river corridor as low ground. Moving west to Kennebec, the road map places the town near the central corridor while the water map adds Kennebec Lake and nearby tributaries. Farther west, Presho sits closer to the broad higher terrain and the Medicine Creek drainage.
For the southern half, White River is the most useful reference. Its winding course helps match the water map to the irregular county edge on the general map. On the elevation map, the same corridor is lower than much of the land to its north and west. The southeastern extension can be matched by the 49 and 47 road labels, Bull Creek, Lake Agnes, and the isolated high terrain at the far south. This method keeps the maps connected to real visible features instead of treating each image as a separate list of map types.
The WebP images in the article are sized for fast on-page viewing. The ZIP below contains the corresponding original JPG files for the general county map, city-connections map, terrain-and-water map, and elevation map. Each image is 3638 × 2572 pixels. These larger files are useful when a clearer copy is needed for printing, presentations, study materials, or personal reference.
Frequently Asked Questions
Are the Oacoma-to-Presho, Kennebec, and Reliance distances driving distances?
No. The city-connections map labels straight-line distances from Oacoma: about 13 miles to Reliance, 26 miles to Kennebec, and 36 miles to Presho. Driving distances can be longer because travel follows the road network, so current route information should be used for trip planning.
Which map is best for finding White River and Medicine Creek?
The terrain-and-water map is the clearest choice. White River follows the southern part of the county, while Medicine Creek crosses the west-central area. Cedar Creek, Stony Butte Creek, American Crow Creek, Bull Creek, and several named lakes are also labeled on the same image.
Can the 413–682 m elevation range be used for surveying?
No. The elevation map is a generalized county-scale visualization. The legend’s roughly 413–682 m range and 537 m mean are useful for comparing broad high and low areas, but exact point elevations require the original elevation data or a survey-grade source.
Map File Information
The ZIP contains four high-resolution JPG files for Lyman County: the general map, city-connections map, terrain-and-water map, and elevation map.
- Printable Size: 3638 × 2572 px each
Related Maps
Sources and references
- Lyman County official website – county information and government resources
- South Dakota Legislature – Lyman County boundaries – statutory boundary description using the Missouri and White rivers
- U.S. Census Bureau TIGER/Line Shapefiles – county boundary and transportation reference data
- USGS National Hydrography – official hydrography reference
- USGS 3D Elevation Program – elevation source data
Green Map creates custom-edited map images using open geographic data sources such as geoBoundaries, Natural Earth, OpenStreetMap, and government open data.
These maps are edited visual materials, not raw data files, and are provided for education, documents, presentations, and graphic reference.