Beadle County in east-central South Dakota is easiest to understand when Huron is used as the starting point. The maps on this page show the county boundary and main roads, the distribution of six labeled communities, the James River and named lakes and creeks, and the broader elevation pattern around those waterways. Readers who need the files rather than only an on-screen reference can also download the original high-resolution JPG versions together in one ZIP, making the page useful for printing, classroom work, presentations, and county-level reference.
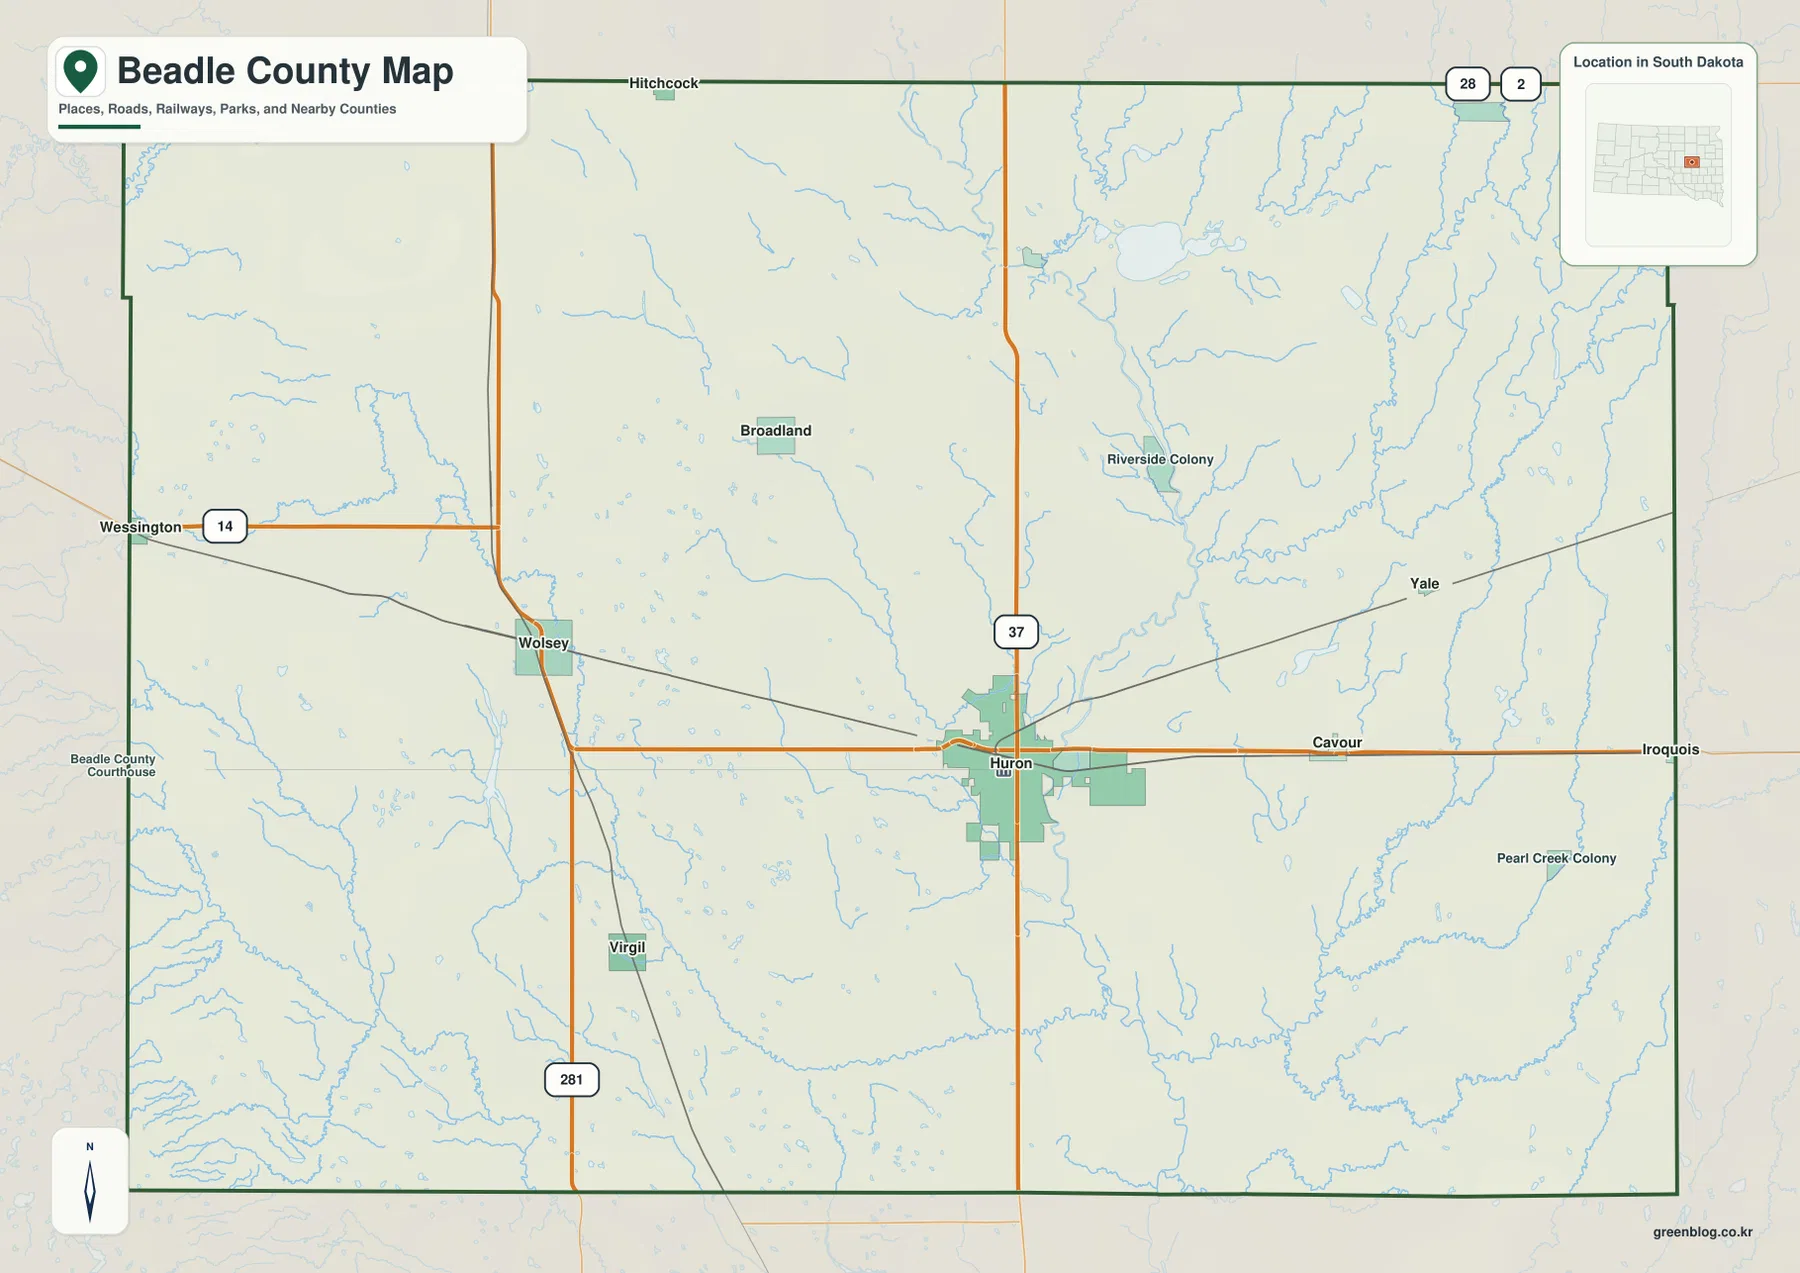
The four supplied views emphasize different parts of the same landscape. US 14 crosses the middle of the county through the Huron area, US 281 provides a north-south reference west of Huron, and SD 37 runs north from Huron. Smaller communities are spread away from that central city rather than forming a continuous built-up belt. Behind the road network, the James River and its tributaries follow lower ground, while the northern part of the county contains a noticeable cluster of named lakes. Reading the maps together therefore gives a clearer picture than treating any one of them as a complete county map for every purpose.
Table of Contents
Using Huron and US 14 to orient the county
Huron is the clearest anchor on the general county map. Its developed area is larger than the other labeled places, and several important routes meet or pass close to it. US 14 forms the most obvious east-west line. To the west, the route leads toward Wolsey and Wessington; to the east, it continues toward Cavour and Iroquois. Once that corridor is located, the rest of the county becomes much easier to place because towns north or south of the central line can be compared against a familiar reference.
The north-south roads add a second frame. US 281 runs on the western side of the Huron area and passes close to Wolsey before continuing toward the Virgil area. SD 37 runs through Huron and continues north. Hitchcock appears close to the northern boundary, while Yale lies farther east and north of the central US 14 corridor. The map also labels smaller places such as Broadland and Riverside Colony, allowing the broad rural spaces between the better-known towns to remain visible rather than being hidden by a dense street layer.
This is the most useful of the supplied maps for a general county overview because it keeps roads, town names, the county outline, rail lines, and smaller waterways in one frame. It works well when the question is “Where is Huron relative to the rest of Beadle County?” or “Which main route connects the central towns?” It is not a turn-by-turn road map, however, and it does not show every local road or property line. Current navigation data should be used when exact driving directions are required.
Six mapped communities reveal a strong Huron-centered pattern
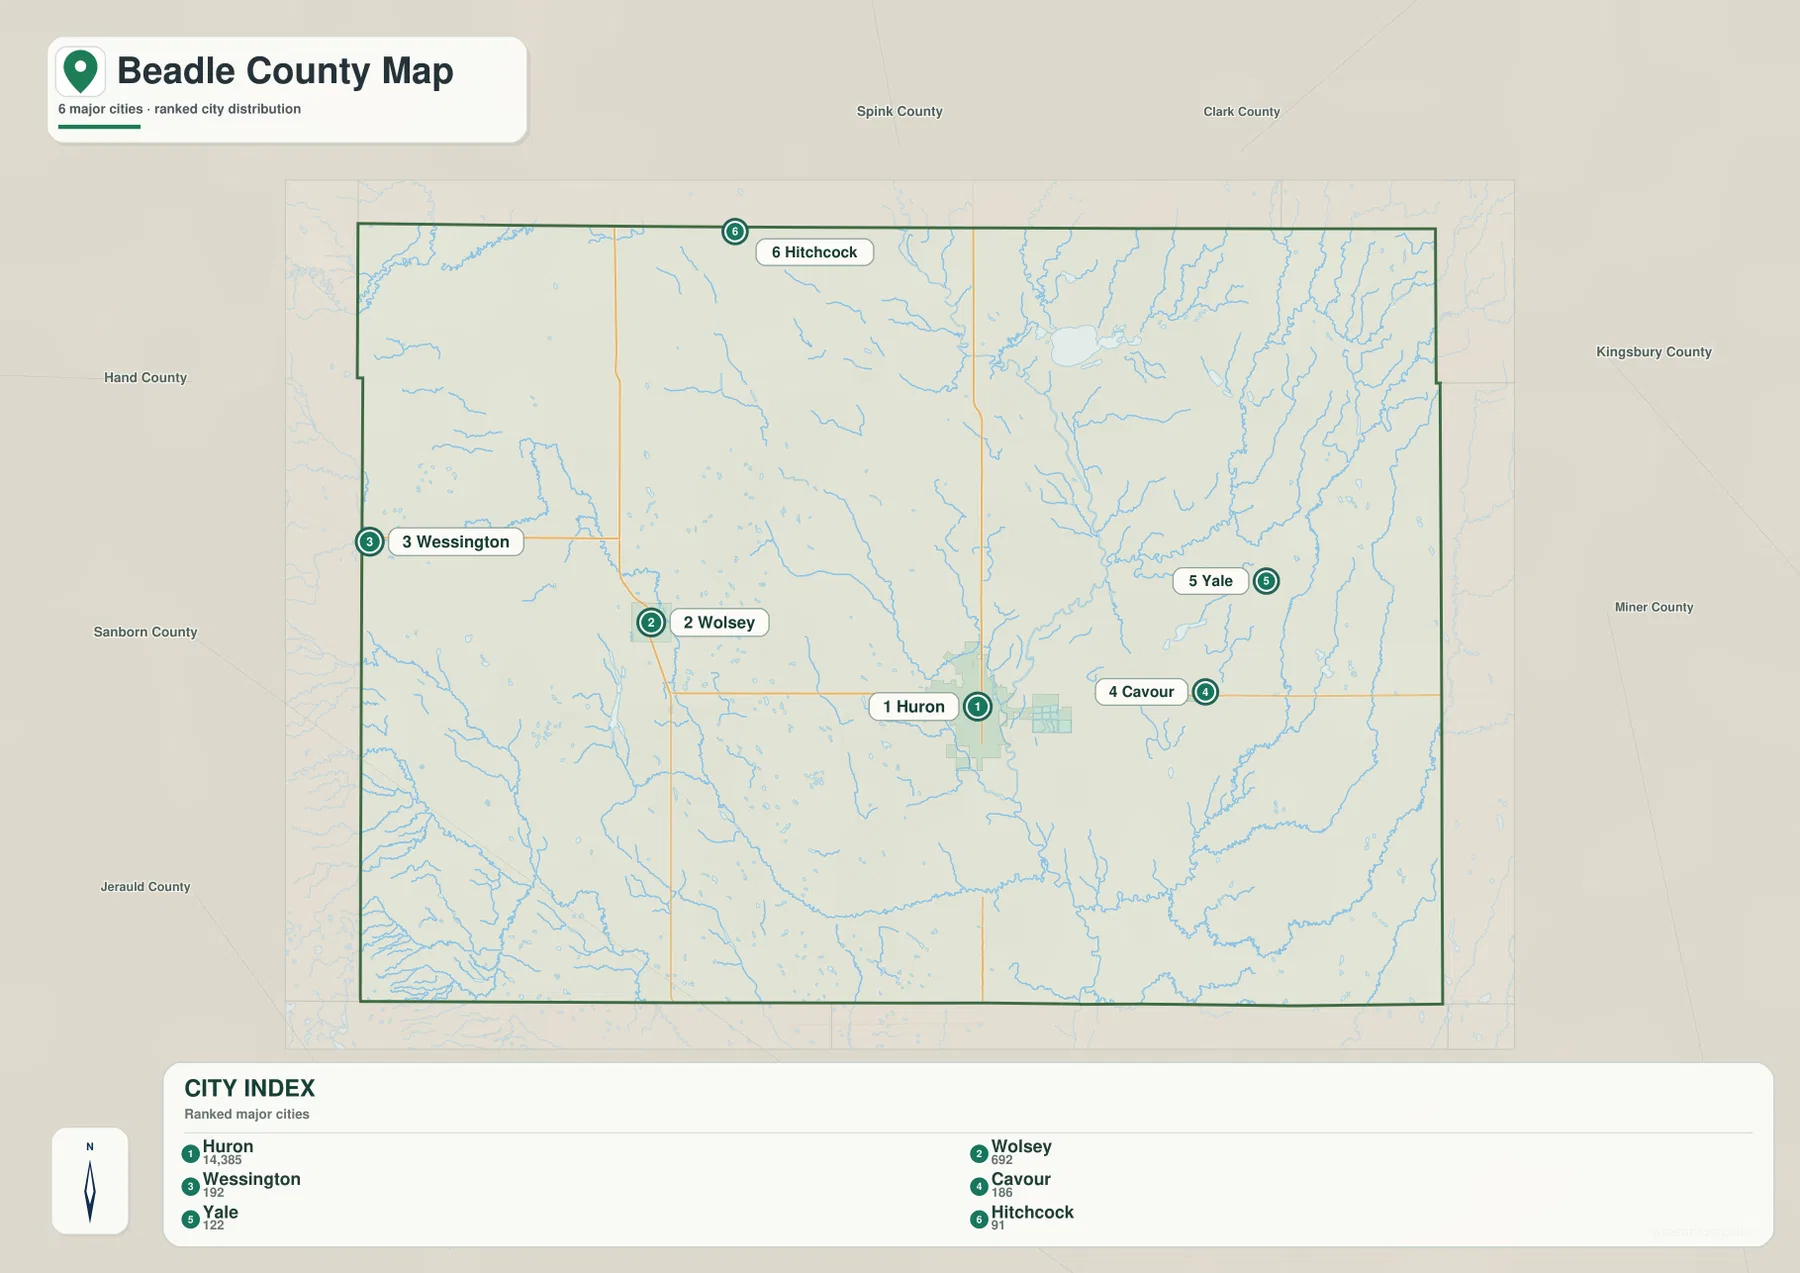
The city-distribution map strips away some of the general-map detail and makes settlement scale easier to compare. Its index lists Huron at 14,385, Wolsey at 692, Wessington at 192, Cavour at 186, Yale at 122, and Hitchcock at 91. These figures are the values printed on the supplied map and are used here only to explain the map’s own ranking. They should not be read as a newly calculated population estimate. Even with that limitation, the contrast is unmistakable: Huron is far larger than any of the five smaller communities shown in the index.
The smaller places are spread in several directions. Wessington sits near the western edge, Wolsey is west of Huron, and Cavour is east of Huron along the middle of the county. Yale is displaced to the northeast, while Hitchcock is close to the northern boundary. That arrangement matters because Beadle County does not read visually as one continuous urban area. The county map is dominated by open space between separate settlements, and the city view makes that spacing easier to see without the additional road and water labels competing for attention.
Switching back to the road map after viewing the city index adds useful context. Wolsey and Cavour can be related to the central east-west corridor, while Hitchcock provides a simple reference for the north side of the county. Huron’s position also explains why it functions as the natural visual center of the map: the city is large in the index and sits where important county routes come together. The city map is best for comparing relative location and settlement scale. It is not intended to provide driving mileage or travel times between the towns.
Northern lakes and the James River define the water reference map
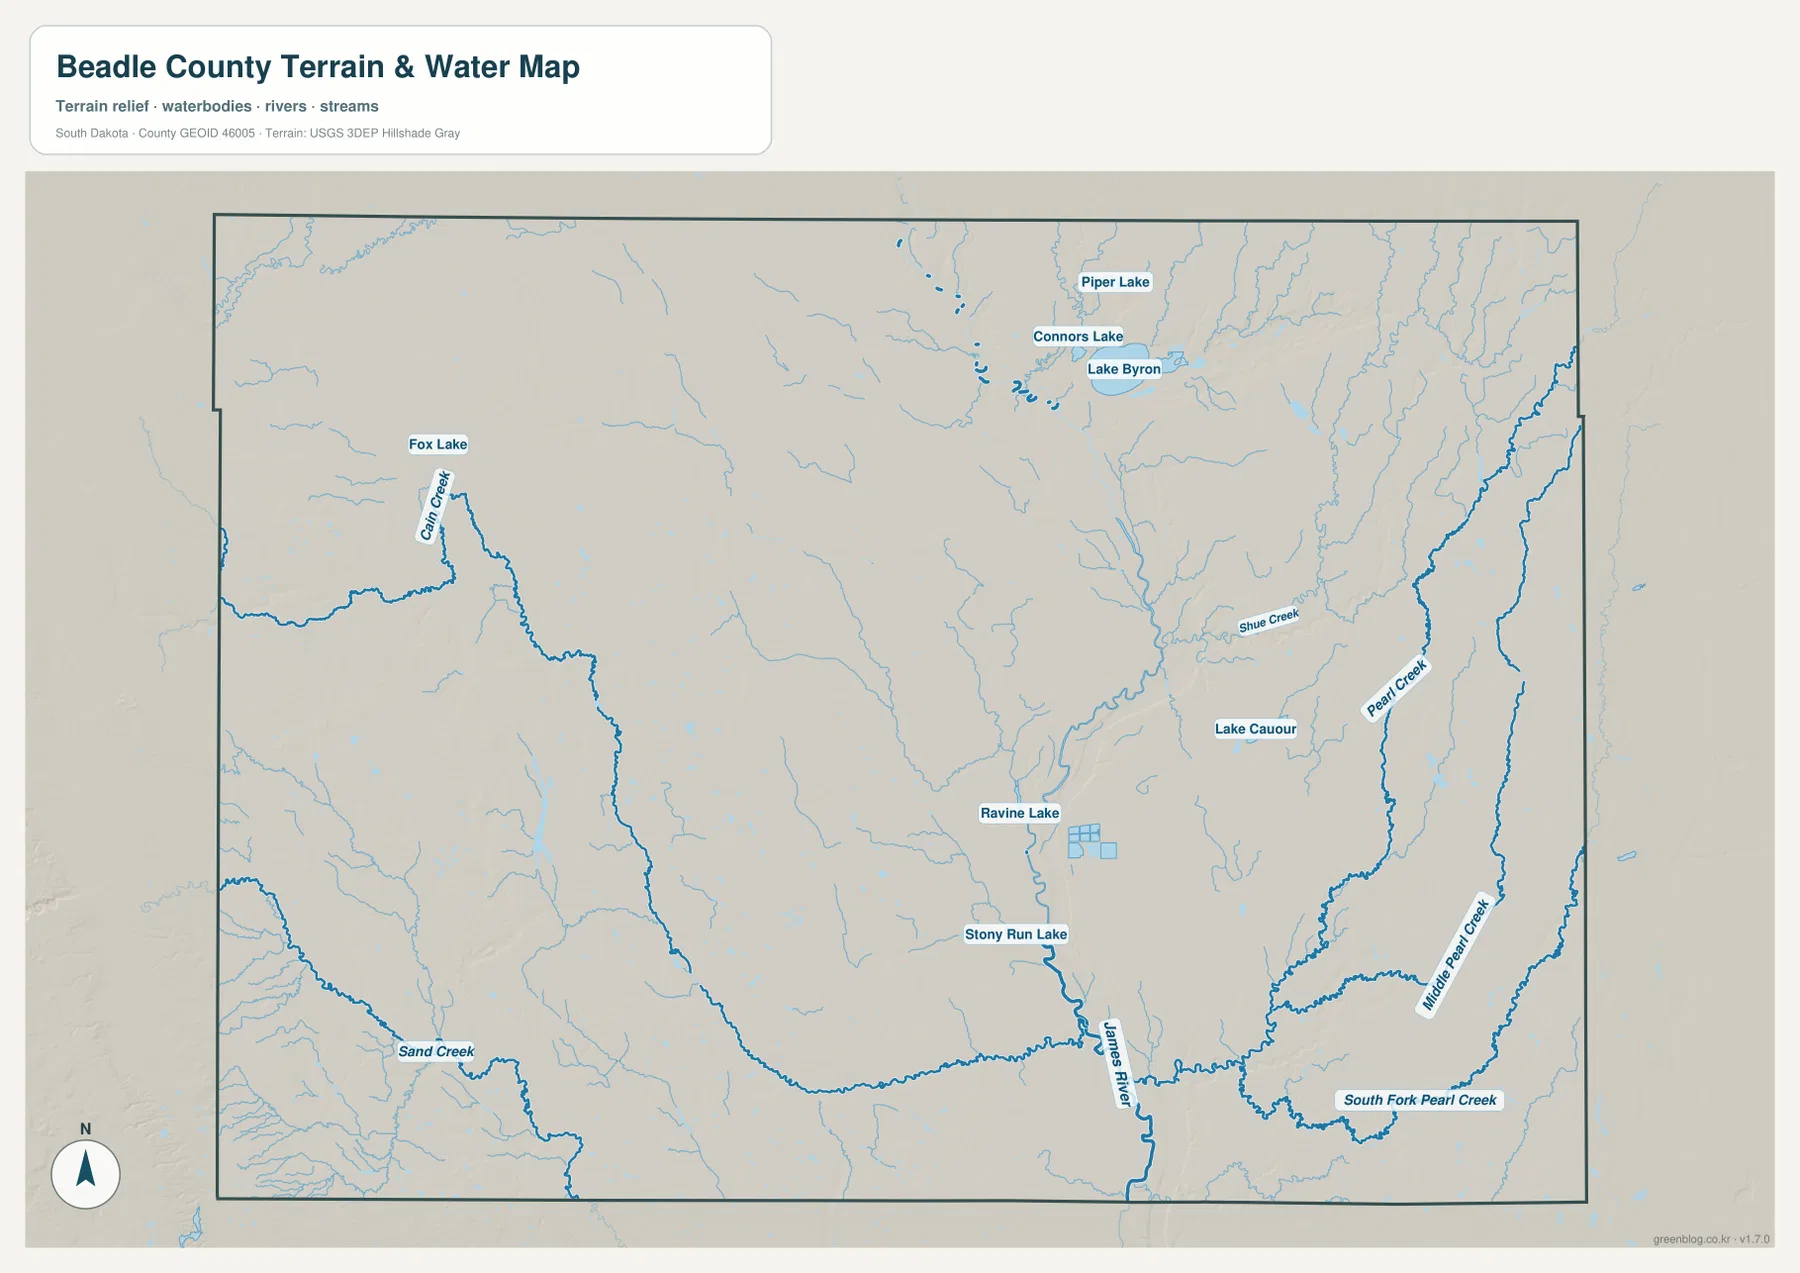
The terrain-and-water map changes the emphasis from transportation to drainage. The James River is the strongest continuous named water feature, following a north-south course through the central-eastern part of the county and receiving smaller channels from both sides. Several eastern tributaries are labeled, including Pearl Creek, Middle Pearl Creek, South Fork Pearl Creek, and Shue Creek. Sand Creek appears in the southwest, while thinner unnamed channels spread across much of the remaining map. The result is a county that looks much more finely divided by drainage than the road map alone suggests.
The lakes are not evenly distributed. Piper Lake, Connors Lake, and Lake Byron form a distinct northern grouping, while Fox Lake sits farther west. Near the Huron area, Ravine Lake and Stony Run Lake are labeled, and Lake Cavour appears farther east. These names are useful landmarks when the water map is compared with the city map. For example, the Cavour area can be placed relative to Lake Cavour, while the Lake Byron group lies well north of Huron and near the upper part of the county.
This is a geographic reference map, not a flood-risk product. A river or creek symbol does not show the width of a floodplain, and a lake outline does not establish public access, shoreline ownership, water depth, or navigation conditions. The map is most useful for locating named water bodies and understanding which parts of Beadle County contain denser networks of streams and tributaries. Anyone making a safety, legal, or property decision should use the appropriate current state, local, or federal source for that purpose.
Elevation makes the lower drainage corridors easier to see
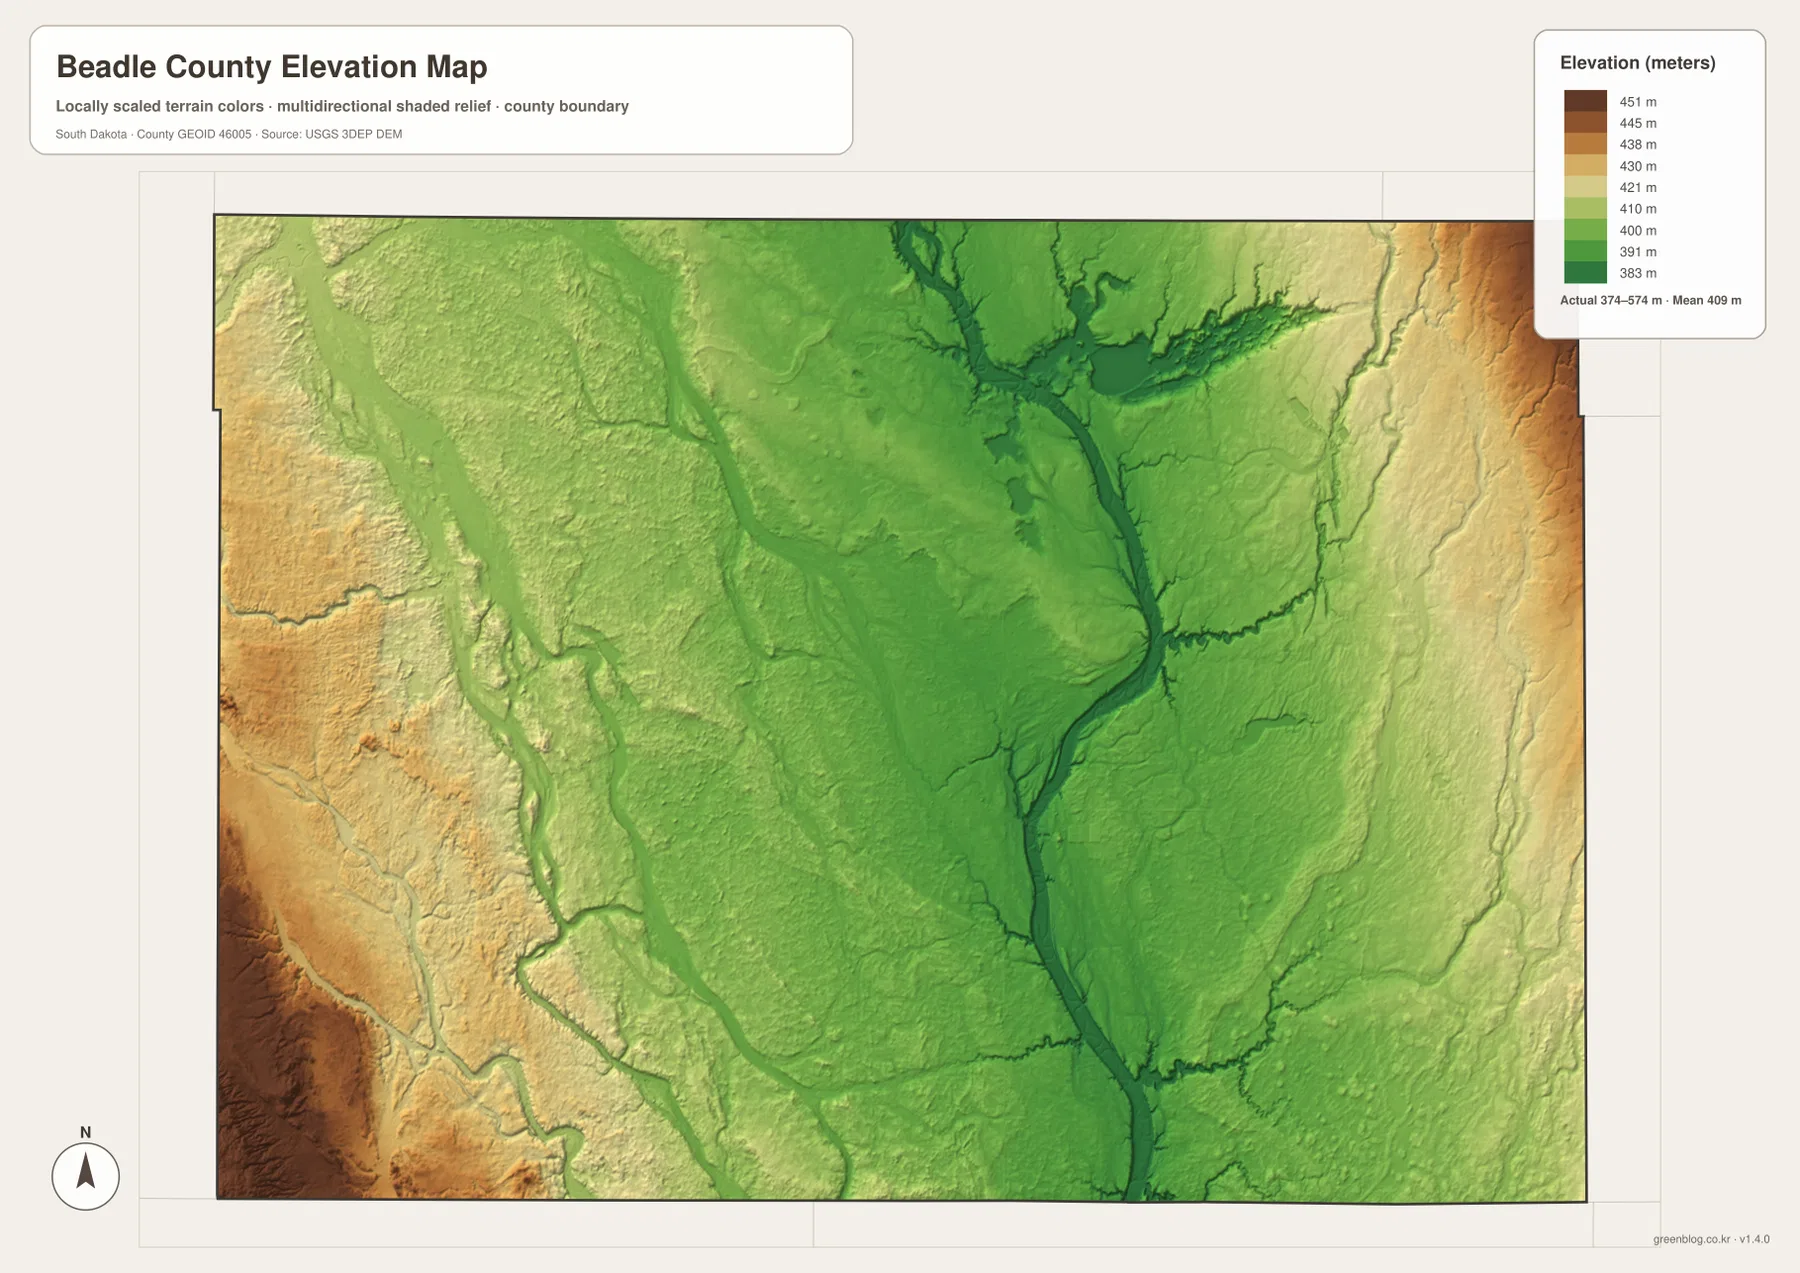
The elevation map reports an actual county range of roughly 374 to 574 meters and a mean of about 409 meters. Most of the interior is shown in green tones, while warmer yellows and browns become more visible toward parts of the outer margins. The darker green corridors are particularly useful because they trace lower ground that resembles the drainage pattern seen on the water map. A branching low area runs through the central and eastern portions of the county and aligns with the James River system and its tributaries.
The important feature is not a dramatic mountain-versus-valley contrast. Beadle County’s relief is broad and gradual on this county-scale surface. The low river corridors are visible because the surrounding land rises gently away from them, not because steep mountain walls enclose the channels. That is why the elevation map works best when it is compared with the water map: the water view supplies the names, while the elevation view shows how the surrounding land surface changes around those channels.
The shaded surface is generalized for regional comparison and should not be treated as a survey-grade elevation model for a specific lot. It is appropriate for classroom discussion, a county overview, or a presentation showing where lower and higher ground are concentrated. It is not appropriate for construction design, drainage engineering, legal elevation certification, or any decision that depends on an exact point measurement. For those uses, the original elevation dataset or a qualified survey should be consulted.
Choose the file by the question you need the map to answer
A general handout usually works best with the county map because it combines Huron, the main highways, surrounding places, and the boundary in one image. The city map is cleaner when the point is to explain settlement spacing or the large difference between Huron and the five smaller communities in the index. The water map is the better choice for locating the James River, Lake Byron, Pearl Creek, or the northern lake group, while the elevation view is most useful when the discussion turns to lower river ground and broader relief.
The WebP images in the article are sized for convenient browser viewing. The downloadable ZIP contains the corresponding original JPG files at 3638 by 2572 pixels, giving more room for zooming, printing, and placing the maps in presentation slides or documents. Keeping the themes as separate files also avoids forcing every road, lake, town, and terrain layer into one crowded image. A reader can use only the general map for a location overview or place the water and elevation maps side by side when the relationship between drainage and terrain matters.
These maps are county-scale reference products, so the intended use matters. They can explain where communities sit, which highway crosses the county, where named waterways are located, and how elevation changes across broad areas. They should not replace a parcel map, emergency flood product, engineering drawing, legal boundary survey, or live navigation service. Matching the map to the question keeps the image readable and reduces the chance of treating a broad reference layer as more precise than it is.
Frequently Asked Questions
Which map should I use to find Huron and the main highways?
Use the general county map. It shows Huron together with US 14, US 281, SD 37, the county boundary, and nearby communities such as Wolsey and Cavour. That combination makes it the clearest starting point for county-wide orientation.
Can I locate Lake Byron and the James River on the same map?
Yes. The terrain-and-water map shows Lake Byron in the northern lake group near Piper Lake and Connors Lake, while the James River runs north-south through the central-eastern portion of the county. The map is useful for relative location, but it does not show flood zones or legal shoreline information.
Does the 374–574 meter range give the exact elevation of a property?
No. That range describes the county-wide elevation values reported on the supplied map. The shaded surface is intended to compare broad areas of higher and lower ground, not to certify the elevation of a particular property. Exact site measurements require the appropriate source elevation data or a survey.
Sources and reference material
- Beadle County official website
- South Dakota Department of Transportation CADD Mapping
- U.S. Census Bureau TIGER/Line Shapefiles
- USGS National Hydrography
- USGS 3D Elevation Program
Map File Information
The ZIP contains the original high-resolution JPG versions of the Beadle County general map, city map, terrain and water map, and elevation map.
- Included Files: General county map, city map, terrain and water map, and elevation map
- File Type: Four high-resolution JPG files, each 3638×2572 pixels
- Intended Use: Printing, education, presentations, and county-level reference
Related Maps
Green Map creates custom-edited map images using open geographic data sources such as geoBoundaries, Natural Earth, OpenStreetMap, and government open data.
These maps are edited visual materials, not raw data files, and are provided for education, documents, presentations, and graphic reference.