Clark County has one of the clearest internal contrasts in this Indiana map series. Forest is the largest 2025 class at 40.02%, agriculture follows at 35.75%, and developed land accounts for a substantial 21.44%. The southern end is heavily built, while broad forest blocks occupy much of the west and northwest and farm country spreads across the northern and interior sections. This Clark County Indiana Land Cover Map is useful because all three patterns are visible within one county boundary.
The page pairs a current land-cover overview with a forest-and-farmland view, an impervious-surface map, and a 1985–2025 class-difference map. The WebP images are designed for on-page comparison. Four original 2480 × 1754-pixel JPG maps are also available together in one ZIP for county profiles, classroom work, presentations, and other reference uses.
Table of Contents
A southern built-up zone sits beside a county that is still 40.02% forest
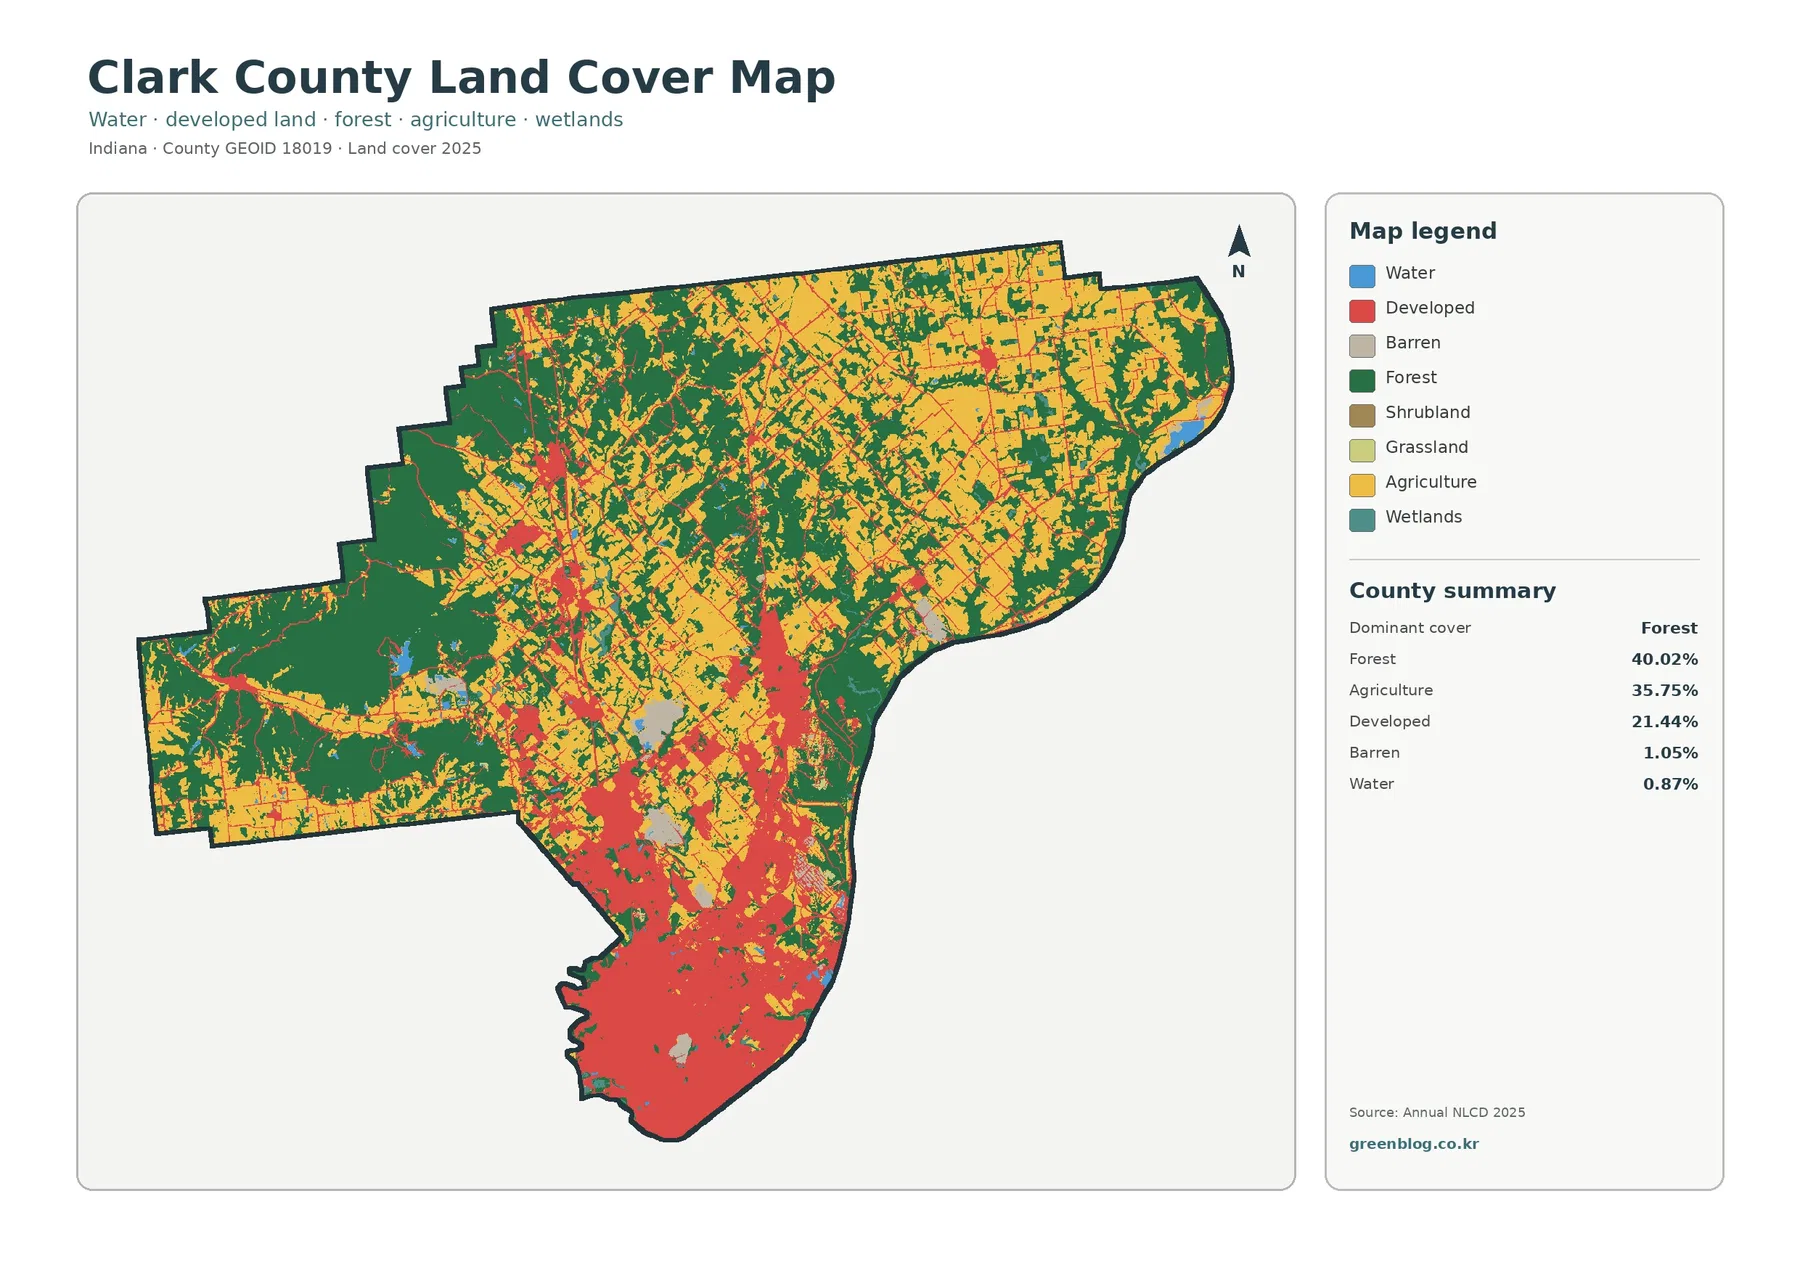
The countywide image does not look like a simple farm-dominant Indiana county. Dark green forest covers large western areas and breaks into smaller patches toward the north and east. Yellow agriculture occupies broad parts of the northern half and several interior blocks. Red developed land becomes increasingly common toward the south before spreading across much of the lower county.
The summary puts forest first at 40.02%, agriculture second at 35.75%, and developed land third at 21.44%. Barren land is listed at 1.05% and water at 0.87%. The forest-and-farmland map also reports 0.61% wetlands, 0.22% grassland, and 0.04% shrubland. Those smaller classes matter locally, but the major story is the balance among woods, working land, and a large metropolitan footprint.
Land cover is a classification of what the surface looks like from imagery and related data. It is not a zoning map, ownership map, parcel survey, or statement about what may legally be built. A developed cell can still contain trees and lawns, while an agricultural cell does not identify a crop, farm operator, or property boundary.
The forest-and-farmland view separates the wooded west from the northern farm pattern
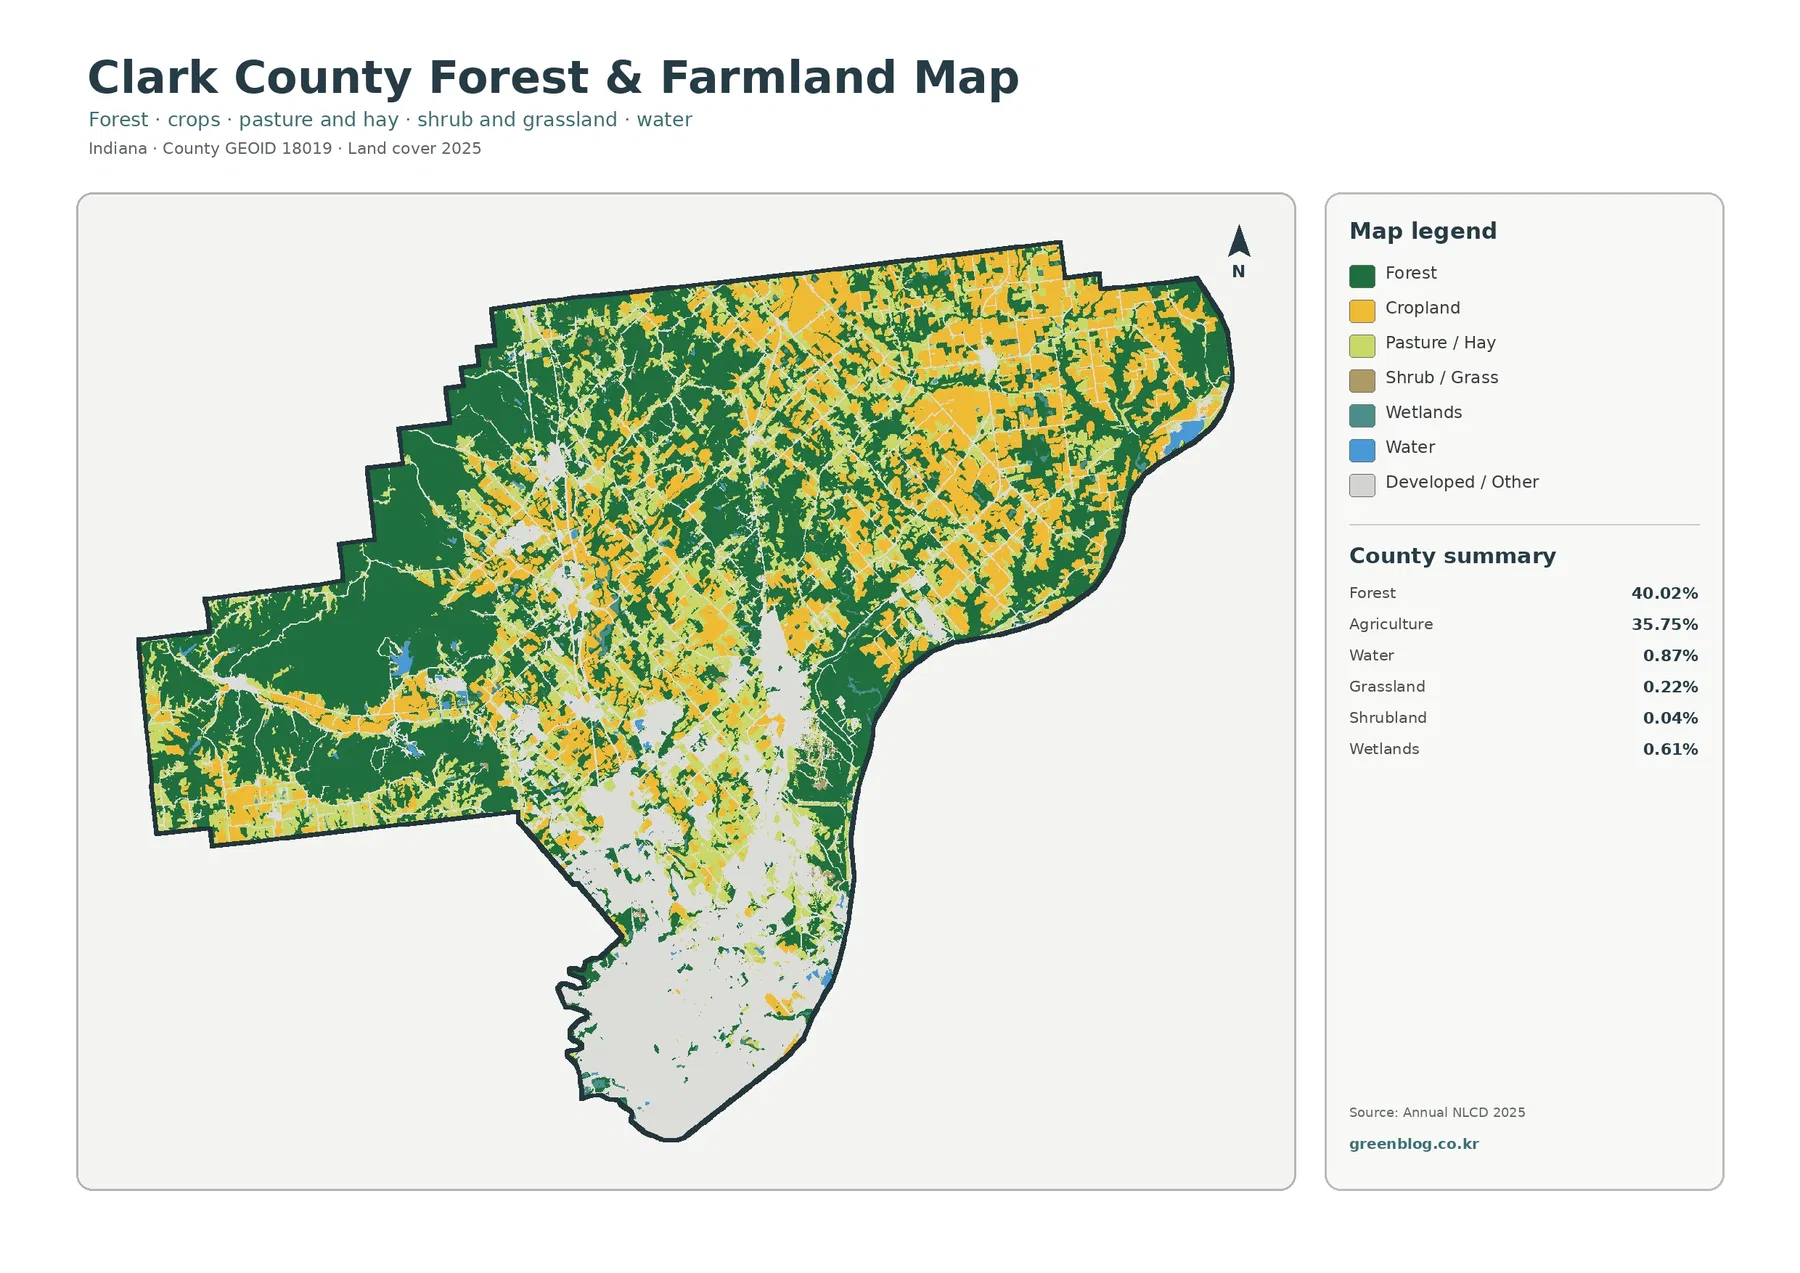
Once developed and miscellaneous surfaces fade into the background, the western side becomes much easier to read. Forest forms a large, connected area there, while the north and northeast contain a finer mix of cropland and wooded strips. Agriculture also extends through the middle of the county, but its blocks become less continuous as the map approaches the dense southern urban area.
The 35.75% agricultural share is therefore not spread evenly. Some northern and interior sections are strongly farm-oriented, whereas western parts are much more wooded. This distinction matters when the map is used for an environmental lesson or county profile. A single county percentage cannot show whether fields form broad blocks, small openings, or narrow pieces between forested land.
Indiana DNR provides useful local context through Clark State Forest, managed from Henryville. The agency describes it as Indiana’s oldest state forest and says the property has grown to more than 25,600 acres. That information helps explain why large managed forests are an important part of the regional landscape, but the NLCD forest color should not be treated as the state-forest property line. Ownership and land-cover classification are separate datasets.
Water, wetlands, grassland, and shrubland occupy much smaller shares. Their values are 0.87%, 0.61%, 0.22%, and 0.04% respectively. Small percentages do not mean that these classes are unimportant at a particular stream, low area, or forest edge. They simply occupy less of the countywide 30-meter grid than forest, agriculture, or development.
Impervious cover makes the Jeffersonville–Clarksville end of the county stand out
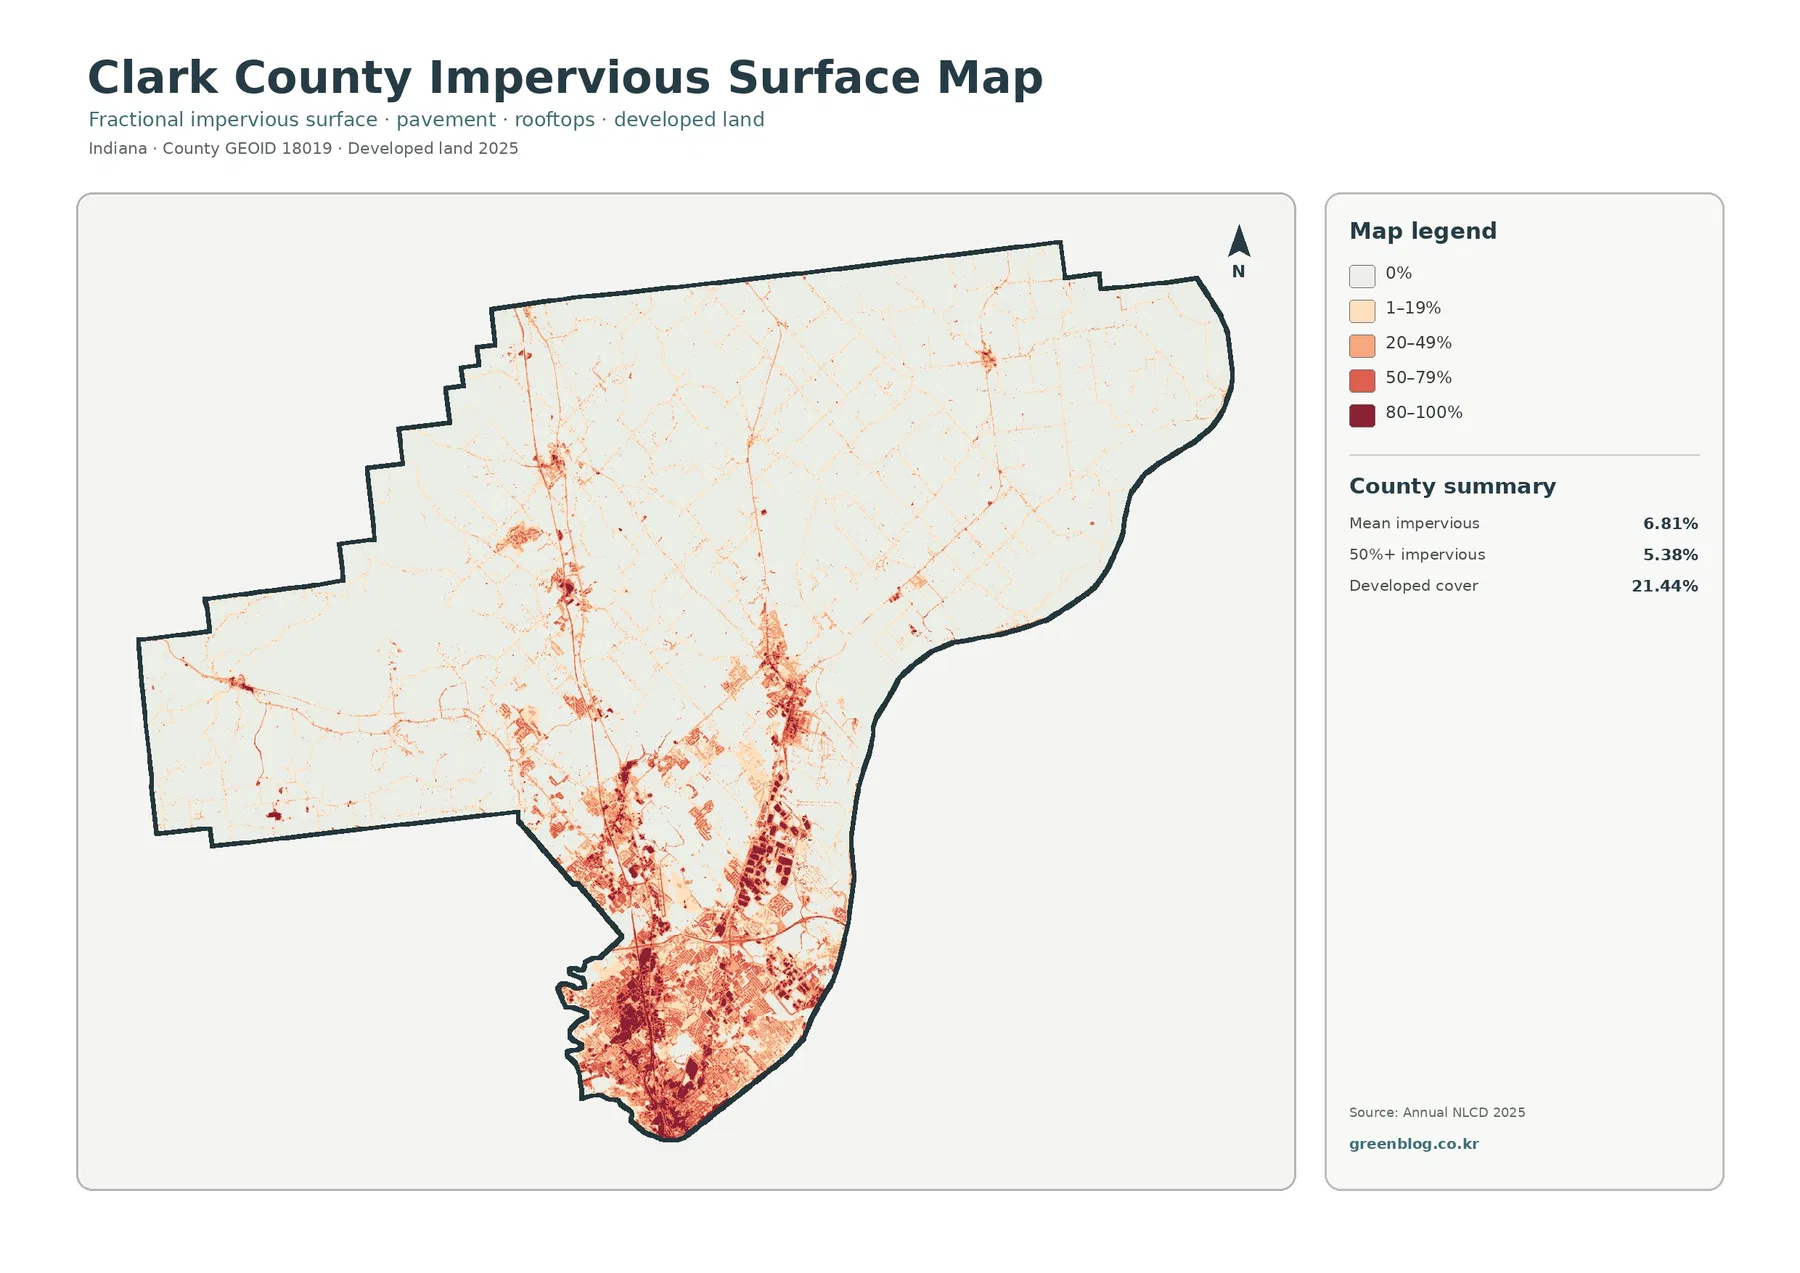
Mean impervious cover is 6.81%, while 5.38% of the county is mapped at 50% impervious or higher. The darkest values spread across the southern tip and continue northward in several clusters and lines. That pattern is much denser than the small built centers seen elsewhere in the county and is the clearest sign of the Louisville metropolitan influence on the Indiana side of the Ohio River.
Clark County’s official website describes the county as a transportation hub with interstate, rail, airport, and Ohio River access, including the Port of Indiana–Jeffersonville. The broad southern developed area is consistent with the location of Jeffersonville and Clarksville and with major transportation and employment areas. The map itself, however, has no road labels or municipal boundaries, so individual dark lines should not be assigned a highway name without a transportation layer.
The difference between 21.44% developed land and a 6.81% mean impervious surface is important. Developed classes may include lawns, trees, bare soil, and other permeable surfaces around buildings. Impervious cover focuses more closely on roofs, pavement, parking lots, and similar hard materials. A suburban neighborhood can therefore be developed without being close to 100% impervious.
Impervious cover can support questions about runoff and urban form, but it is not a flood-risk map. Rainfall, slope, soil, drainage systems, streams, wetlands, and floodplain position all affect how water moves. A dark impervious area deserves closer hydrologic review; it does not automatically mean the location will flood.
The 1985–2025 comparison records a 20.40% class difference, not 20.40% development
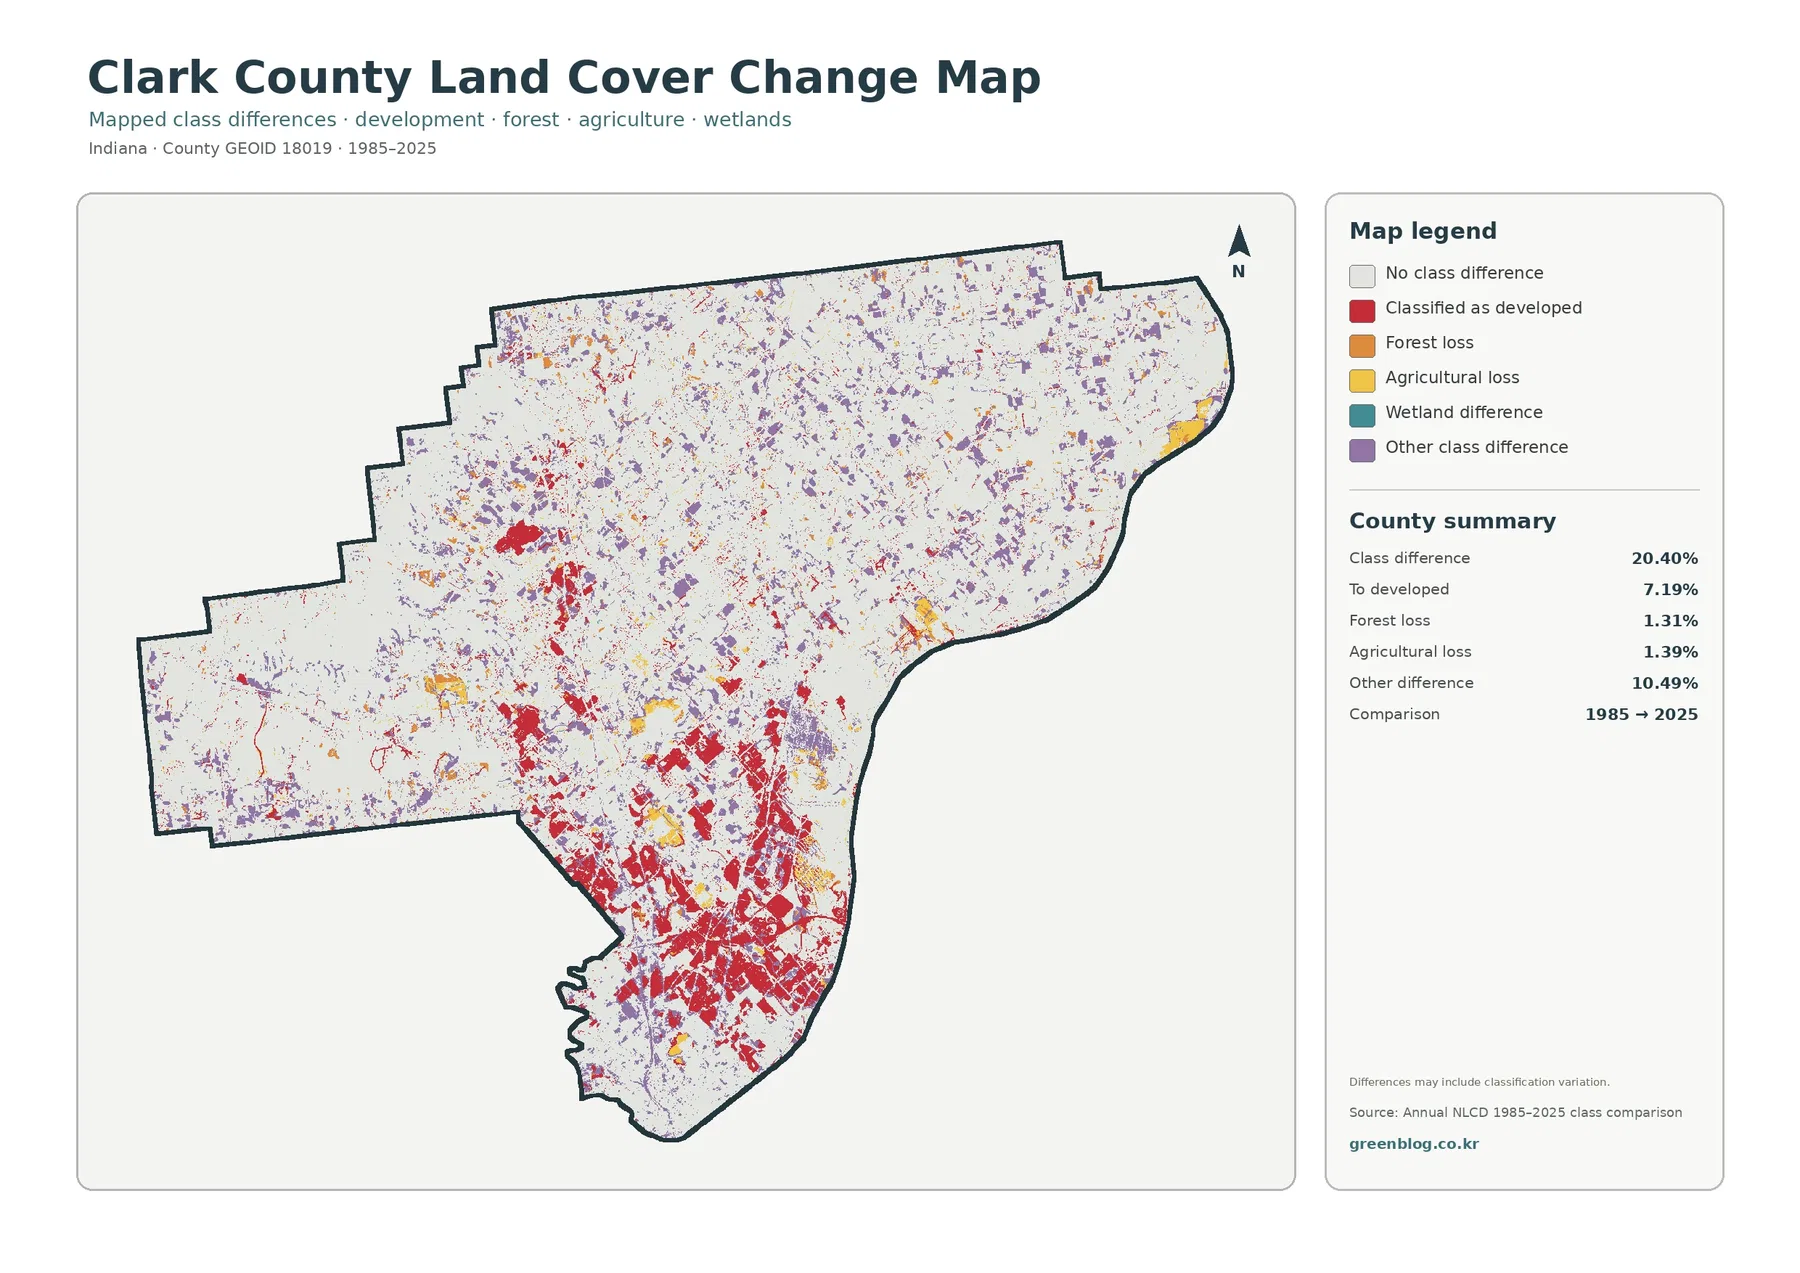
Total class difference is 20.40%. The supplied summary lists 7.19% as classified to developed, 1.31% forest loss, 1.39% agricultural loss, and 10.49% other difference. Wetland difference appears in the legend but does not have its own printed percentage, so it should not be estimated from the picture or calculated as an official residual.
Red developed-conversion cells are most concentrated in southern Clark County. Large patches also extend northward through the interior, while smaller red marks appear in the north and northwest. This is useful to compare with the 2025 impervious map: many of the places that now contain dense hard surfaces also contain visible endpoint differences, although the two maps measure different things.
Purple other-difference cells are scattered much more broadly. Orange forest-loss and yellow agricultural-loss cells appear as smaller pieces in several parts of the county. A cell labeled “forest loss” means that it was classified as forest at the 1985 endpoint and as another class in 2025. It does not by itself identify logging, construction, storm damage, management, or classification error as the cause.
Endpoint comparisons also hide the sequence between the two years. A location may have changed more than once and returned to a similar class by 2025. Seasonal conditions, mixed pixels, and classification variation can affect some boundaries. Intermediate imagery, permit records, forestry information, and local planning documents are needed when the timing or cause of a change matters.
Ohio River access matters to the county, but blue water cells are not a navigation map
Clark County has direct access to the Ohio River, and the county government highlights river shipping through the Port of Indiana–Jeffersonville. The curving eastern and southeastern county edge reflects that larger river setting. On the land-cover map, however, blue cells identify surface classified as open water inside the raster. They do not provide a full hydrographic network, channel depth, navigation route, or legal water boundary.
Water accounts for 0.87% of the county summary, while wetlands account for 0.61% in the focused vegetation map. These categories should remain separate. Open water represents exposed water surfaces, whereas wetland classes can contain vegetation and seasonally saturated ground. A teal wetland cell is not automatically a jurisdictional wetland, and the absence of teal does not replace a formal wetland determination.
Municipal planning boundaries answer questions that land-cover colors cannot
The Clark County Planning & Zoning Office provides a 2020 Comprehensive Plan, a floodplain ordinance, and links to planning offices for Jeffersonville, Clarksville, Charlestown, and Sellersburg. Those documents deal with legal boundaries, policies, permits, and future planning. Annual NLCD instead records the surface class observed for each 30-meter cell. The two sources are complementary rather than interchangeable.
A forest-colored area could still fall within a planned growth area, and a developed cell does not reveal its zoning district. The same caution applies to the large southern red area. Its general location can be associated with the Jeffersonville–Clarksville urban zone, but exact city limits, parcels, and land-use permissions require official municipal and county records.
Use the four maps as a sequence rather than four versions of the same picture
For a general county profile, begin with the 2025 overview. It quickly establishes the three-way balance among forest, agriculture, and development and makes the southern-versus-western contrast obvious. If the discussion turns to working land or habitat, switch to the forest-and-farmland view so the northern farm blocks and western woods are not obscured by the large developed footprint.
The impervious map is the better choice for a discussion of roofs, pavement, and the intensity of urban surfaces. Its 6.81% mean and 5.38% share at 50% impervious or higher give a different perspective from the 21.44% developed-land statistic. It is especially useful when comparing the dense southern end with smaller inland centers.
Place the change map after the current maps. That order prevents red “to developed” cells from being confused with the current developed class. The 20.40% class-difference value summarizes two endpoints, so it works best as a screening layer that points to locations where a closer historical review may be worthwhile.
For classroom or presentation use, pairing two maps is often clearer than showing all four at once. The overview plus the impervious map tells a strong urban story, while the forest-and-farmland map plus the change layer works well for landscape comparison. Keeping legends visible is important because similar colors can represent different concepts across the four figures.
Thirty-meter cells are useful for county patterns, not parcel decisions
Annual NLCD uses 30-meter square raster cells. A cell can contain a house, lawn, road, trees, and bare ground but still receive one predominant class. Narrow streams, tree rows, driveways, and small ponds may be generalized into a neighboring category. Zooming enlarges the cells; it does not create parcel-level detail that was never present in the source.
The current map represents the supplied 2025 observation year. Construction, harvest, forest management, vegetation recovery, or flooding after that observation may not appear. The 1985–2025 layer is an endpoint comparison rather than a complete annual history. Current permits, property decisions, and site studies should always use newer local records and higher-resolution evidence where available.
Each downloadable JPG measures 2480 × 1754 pixels. That is useful for screens, documents, lessons, and many print layouts. The package does not state that the files meet an A3 high-resolution standard, so test a large print before using the maps for a poster where small legend text must remain sharp.
Four original JPG maps in one Clark County download
The ZIP contains one JPG for 2025 land cover, one for forest and farmland, one for impervious surface and developed land, and one for 1985–2025 land-cover change. Together they let a reader move from the broad forest-agriculture-development balance to the specific questions of hard surfaces and endpoint change without mixing those measurements into a single map.
Frequently Asked Questions
Why is Clark County 21.44% developed but only 6.81% impervious on average?
Developed land can include lawns, trees, bare soil, and other permeable surfaces around buildings and roads. Impervious cover focuses on hard surfaces such as roofs, pavement, and parking areas. The two measures therefore describe different parts of the built environment.
Does the large southern developed area show the exact limits of Jeffersonville and Clarksville?
No. The concentration broadly matches the urban area at the southern end of Clark County, but the land-cover raster does not include municipal boundaries. Use Census boundary data and local planning maps for exact city limits, zoning, or parcel questions.
Does the 20.40% class difference mean one-fifth of the county was newly developed?
No. The supplied summary lists 7.19% as classified to developed. The 20.40% total also includes forest loss, agricultural loss, wetland difference, and other class differences. It is a two-date classification comparison, not a direct measure of construction.
Sources and Reference Data
- MRLC Annual NLCD Data – official access point for current land-cover and annual comparison products
- USGS Annual NLCD Land Cover Classification – definitions and guidance for forest, agriculture, developed land, water, wetlands, and related classes
- U.S. Census Bureau TIGER/Line Shapefiles – official county and municipal boundary reference data
- Clark County Planning & Zoning Office – 2020 Comprehensive Plan, floodplain documents, and local planning references
- Indiana DNR – Clark State Forest – official information on the Henryville-based state forest and forest management context
Map File Information
The ZIP contains four original JPG maps for comparing Clark County's forest, farmland, southern development, impervious surfaces, and 1985–2025 class differences.
- Included Files: Use only the versions confirmed in the article and supplied images
- File Type: Use the confirmed download contents
- Intended Use: Printing, education, presentations, and map-based projects
Related Maps
- Adams County Indiana Land Cover Map
- Allen County Indiana Land Cover Map
- Bartholomew County Indiana Land Cover Map
Green Map creates custom-edited map images using open geographic data sources such as geoBoundaries, Natural Earth, OpenStreetMap, and government open data.
These maps are edited visual materials, not raw data files, and are provided for education, documents, presentations, and graphic reference.