Edwards County is predominantly agricultural in the 2025 land-cover data, but the county is not a featureless block of cropland. Agriculture covers 77.05%, while forest accounts for 11.65%, developed land 7.61%, wetlands 3.36%, and water 0.31%. The four maps on this page separate those patterns so the broad farm landscape, the scattered natural cover, the compact built-up areas, and the 1985–2025 class differences can be examined without treating them as the same measure.
Each WebP map can be viewed on the page, and the four original JPG maps are available together in one ZIP download. Start with the general map for the countywide mix, use the forest-and-farmland view when natural cover is the main question, switch to fractional impervious surface for the concentration of pavement and rooftops, and use the change map only when comparing the two endpoint classifications. Land cover describes what the surface is classified as, not zoning, ownership, or parcel-level legal use.
Table of Contents
Farm cover dominates, but forest and wetland patches keep the county from looking uniform
The general 2025 map is filled mostly with the agriculture color, which matches the 77.05% county summary. That dominance is strongest across the broad interior, where large farm blocks form the continuous background. Forest appears as smaller green patches throughout the county and becomes more frequent toward the south. A conspicuous wetland-and-water area also breaks the farm pattern along the western side in the upper half of the county, while smaller wetland cells occur in several other places.
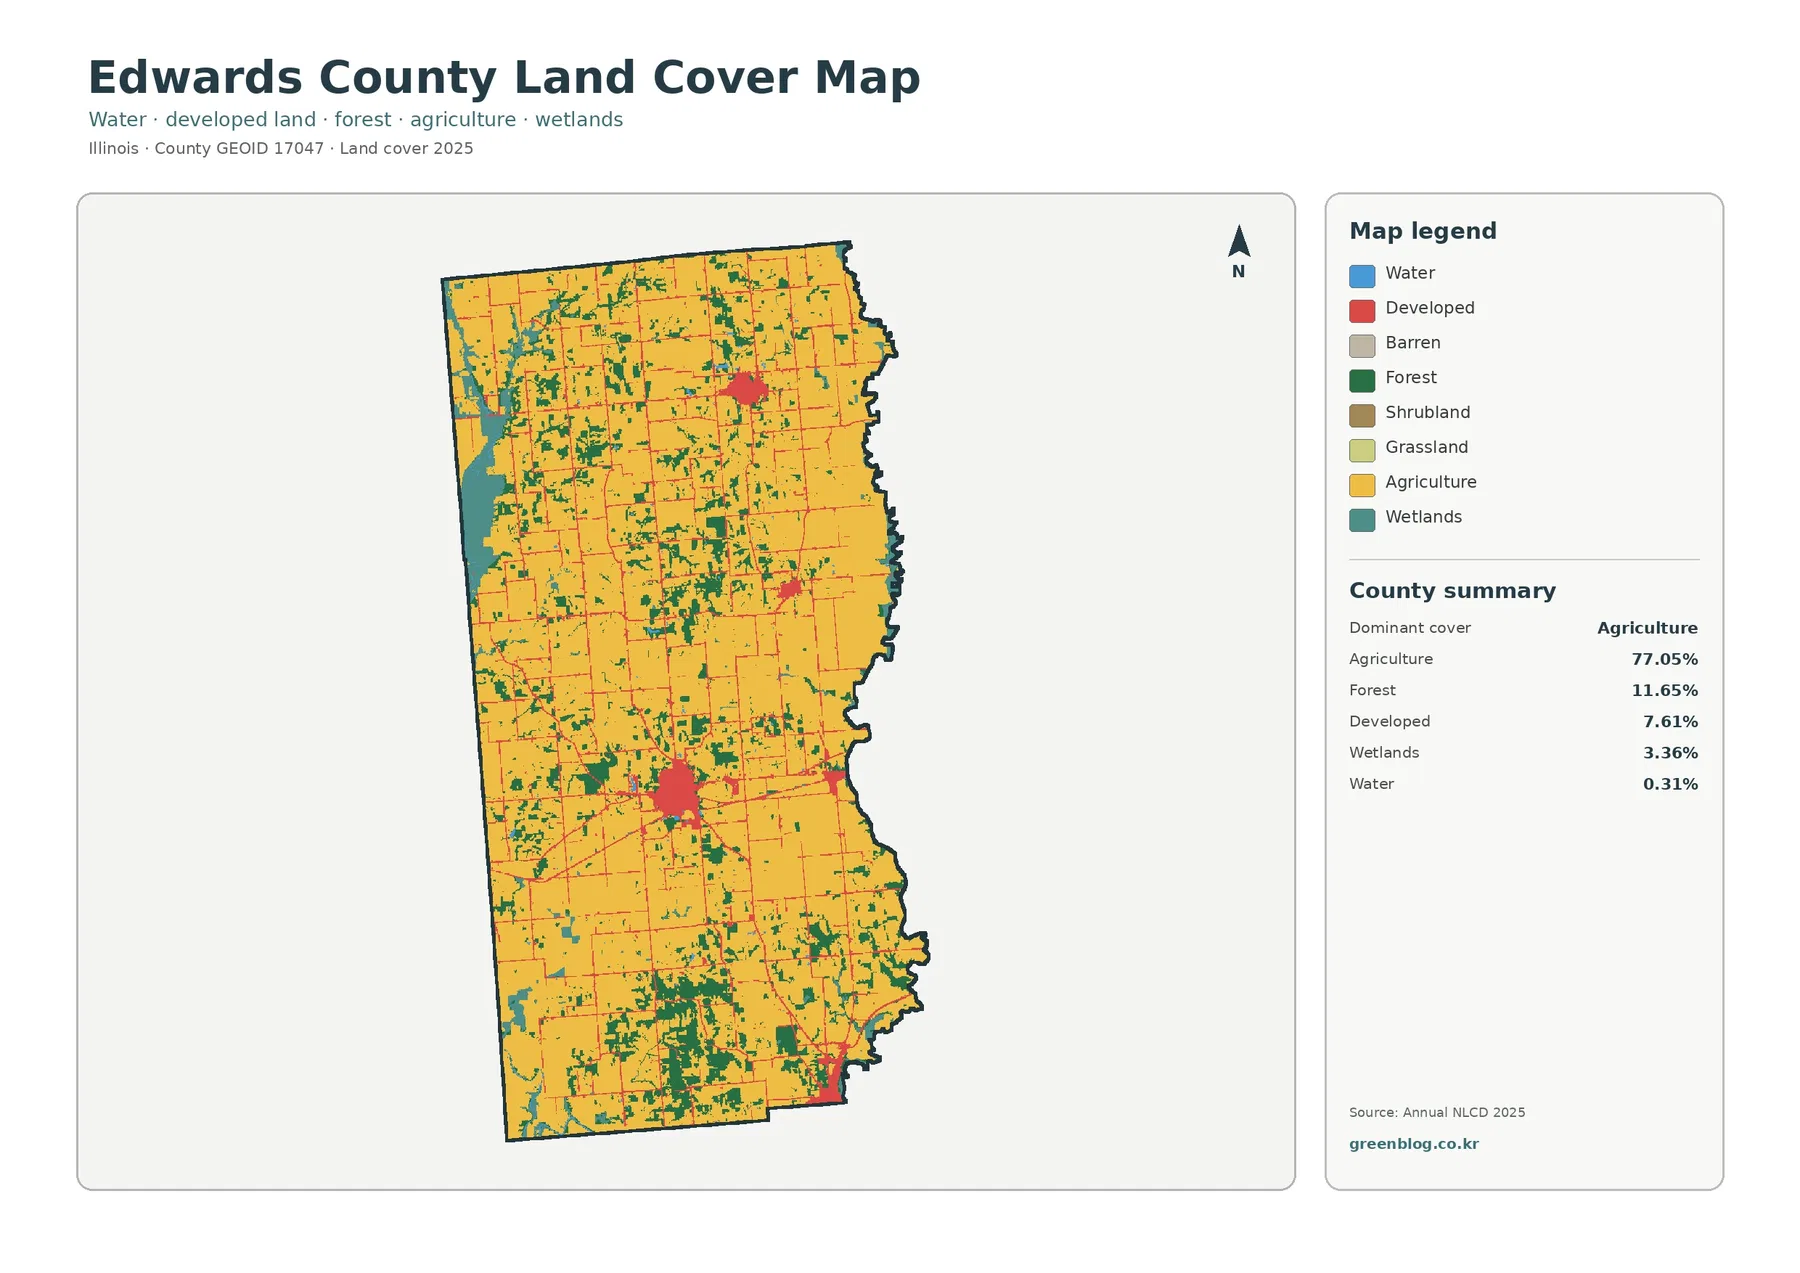
Developed land does not form a continuous urban field. Instead, several compact red clusters sit within the agricultural background, with the largest visible concentration a little south of the county center, another smaller cluster in the north, and additional development near the southeastern edge. Thin red lines link many of these areas and trace the built surfaces associated with the road network. The result is a county where settlement is easy to locate on the map but remains small compared with the surrounding farm cover.
These percentages describe classified surface cover rather than legal land use. A developed cell can contain a mixture of buildings, roads, lawns, trees, or other surfaces, depending on the development intensity represented by the source data. Likewise, an agricultural cell tells the reader that agriculture is the mapped cover class; it does not identify a crop, ownership, or a zoning designation. Keeping that distinction in mind is important before moving to the more specialized maps.
The forest-and-farmland view makes the southern natural cover easier to follow
When developed and miscellaneous cover are muted, the contrast between cropland and natural cover becomes much clearer. Forest still totals only 11.65% of Edwards County, yet green patches are noticeably denser in the southern portion than across much of the north and central interior. Some of those southern patches sit close together, while northern forest is more often broken into small pieces. Cropland remains the overwhelming background around both patterns, which helps show how fragmented the wooded cover is at county scale.
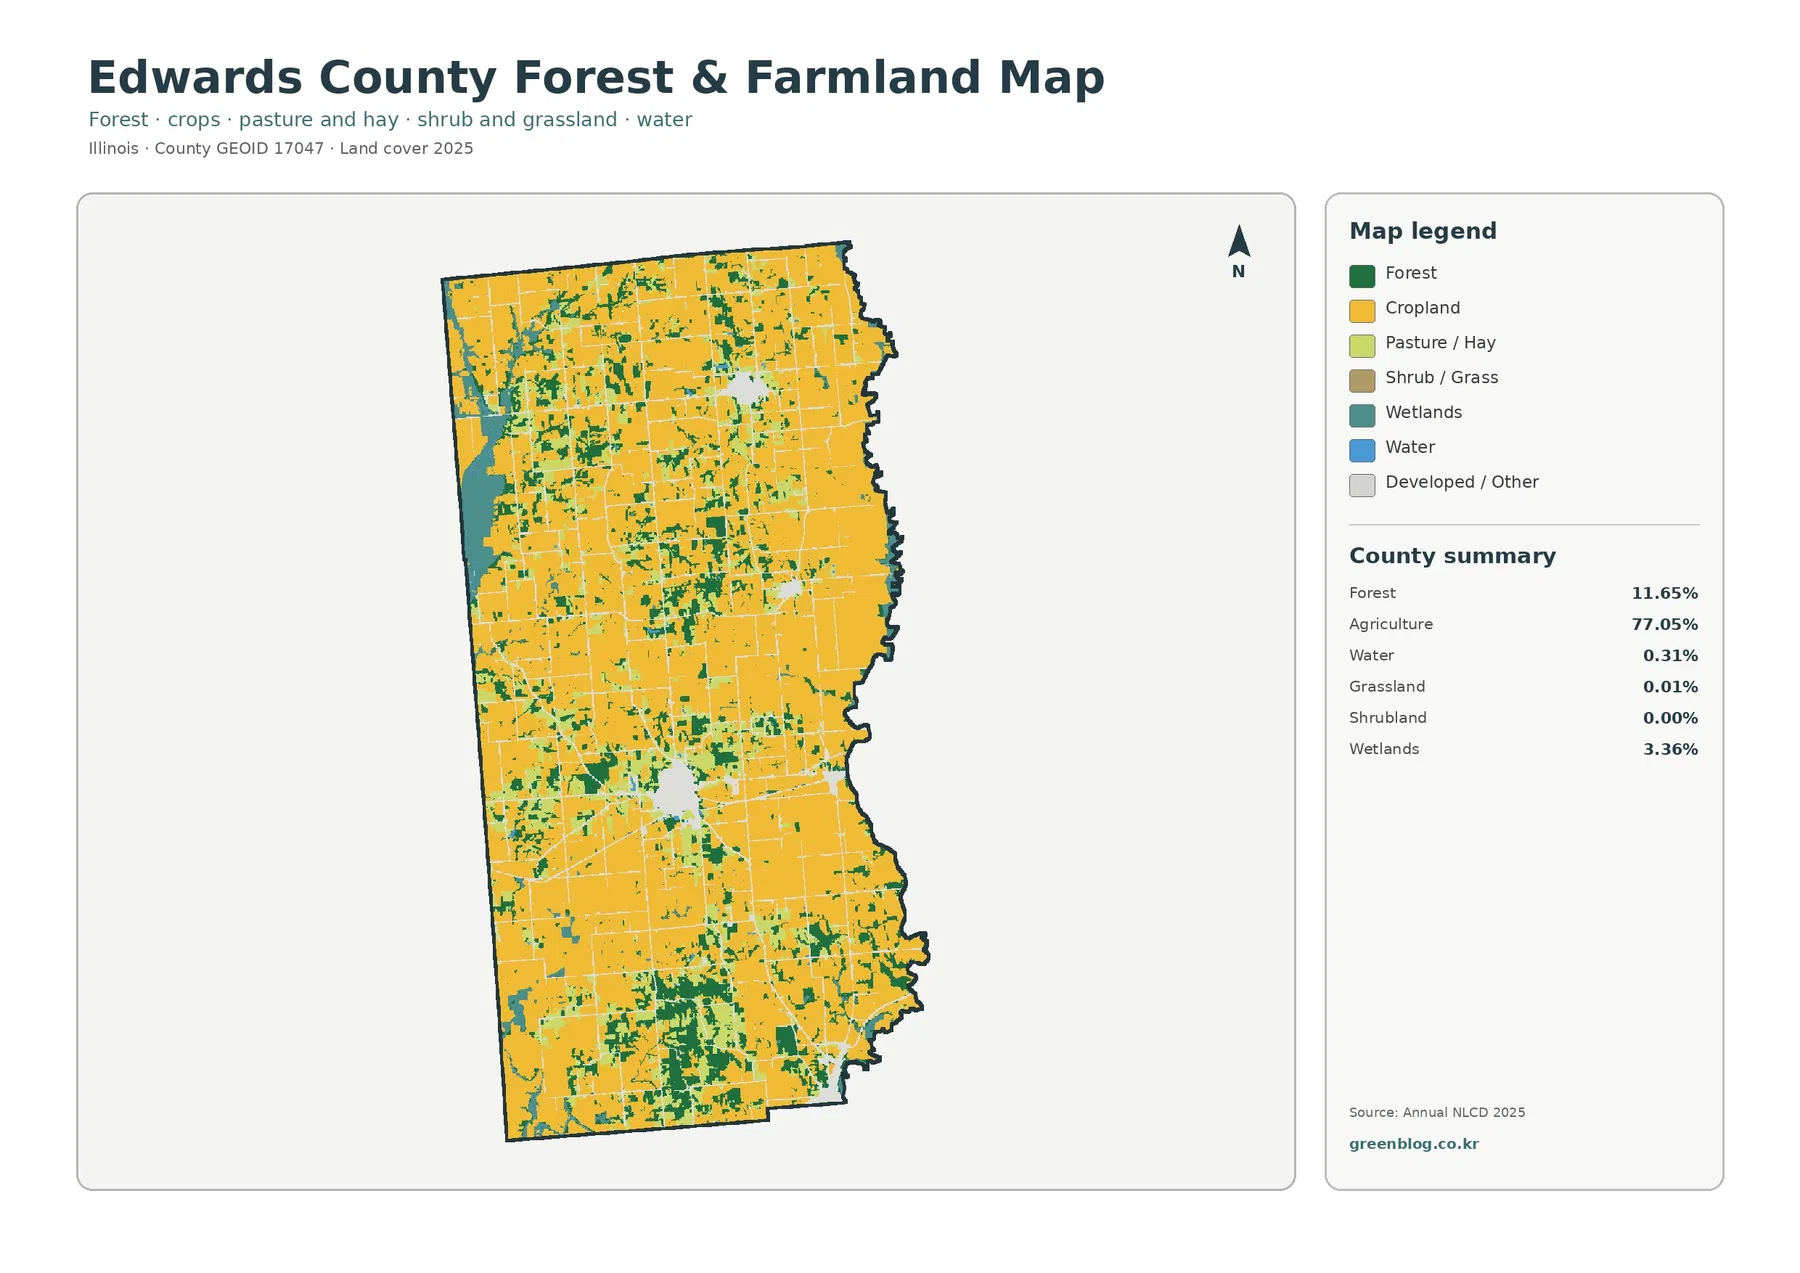
Wetlands account for 3.36%, a much smaller share than forest but still large enough to create distinct teal patches. The western feature in the upper half of the county is especially easy to see here because the surrounding cropland has been simplified. Other wetland cells are scattered near forest patches and across the southern half. Water is only 0.31%, so blue areas are limited, and the summary lists grassland at 0.01% and shrubland at 0.00%. For this county, the main nonfarm natural contrast is therefore forest and wetlands rather than broad grass or shrub cover.
The edges between these categories are irregular rather than clean straight boundaries. In the south, wooded patches branch through the agricultural background and sometimes sit beside wetland cells. Elsewhere, narrow forest strips and small patches appear inside large farm areas. The map supports describing where those covers occur together, but it does not by itself explain why they occur there. A topographic, stream, or soil dataset would be needed before assigning a physical cause to the visible pattern.
Impervious cover stays low countywide and concentrates inside a few built-up nodes
The impervious-surface map changes the visual emphasis completely. Most of the county is nearly blank because the mean impervious fraction is only 1.63%. Areas with at least 50% impervious cover account for just 0.49%, even though 7.61% of Edwards County is classified as developed land. Darker cells are concentrated in the core of the largest settlement cluster, with smaller concentrations in the northern cluster and near the southeastern edge. Roads appear as thin lines of low to moderate impervious cover between them.
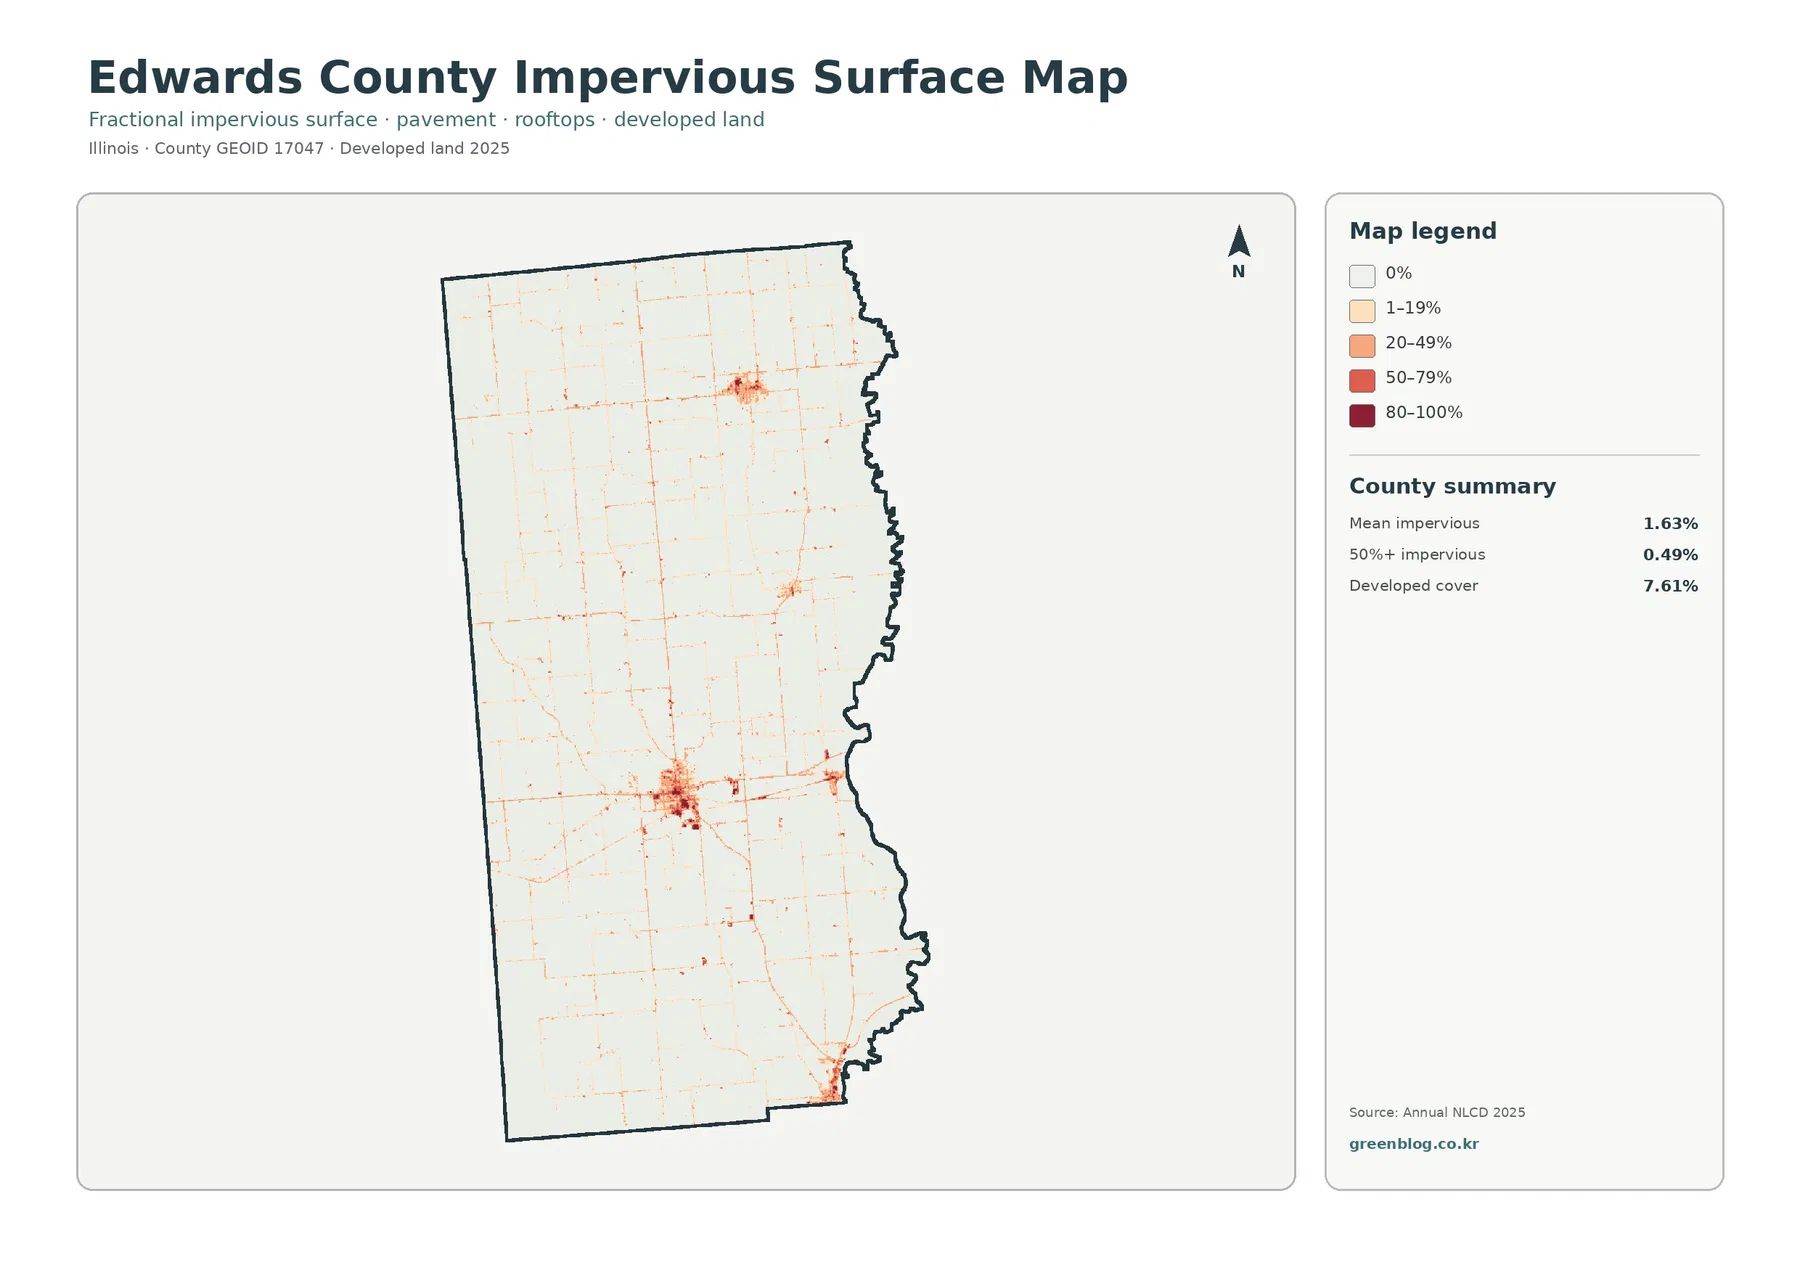
Impervious surface means pavement, rooftops, and similar materials that greatly reduce the amount of water entering the ground. It is not identical to the developed-land class. Lower-intensity developed areas can include substantial vegetation or open ground and therefore have a modest impervious percentage. Reading the 7.61% developed-cover figure beside the 1.63% mean impervious figure gives a more useful picture than treating either number alone as the amount of “urban land.”
For practical comparison, the impervious map is the better choice when the question is about concentrated built surfaces rather than settlement boundaries. The general land-cover map tells the reader where development has been classified, while the fractional map shows how strongly those cells are sealed by hard surfaces. That difference is particularly helpful in Edwards County because thin road lines and small town centers would otherwise be visually overwhelmed by the much larger agricultural area.
The 1985–2025 map is mostly a class-difference map, not a simple urban-growth map
Across the two endpoint years, 10.49% of the county is mapped as a class difference. Only 0.93% is summarized as changing to developed, 0.50% as forest loss, and 0.66% as agricultural loss. The largest component by far is “other class difference” at 8.28%. That composition matters: a reader should not interpret every colored change cell as a confirmed conversion from farms or forest to development.
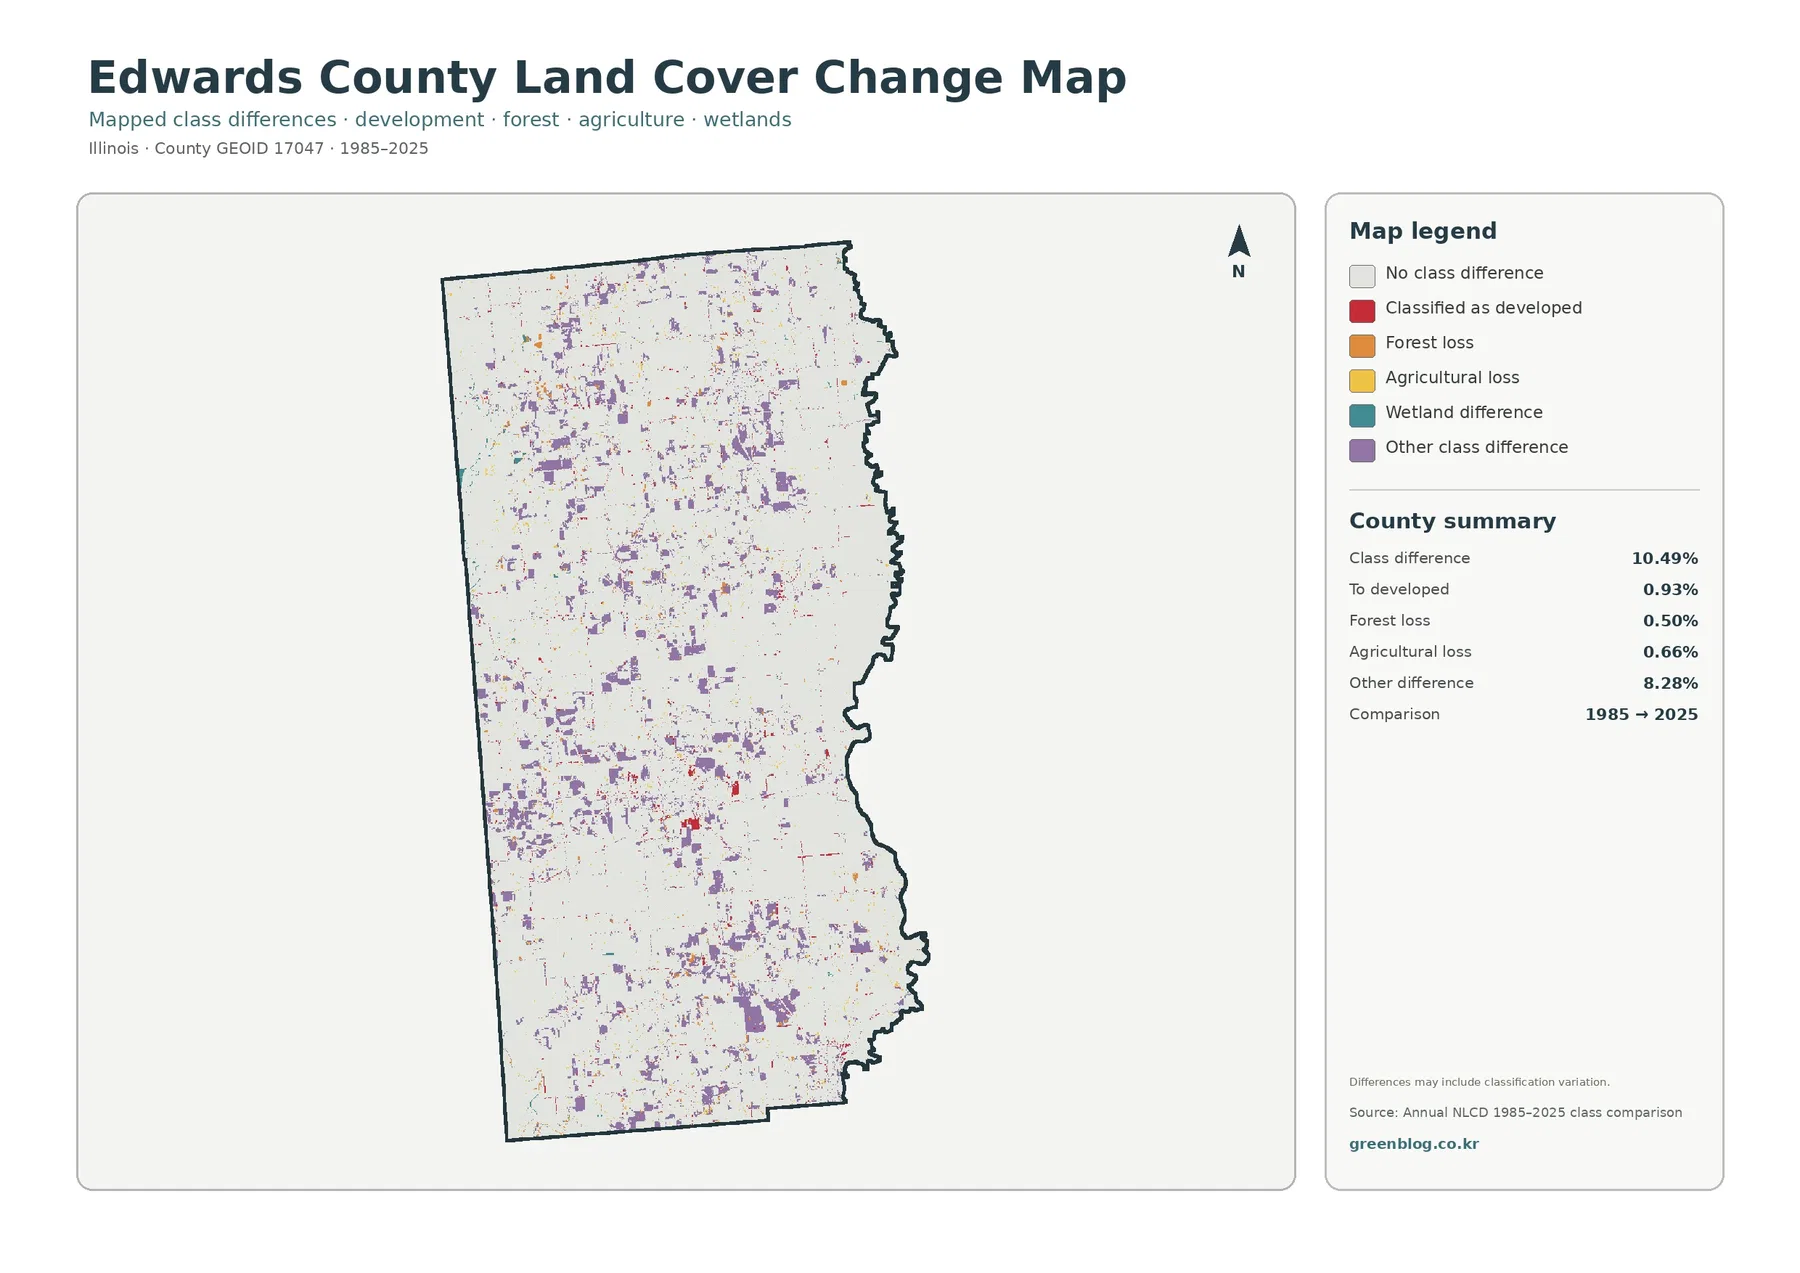
Purple other-difference cells are scattered widely through northern, western, and southern agricultural areas rather than forming one expanding front. Red cells classified as developed are much sparser and tend to occur around existing built-up areas or along thin linear features. Forest-loss and agricultural-loss colors also appear as small pieces rather than a single large block. The spatial pattern therefore supports a cautious reading centered on many local classification differences, with some genuine land-cover change likely included among them.
Annual land-cover comparisons can be affected by mixed pixels, changes in the underlying classification, and small shifts at category edges. The map itself notes that differences may include classification variation. It identifies where 1985 and 2025 do not match, but it cannot tell the exact year a site changed or prove the cause of that change. A site-specific conclusion would require additional dated imagery or local records.
Choose the map that matches the question instead of asking one map to do everything
For a quick county profile, the general land-cover map is the strongest starting point because it puts agriculture, forest, development, wetlands, and water in one frame. The forest-and-farmland map is better for explaining why the southern part of the county looks more wooded and where wetlands interrupt the agricultural background. The impervious map is the clearest choice for compact built surfaces and road lines. The change map should come last, after the reader understands the 2025 pattern that those differences are being compared against.
This division of roles is useful in classroom work, presentations, environmental comparisons, or county-to-county studies. A presentation about farming can lead with the 77.05% agriculture figure and the general map, while a discussion of remaining natural cover can use the 11.65% forest and 3.36% wetland shares with the simplified map. A development-focused comparison can pair the 7.61% developed class with the much smaller 1.63% mean impervious value to explain why “developed” and “hard surface” are not interchangeable terms.
When comparing Edwards County with another county, use the same map type and the same reference year on both sides. Visual area alone can be misleading because county sizes differ, and a small but intense impervious cluster may look less important than a broad low-intensity developed class. The percentage summaries beside the maps provide the numeric context needed to compare the visual patterns more carefully.
County-scale classification has limits that matter near narrow roads, small wetlands, and field edges
Annual NLCD is a raster land-cover product, meaning the landscape is divided into grid cells and each cell receives a representative classification. The land-cover product uses 30-meter cells. Features smaller than a cell—such as a narrow road, a small pond, a strip of trees, or a mixture of lawn and building within one property—can be generalized. A boundary between cropland and forest on the map should therefore be read as a county-scale classification edge, not as a surveyed property line.
The same caution applies to wetlands and developed cover. A teal wetland cell is not a legal wetland determination, and a developed cell does not mean that the entire area is covered by pavement or structures. The impervious map provides a separate fraction for hard surfaces, while local parcel, zoning, ownership, or regulatory questions require different records. These maps are most useful for recognizing broad distributions and comparing categories across the county.
Time is another limitation. The general maps summarize 2025 conditions as classified by the supplied Annual NLCD product, so changes after that observation period are not present. The 1985–2025 comparison uses two endpoints and does not show every intermediate change. If a decision depends on the current condition of a particular field, forest patch, road corridor, or wetland, recent imagery and appropriate local or regulatory information should be checked before drawing a conclusion.
Frequently Asked Questions
What is the dominant 2025 land-cover class in Edwards County?
Agriculture is the dominant class at 77.05%. Forest is 11.65%, developed land 7.61%, wetlands 3.36%, and water 0.31%. The maps show the farm background across most of the county, with forest becoming more frequent in the south and wetlands appearing in several distinct patches.
Why is developed land 7.61% while mean impervious cover is only 1.63%?
The two measures describe different things. Developed land is a land-cover class that can include vegetation and open ground in lower-intensity developed areas. Impervious cover measures the fraction occupied by hard surfaces such as pavement and rooftops, so its countywide mean can be much lower.
Does the 10.49% class difference from 1985 to 2025 represent confirmed physical change everywhere?
No. The summary includes 0.93% changed to developed, 0.50% forest loss, 0.66% agricultural loss, and 8.28% other class difference. The map also warns that classification variation may be included, so dated imagery or local records are needed for site-specific confirmation.
Sources and reference material
- MRLC Annual NLCD Data – official access to Annual NLCD land-cover products.
- USGS Annual NLCD Land Cover Classification – official documentation for the Annual NLCD land-cover classes.
- U.S. Census Bureau TIGER/Line Shapefiles – official geographic boundary data used for U.S. counties and other areas.
Map File Information
The download contains four original JPG maps for Edwards County: 2025 land cover, forest and farmland, fractional impervious surface, and mapped class differences from 1985 to 2025.
- Included Versions: land cover, forest and farmland, impervious/developed land, and 1985–2025 land-cover change
- File Type: one ZIP containing four JPG files
- Intended Use: printing, classroom or presentation work, comparing agriculture with forest and wetlands, and reviewing developed or impervious patterns
Related Maps
- Adams County Illinois Land Cover Map
- Alexander County Illinois Land Cover Map
- Bond County Illinois Land Cover Map
Green Map creates custom-edited map images using open geographic data sources such as geoBoundaries, Natural Earth, OpenStreetMap, and government open data.
These maps are edited visual materials, not raw data files, and are provided for education, documents, presentations, and graphic reference.