Wheeler County is not dominated by one simple surface type. The supplied 2025 summary places forest first at 30.16%, wetlands second at 25.41%, then grassland at 14.28%, agriculture at 11.76%, and shrubland at 11.62%. The Wheeler County Georgia Land Cover Map makes that mix visible, with broad wooded and wet areas broken by fields, open vegetation, and several compact developed clusters.
This page pairs the current land-cover image with forest-and-farmland, impervious-surface, and 1985–2025 endpoint-difference views. The four WebP maps can be read with the discussion below, while the original 2480 × 1754-pixel JPG files are available together in one ZIP. The set works best when one map establishes the countywide pattern and a second map is chosen for the specific question about farming, settlements, hard surfaces, wetlands, or long-term classification differences.
Table of Contents
A county of mixed forest, wetlands, fields, and open vegetation rather than one dominant cover
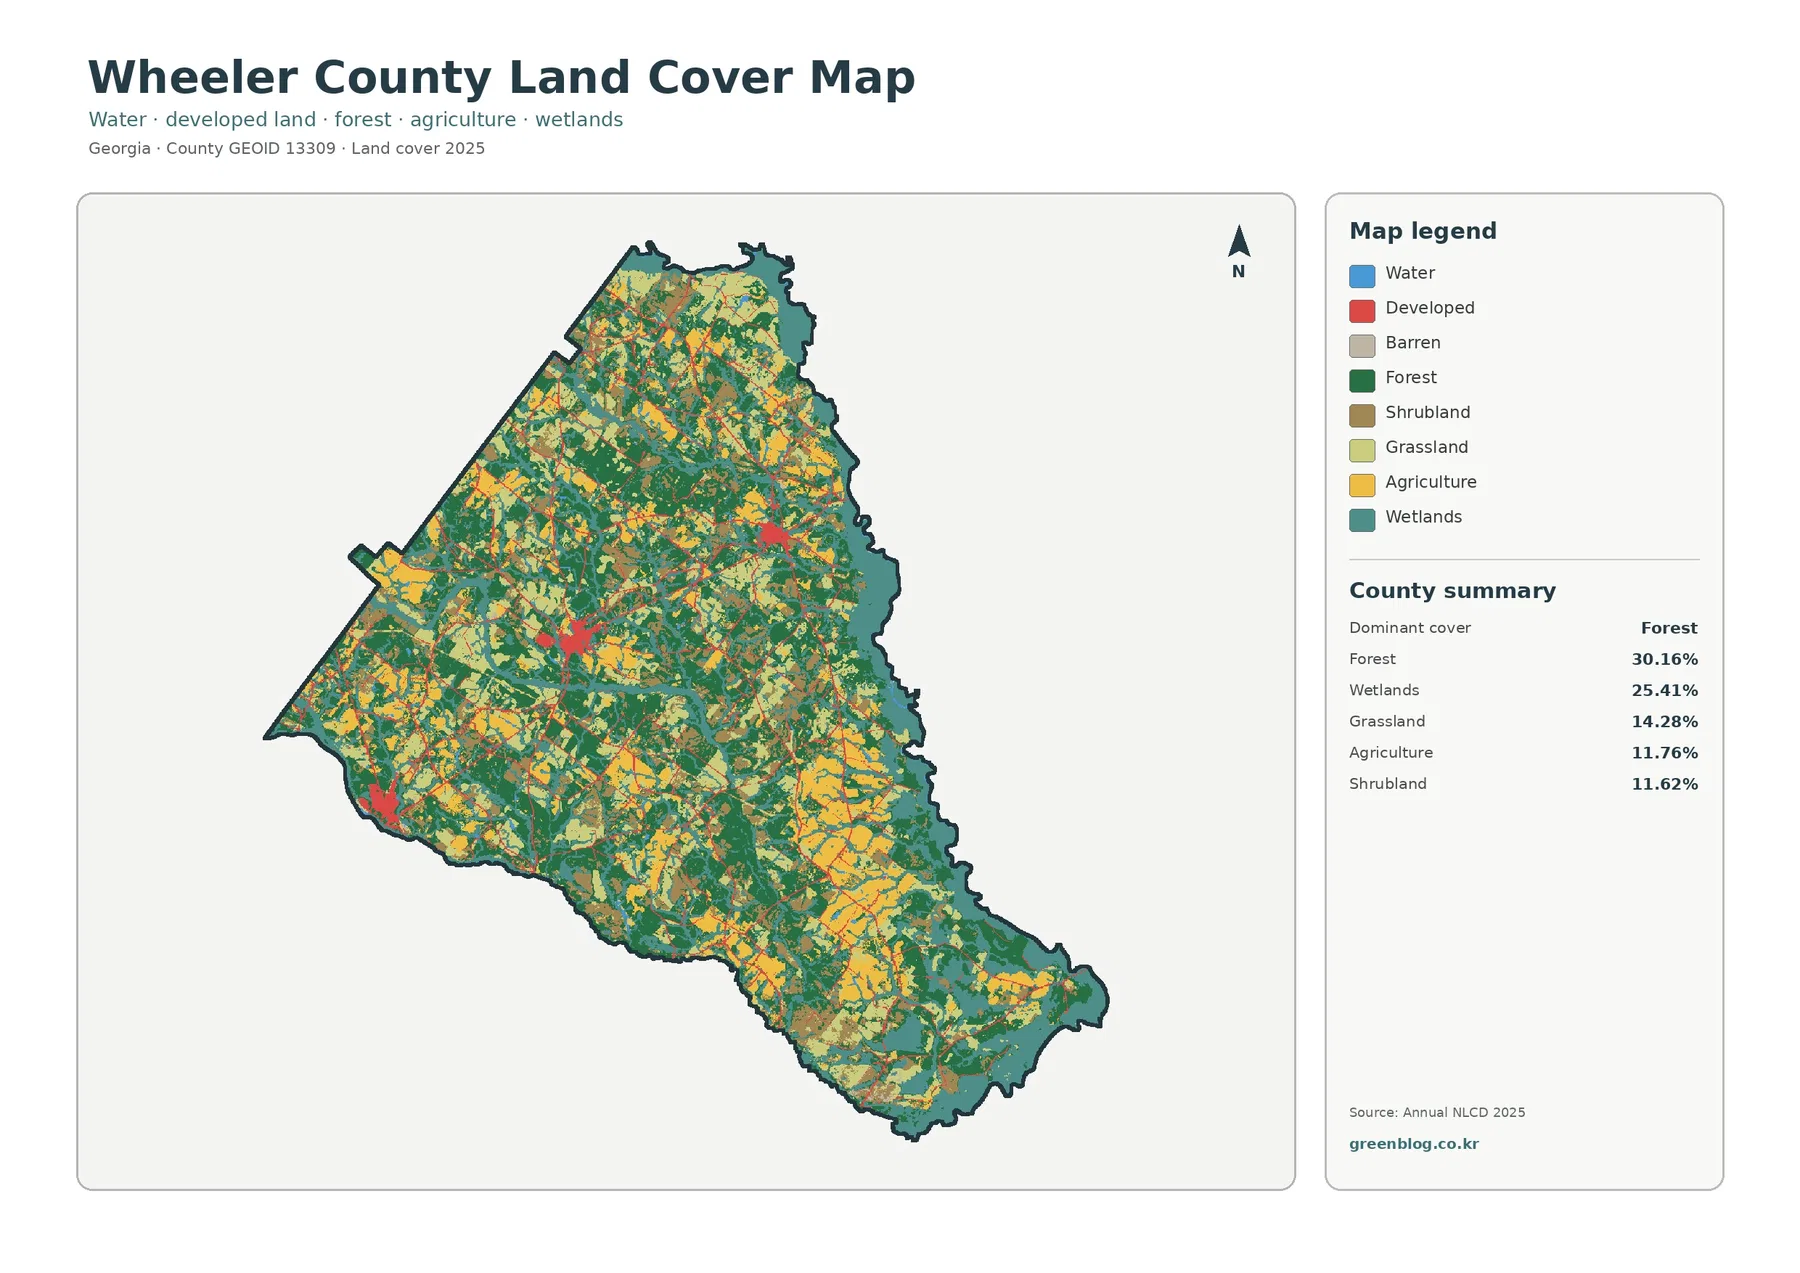
The countywide image is busy because several classes occupy substantial shares. Dark green forest appears in large pieces through the north, center, and south, but it rarely forms an uninterrupted blanket. Teal wetlands are especially conspicuous along the eastern and southeastern edges and also extend through interior drainage areas. Yellow agricultural blocks, lighter grassland, and shrubland repeatedly interrupt those darker colors. The result is a patchwork in which the dominant class, forest, still covers less than one third of the county.
Wheeler County’s official planning material provides useful geographic context for the wet eastern and southern margins. Georgia’s Department of Community Affairs identifies the Oconee River along the eastern boundary and the Ocmulgee River along the southeastern boundary, and the county’s planning goals specifically mention rivers, wetlands, floodplains, and open rural landscapes. That local setting is consistent with the broad wetland colors along those edges. The land-cover graphic itself does not draw legal wetland boundaries or named river centerlines, so an individual teal cell should not be treated as a regulatory determination.
Grassland and shrubland matter here more than they do in many county summaries. Grassland accounts for 14.28% and shrubland for 11.62%, giving open or lower-stature vegetation a major role between the forest, wet areas, and farmland. Those classes can include different real-world conditions, and the categorical image does not tell a reader whether a particular patch is a maintained field edge, recently disturbed vegetation, natural low growth, or another site condition. The safest interpretation is simply that the mapped surface was assigned to the grassland or shrubland class in the 2025 product.
Agriculture covers 11.76% and forms larger yellow blocks in parts of the southern half, with additional fields scattered through the center and west. University of Georgia Extension describes Wheeler County as agriculturally diverse and highlights timber and pine straw, cattle and hay, watermelons, and row crops. That information explains why working lands are an important part of the local landscape, but the NLCD map does not identify individual commodities. A yellow cell can support a discussion of agricultural cover; it cannot prove that a particular field is planted in cotton, watermelon, or another crop.
The forest-and-farmland view separates working land from the broad wet river margins
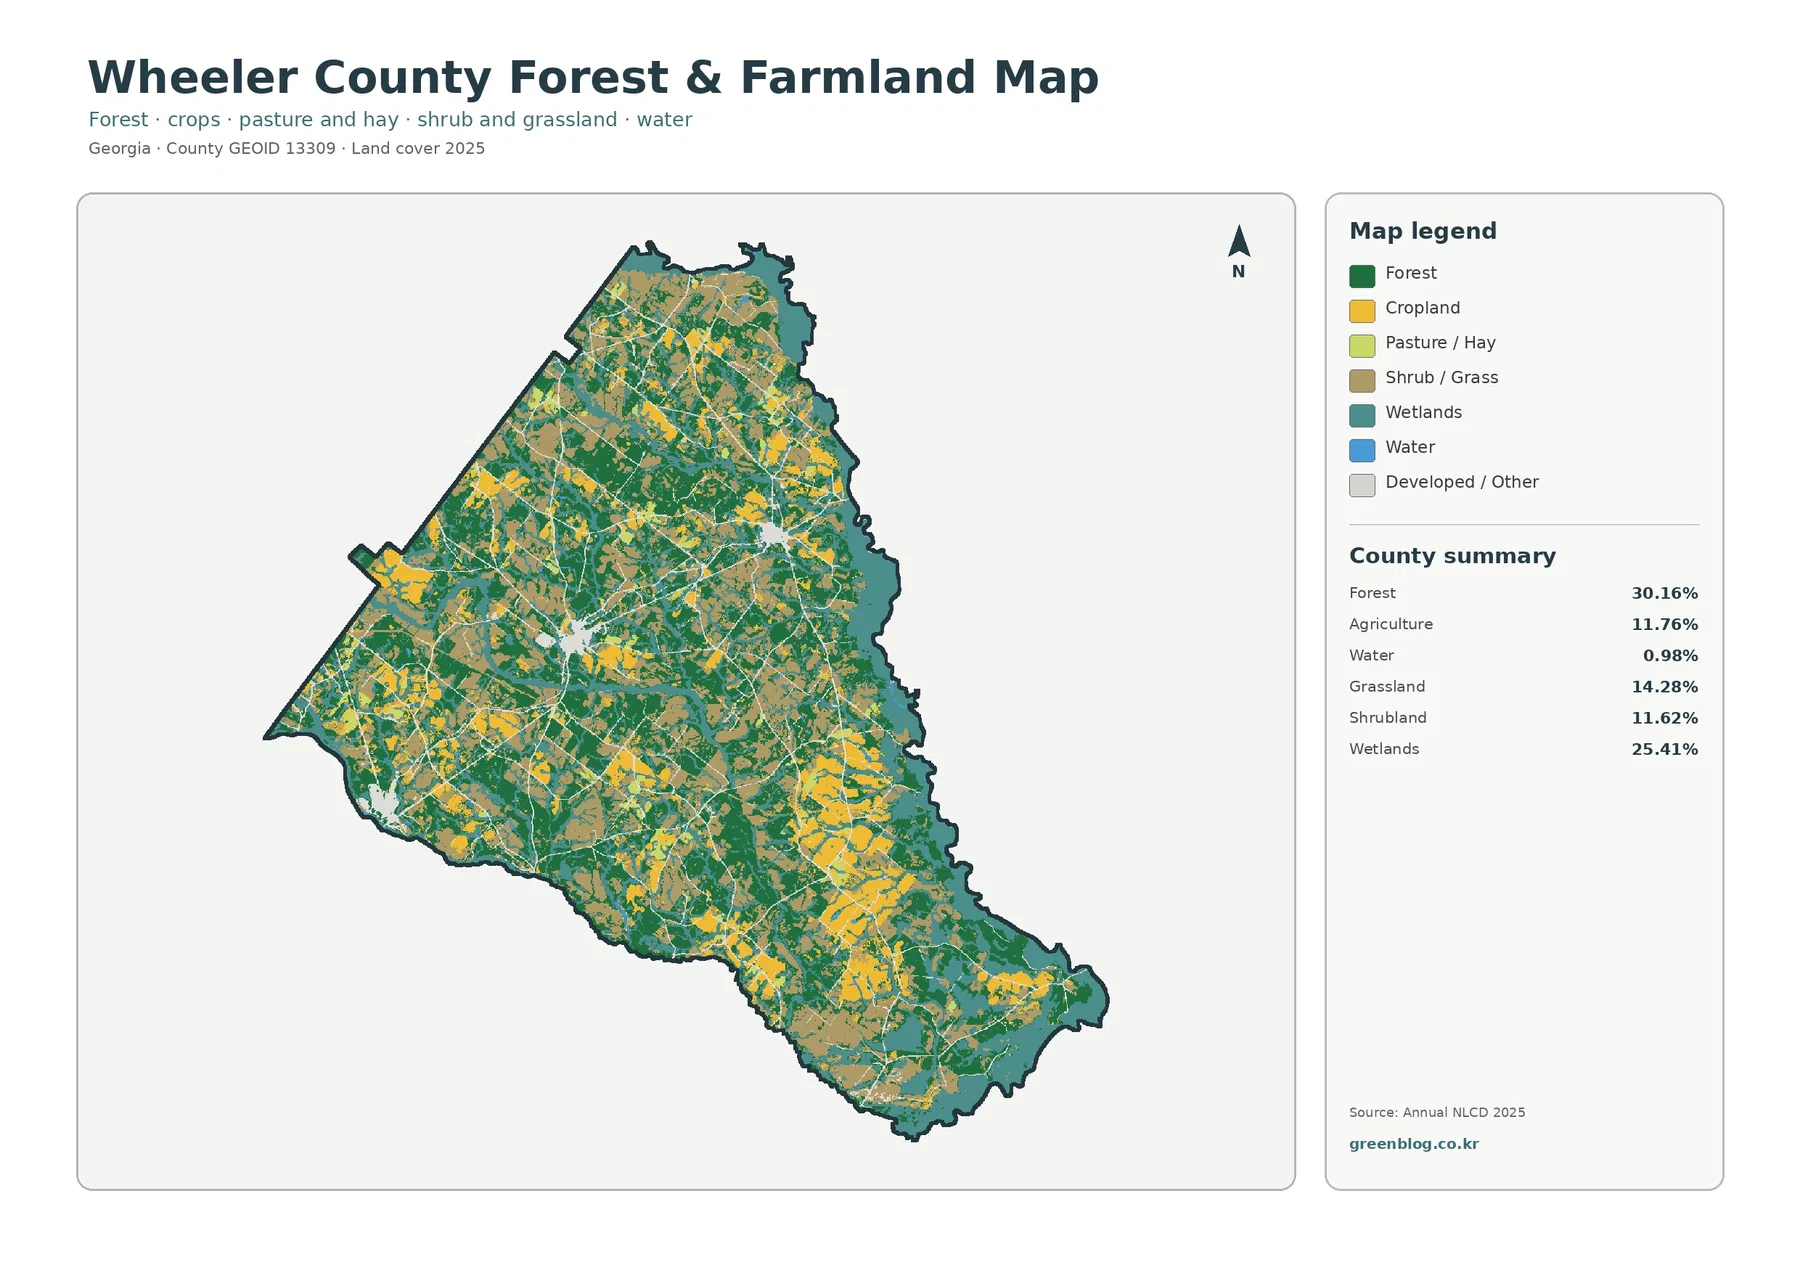
Removing much of the developed detail makes the farm-and-forest relationship easier to follow. Cropland is not confined to one corner. Larger agricultural blocks appear in the southeast and parts of the south-central area, while smaller fields recur in the west and center. Forest surrounds or separates many of these blocks, and wetlands remain visible along the river-side margins and internal low areas. A lesson about rural land cover can therefore use this image to show that Wheeler County’s working land is interspersed with natural cover rather than arranged as one continuous agricultural plain.
The contrast between open water and wetlands is also clearer in this version. Open water is only 0.98% in the supplied summary, yet wetlands cover 25.41%. Blue water surfaces are consequently limited, while teal wetland areas occupy much broader bands and patches. Wetland cover may include vegetation and seasonally saturated ground, so a large teal area does not mean the same thing as a lake or permanently open channel. Keeping those categories separate avoids exaggerating how much of the county is covered by visible water.
Forest remains the largest single class at 30.16%, and its geographic spread fits the county’s current natural-resource context. UGA Extension describes timber and pine straw as the county’s largest industry, while the Georgia Forestry Commission maintains a Wheeler County forestry contact and service structure. Those sources do not mean every green pixel is commercial timberland; the map does not contain ownership, management status, or tree-species information. They do, however, provide county-specific context for why a sizeable forest share is meaningful rather than merely a statistical label.
For practical map reading, the best comparisons are often at the edges between classes. In several places a field gives way directly to forest, while elsewhere wetlands separate agricultural and wooded areas. Pasture or hay and shrub/grass colors create another layer between those categories. These contacts are useful for county profiles, environmental education, and broad habitat discussions, but they are generalized 30-meter classifications rather than survey lines. A landowner should not use a color boundary on this image as a parcel boundary or management prescription.
Hard surfaces stay below a 1% countywide mean but cluster around Alamo, Glenwood, and road connections
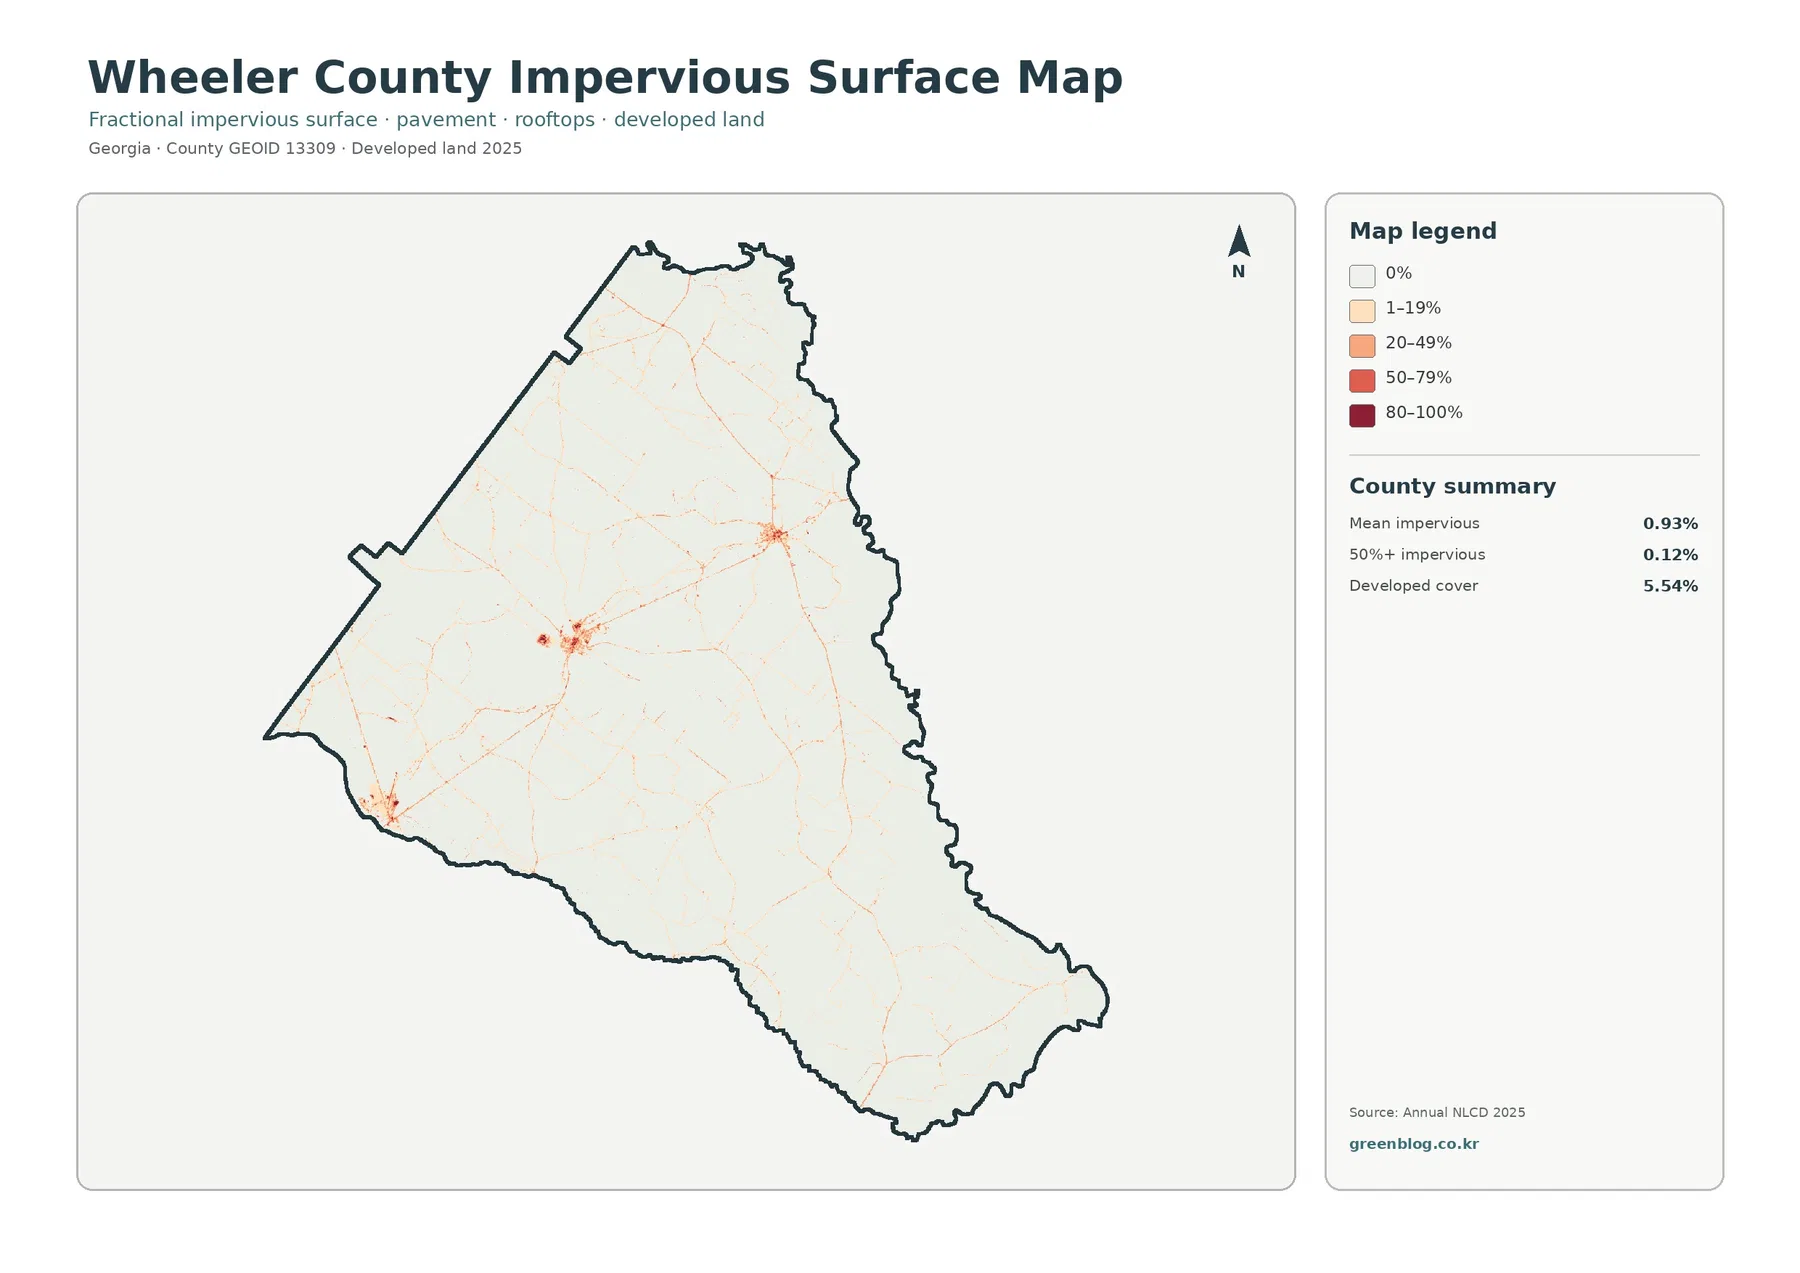
Impervious surface means hard material such as rooftops, paved roads, and parking areas where water does not readily soak into the ground. Wheeler County’s mean impervious cover is 0.93%, and only 0.12% of the county is reported above 50% imperviousness. Developed land, by contrast, covers 5.54%. The difference is expected because a developed land-cover class can include lawns, trees, exposed soil, and other permeable ground around buildings and streets, while the impervious layer measures the hard-surface fraction more directly.
Two of the strongest clusters align with the county’s two incorporated communities. Georgia DOT’s county highway map places Alamo in the west-central part of Wheeler County and Glenwood farther northeast, both on the US 280/SR 30 corridor. The City of Alamo also describes Alamo as the county seat at the intersection of GA 126 and US 280. In the supplied impervious image, compact high-intensity patches occur in those general areas, with thin lines extending outward along transportation routes. Because the graphic does not label streets or city limits, the pattern should be used for broad settlement context rather than precise municipal mapping.
A smaller strong patch appears near the southwestern side, and faint linear traces reach through much of the county. These details matter because a low countywide average can hide meaningful local concentrations. Most of Wheeler County is pale on the impervious map, reflecting the broad forest, wetland, agricultural, and open-land cover seen in the other views. Around settlement centers and selected roads, however, the surface fraction rises sharply enough to stand out even at county scale.
This distinction is useful in presentations about runoff or development intensity. The 5.54% developed-cover share tells how much land belongs to the developed classes, while the 0.93% impervious mean indicates the average hard-surface fraction across the entire county. Neither number alone describes the exact amount of pavement in a town, and neither establishes drainage performance at a site. Local engineering, stormwater, or parcel questions require more detailed and current information.
The 1985–2025 comparison records widespread endpoint differences, led by forest and agricultural loss classes
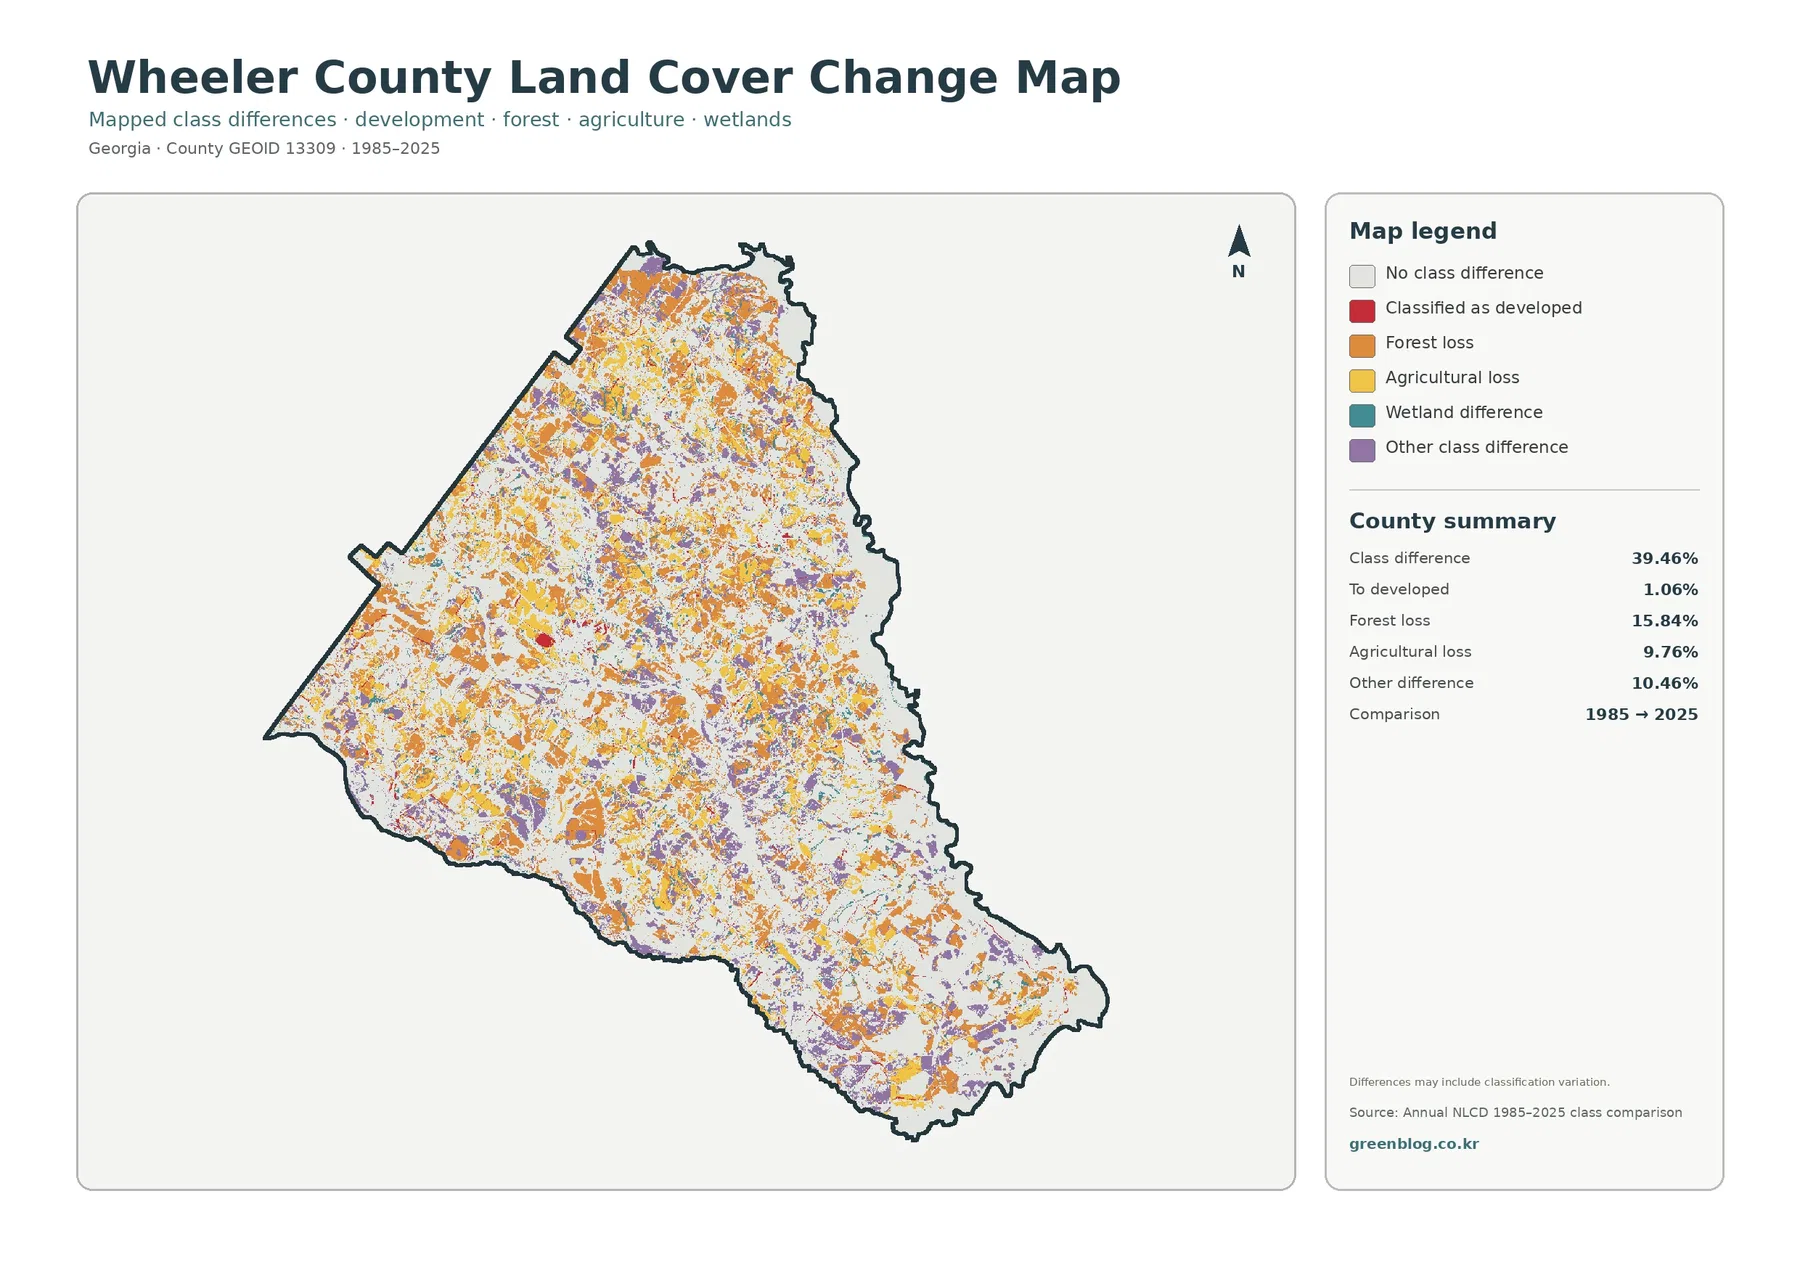
The endpoint comparison reports a class difference across 39.46% of Wheeler County. Forest loss accounts for 15.84%, agricultural loss for 9.76%, cells classified as developed at the 2025 endpoint for 1.06%, and other class differences for 10.46%. Wetland difference is also a mapped category, although the supplied summary does not print its percentage separately. The total is therefore a mixture of several class transitions and possible classification variation, not a single measure of urban expansion.
Orange forest-loss cells are spread widely through the county rather than forming one isolated zone. Yellow agricultural-loss cells are also common, particularly in the same mixed landscapes where current forest, agriculture, grassland, and shrubland meet. That distribution makes the change layer visually different from the impervious map: hard surfaces are concentrated in a few settlement clusters, while forest and agricultural endpoint differences are scattered across broad rural areas.
Current land cover and endpoint change answer different questions. Forest can still be the largest 2025 class at 30.16% even though 15.84% is categorized as forest loss in the two-date comparison. A cell may have been harvested, regrown into another stage, converted to another cover, or affected by classification variation. The map does not identify the event or year that produced a difference. The same caution applies to the 9.76% agricultural-loss category: it records a different endpoint classification, not a complete history of farm operations over forty years.
Developed endpoint differences are much smaller at 1.06% and appear most clearly around the settlement and road patterns already visible in the hard-surface map. Pairing those two maps can help identify areas for closer review, but a red cell does not reveal when a building was constructed or why a location changed class. Historical aerial photographs, annual land-cover layers, permits, and local records are needed to establish timing and cause.
Read the colors as 30-meter classifications, not zoning, ownership, or legal boundaries
Annual NLCD is a raster dataset, meaning the landscape is divided into grid cells. The product used for these maps works at about 30 meters per cell. One cell may contain a field edge, several trees, grass, a ditch, a narrow road, and part of a building, yet the categorical layer assigns one predominant land-cover class. That level of generalization is appropriate for county-scale patterns but cannot resolve every small feature visible on the ground.
Land cover is also different from legal land use. A yellow agricultural cell does not prove agricultural zoning, and a red developed cell does not reveal whether a parcel is residential, commercial, industrial, or public. Teal wetland cover is not a jurisdictional wetland boundary. Ownership, development rights, permits, flood regulation, wetland jurisdiction, and engineering decisions require current specialized records and often field-level review.
The current maps represent the supplied 2025 observation year. Timber harvest, regrowth, crop rotation, new construction, flooding, and water-level changes after that date may not appear. The 1985–2025 comparison is also an endpoint snapshot rather than a year-by-year record. A place can change several times between the two dates and still end in a class similar to where it started, leaving those intermediate events invisible in a simple start-versus-end comparison.
These limits define the right use rather than making the maps unhelpful. The set is strong for describing Wheeler County’s broad land-cover mix, contrasting the river-side wet areas with inland fields and forest, locating settlement-scale hard-surface concentrations, and screening where endpoint differences are widespread. Questions about a specific property, wetland permit, road project, or current site condition should move to higher-resolution imagery and authoritative local records.
Build a clearer presentation by choosing one primary JPG and one supporting comparison
For a general county profile, begin with the 2025 land-cover overview. It establishes the unusual balance among forest, wetlands, grassland, agriculture, and shrubland and keeps the small developed clusters in context. A natural-resource or farming discussion can then switch to the forest-and-farmland image, where cropland, pasture or hay, forest, and wet areas are easier to distinguish without the full set of developed classes competing for attention.
A settlement-focused presentation is better served by the impervious map. Alamo and Glenwood emerge as compact hard-surface centers against a much lighter rural background, and the connecting road patterns remain visible. The endpoint-difference layer should usually come later, after the audience understands the 2025 classes. That order reduces the chance that orange forest-loss or purple other-difference cells will be mistaken for current land-cover categories.
Each original JPG is 2480 × 1754 pixels. The asset manifest does not mark the files as meeting an A3 high-resolution reference, so a large-format print should be proofed before final use. For ordinary screens, reports, classroom handouts, and presentation slides, a full-size single map followed by a targeted second comparison is usually easier to read than reducing all four into a small grid.
Frequently Asked Questions
Is Wheeler County mostly forest or wetland?
Forest is the largest individual 2025 class at 30.16%, but wetlands are close behind at 25.41%. Grassland adds 14.28%, agriculture 11.76%, and shrubland 11.62%. Wheeler County is better described as a mixed forest-and-wetland landscape with substantial open and agricultural cover than as a county dominated by only one class.
Why does the impervious map emphasize only a few places when developed land covers 5.54%?
Developed land can include lawns, trees, soil, and other permeable surfaces around buildings and roads. Impervious cover isolates hard materials such as rooftops and pavement. The countywide mean is only 0.93%, so Alamo, Glenwood, and a few smaller hard-surface concentrations stand out strongly against the much lighter rural background.
Does the 39.46% class difference mean that nearly two-fifths of Wheeler County became developed?
No. Only 1.06% is listed as classified to developed at the 2025 endpoint. The 39.46% total also includes 15.84% forest loss, 9.76% agricultural loss, 10.46% other differences, and the wetland-difference category shown in the legend. The map compares two endpoints and does not identify the cause or exact year of each change.
Sources and Reference Data
- MRLC Annual NLCD Data – official access point for the current land-cover and endpoint-comparison products used by this map set.
- USGS Annual NLCD Land Cover Classification – definitions for forest, agriculture, wetlands, developed land, and other Annual NLCD classes.
- Georgia DCA – Wheeler County, Alamo & Glenwood Comprehensive Plan – official planning material covering the county’s river corridors, wetlands, rural landscape, and communities.
- UGA Extension – Wheeler County Our Impact – county-specific background on timber, pine straw, cattle, hay, watermelon, row crops, and other local agricultural activity.
- Georgia DOT – Wheeler County Highway Map – official road and place reference for Alamo, Glenwood, US 280, and other major routes.
Map File Information
The ZIP contains the four original JPG maps used to compare Wheeler County's forest, wetlands, working lands, settlement hard surfaces, and 1985–2025 endpoint differences.
- Included Files: Map images described in this article
- File Type: ZIP archive
- Intended Use: Printing, education, presentations, and map-based projects
Related Maps
- Appling County Georgia Land Cover Map
- Atkinson County Georgia Land Cover Map
- Bacon County Georgia Land Cover Map
Green Map creates custom-edited map images using open geographic data sources such as geoBoundaries, Natural Earth, OpenStreetMap, and government open data. These maps are edited visual materials, not raw data files, and are provided for education, documents, presentations, and graphic reference.