Agriculture controls the broad appearance of Adams County in the supplied 2025 data. It covers 67.67% of the county, while forest accounts for 18.85%, developed land for 8.76%, wetlands for 2.68%, and open water for 1.78%. The Adams County Illinois Land Cover Map makes that hierarchy visible: large farm blocks dominate the interior, wooded strips break up the fields, and the western edge has a very different riverfront pattern.
This page uses four related views rather than treating land cover as a single picture. The 2025 overview establishes the present distribution, the forest-and-farmland version removes much of the urban emphasis, the impervious map isolates hard surfaces, and the 1985–2025 layer compares endpoint classifications. Four original 2480 × 1754-pixel JPG files are packaged in one ZIP below for lessons, presentations, county profiles, and side-by-side map work.
Table of Contents
The Mississippi River edge and the Quincy cluster break the farm-dominated pattern
Most of the county is a broad yellow agricultural field on the general map, but the western boundary looks different immediately. Blue open water follows the county edge, teal wetland cells occupy parts of the river bottoms, and the largest red developed cluster sits next to that corridor. The contrast is strong enough that the river side can be understood before reading any percentage table.
Adams County government notes that the county runs along the Mississippi River and contains extensive floodplain and drainage-district land. Quincy, the county seat and largest urban concentration, is also described by the city as being on the banks of the Mississippi River. Those official descriptions fit the map well: the major built-up cluster is on the western side, while water and wet ground remain close to the same edge. The land-cover colors do not define city limits, levees, or regulatory flood zones.
A county with 67.67% agriculture still has a strong wooded network
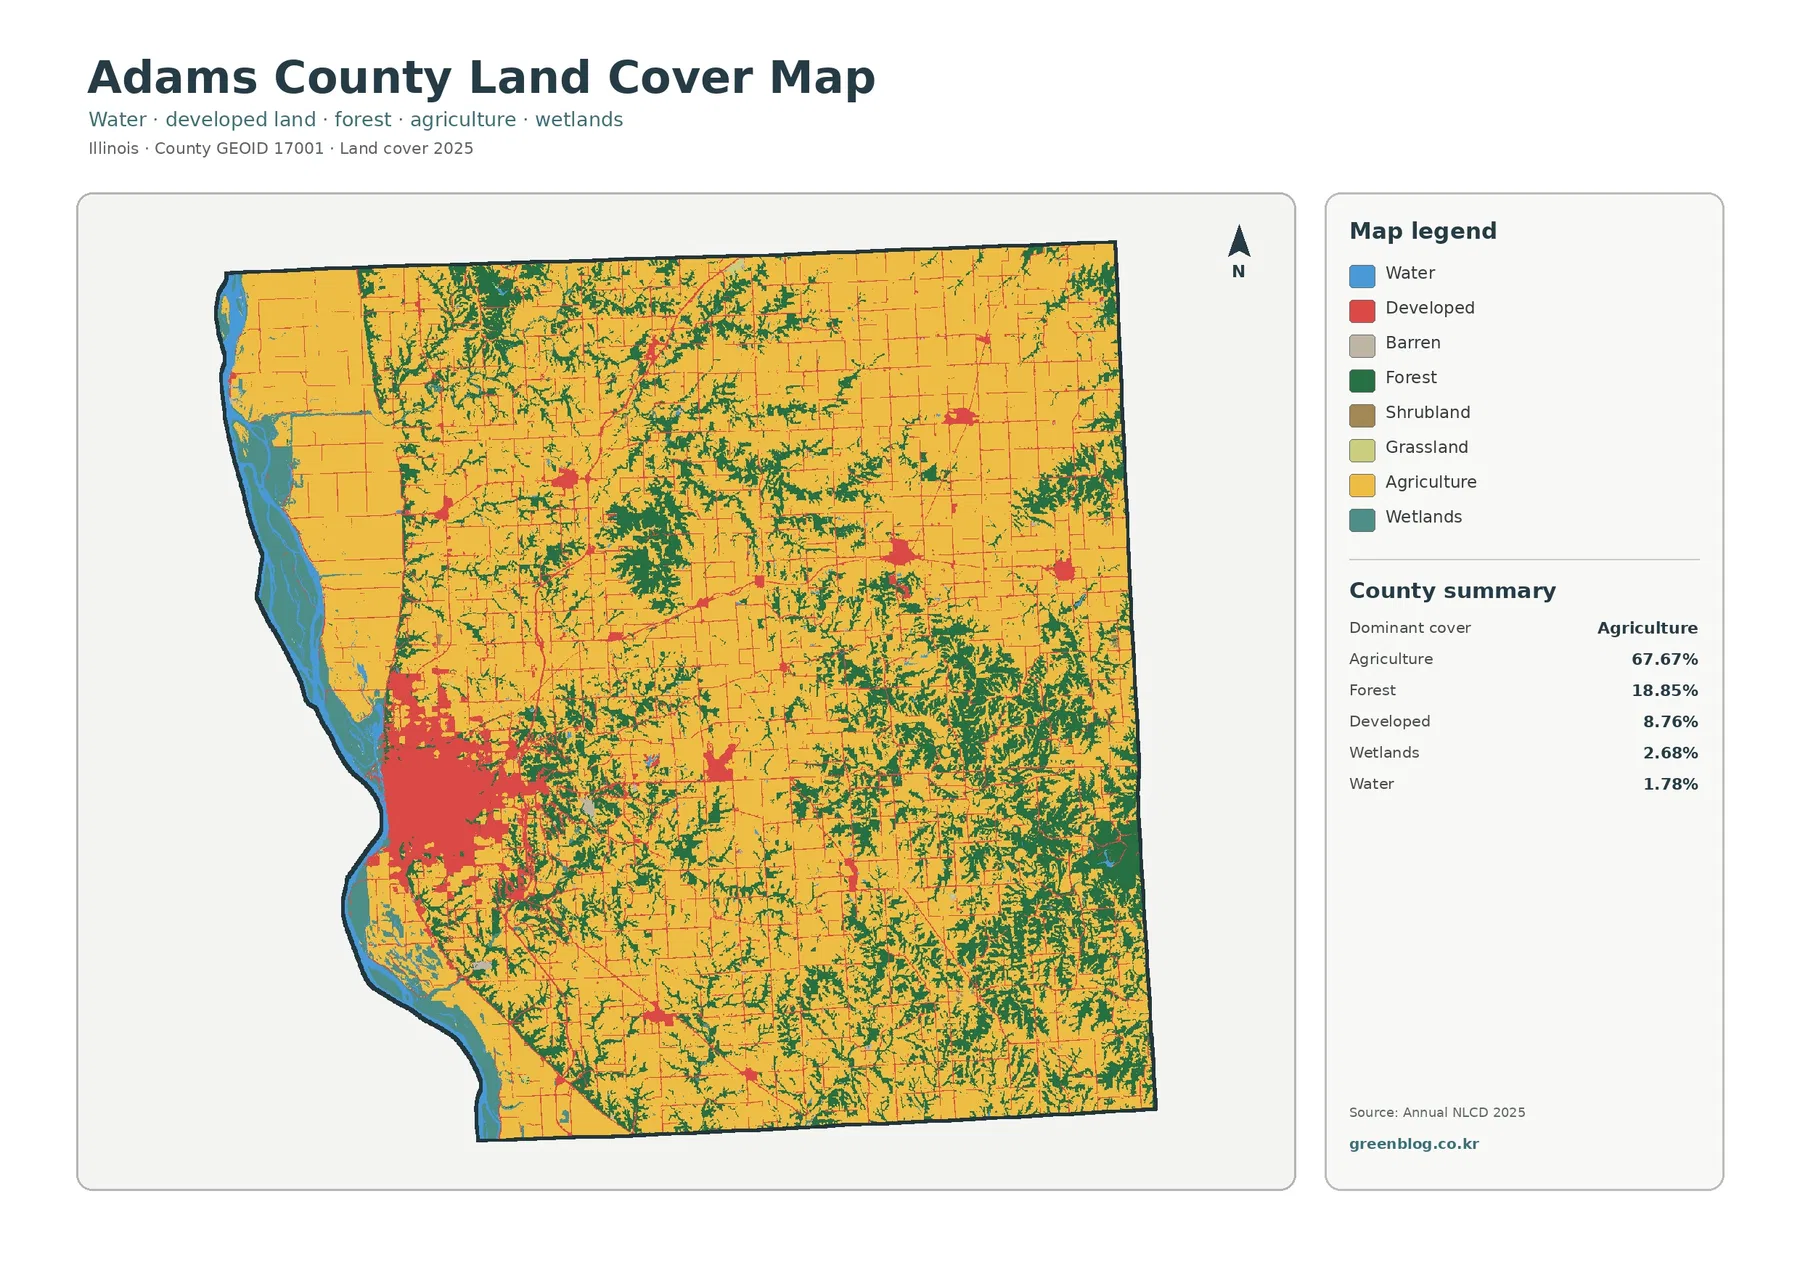
Agriculture extends across the north, center, and south in large connected blocks. Its 67.67% share is therefore visible as well as numerical. The pattern is not perfectly uniform, however. Forest cuts through many of the fields in narrow, branching shapes, and larger green patches become more noticeable in the eastern and southeastern parts of the county.
Developed land at 8.76% is also more complex than a simple city footprint. NLCD developed classes can contain lawns, trees, bare soil, and other permeable surfaces around roads and buildings. That is why the developed percentage should not be compared directly with the amount of pavement or roof cover. The impervious layer later in the article isolates that harder-surface question.
The vegetation-focused map strips away much of the urban distraction
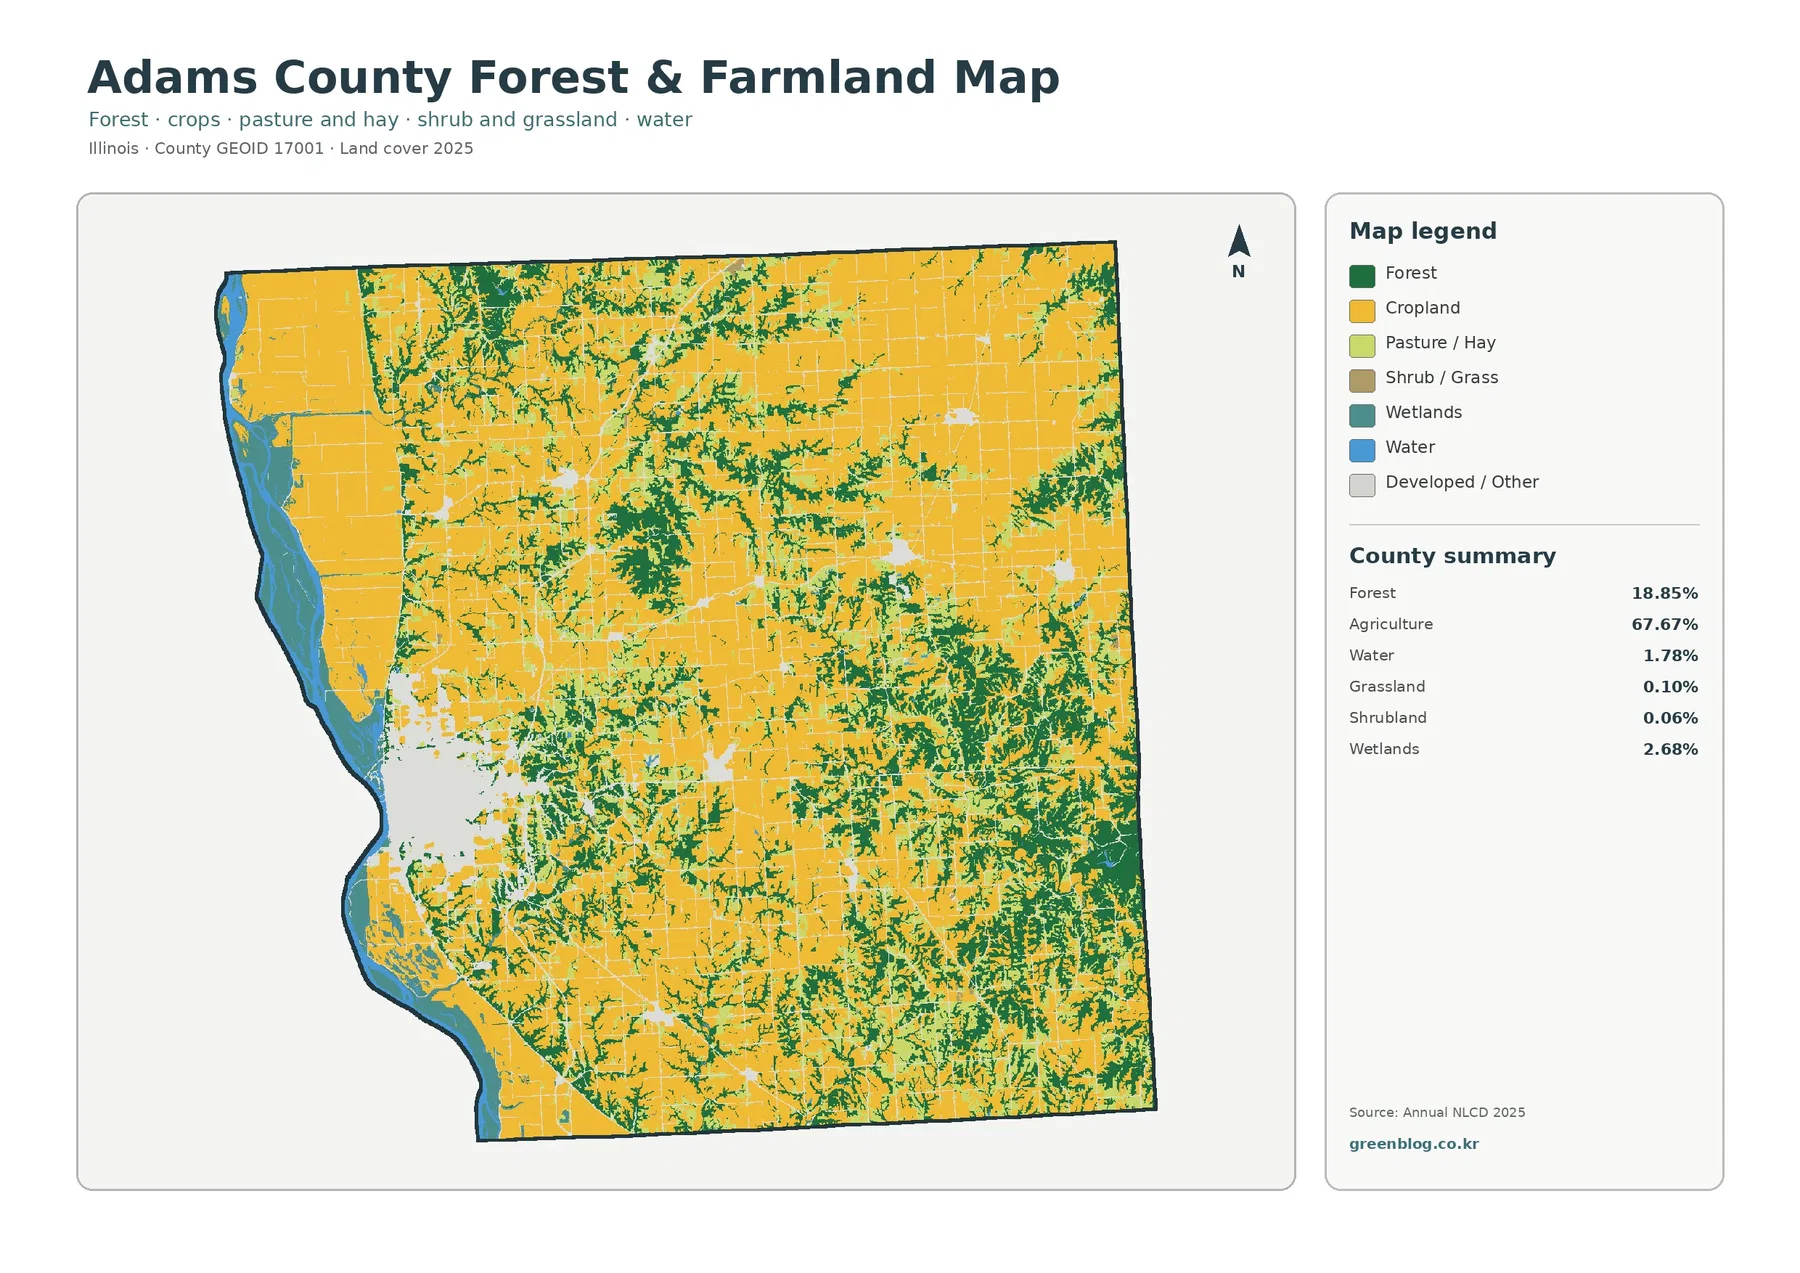
Once developed and miscellaneous surfaces are faded, the dominance of cropland becomes even clearer. Yellow agricultural blocks fill most of the county, while dark green forest repeatedly divides the fields. The western river corridor remains easy to identify because water and wetland colors stay visible. This version is useful when the question is about farm-natural-cover relationships rather than urban form.
Hard surfaces are concentrated in Quincy even though the countywide mean is low
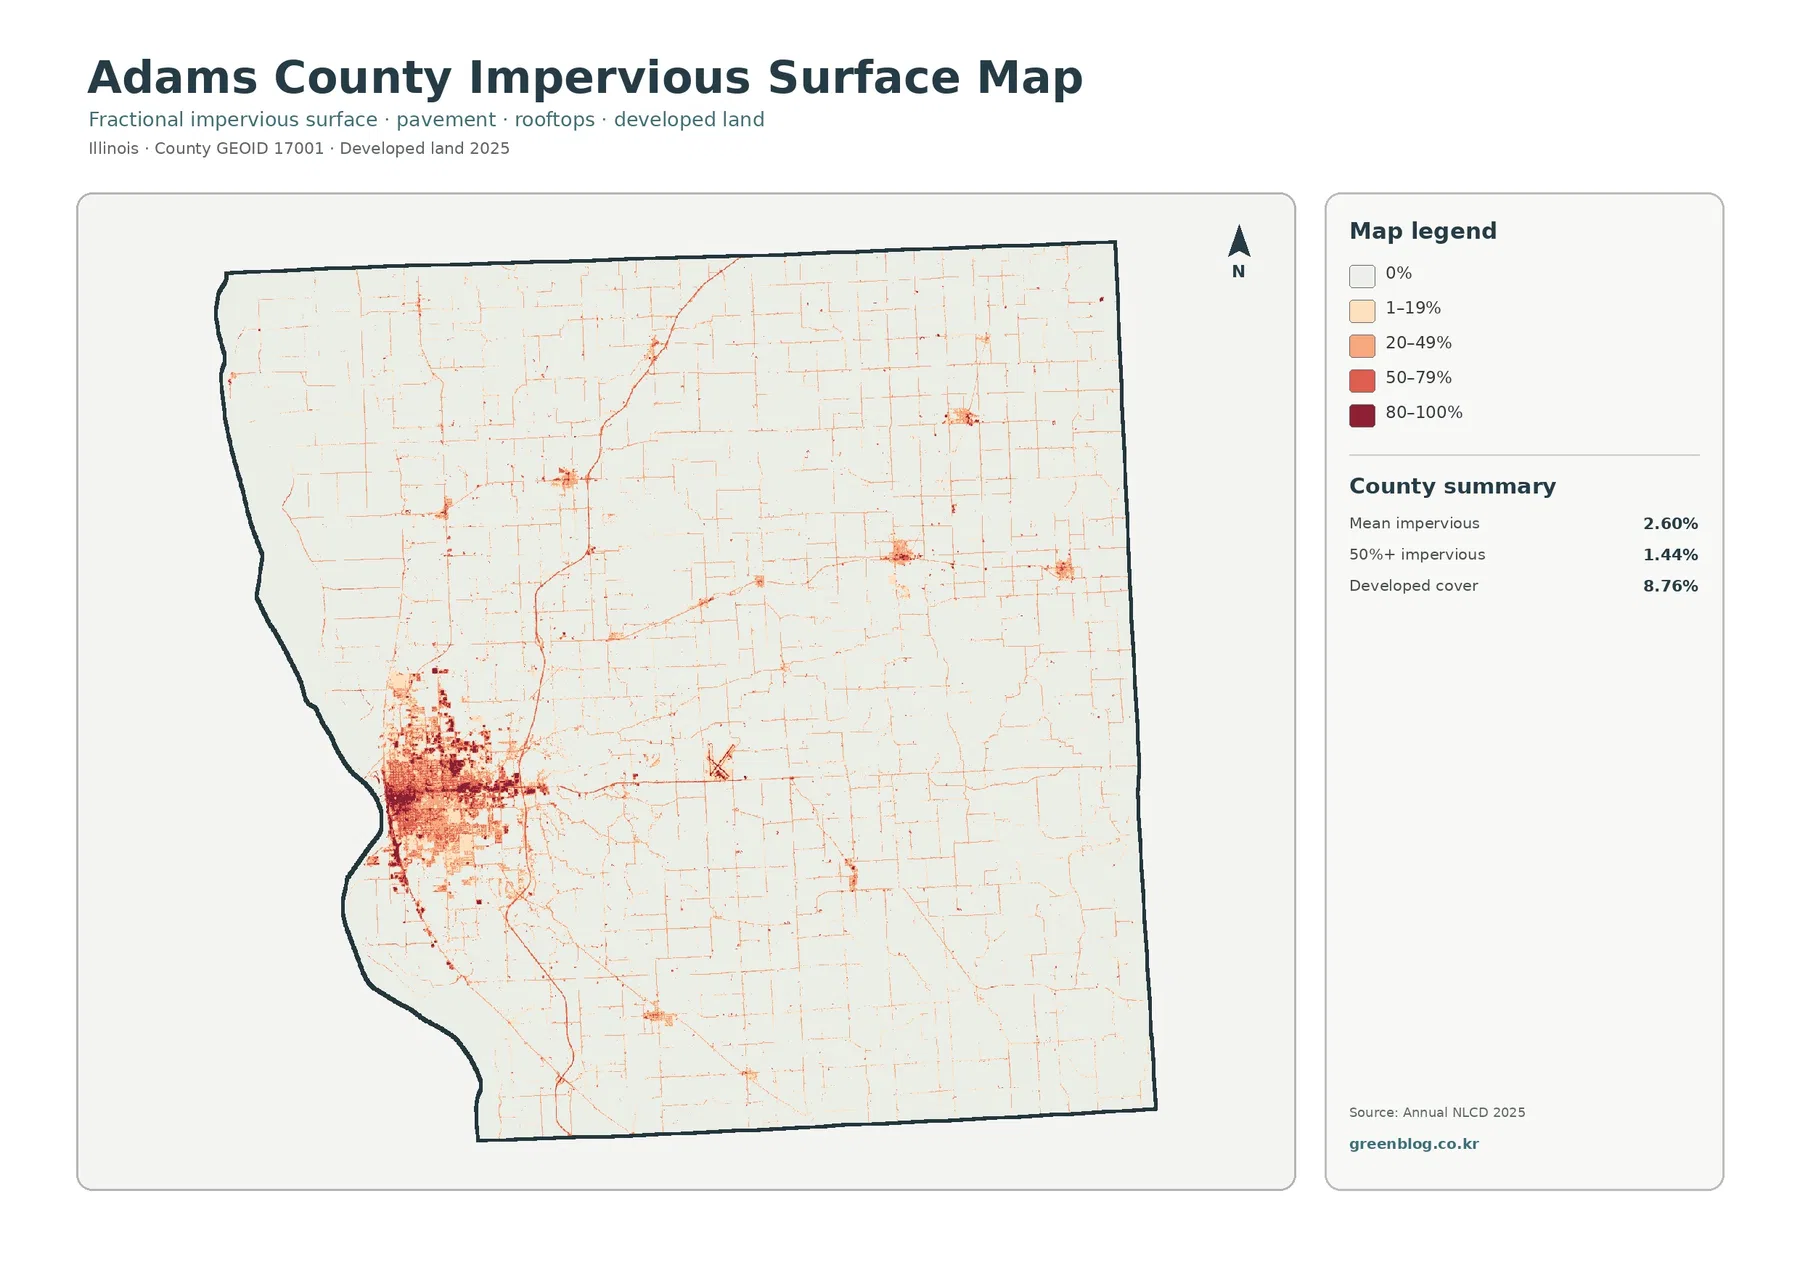
Mean impervious cover is 2.60%, and 1.44% of Adams County is mapped at 50% impervious or greater. Those values are much lower than the 8.76% developed land-cover share because developed classes include both hard and soft surfaces. The impervious map focuses specifically on roofs, pavement, parking areas, and similar surfaces that do not readily absorb rainfall.
The darkest tones form a dense cluster around Quincy on the western side. Street-like lines radiate through and beyond the urban area, while scattered smaller clusters appear across the rest of the county. Large agricultural sections remain white or very light. The result is a strong visual contrast between one major urban center and a mostly rural road-and-settlement network.
The 12.18% endpoint difference is mostly scattered rather than one countywide conversion
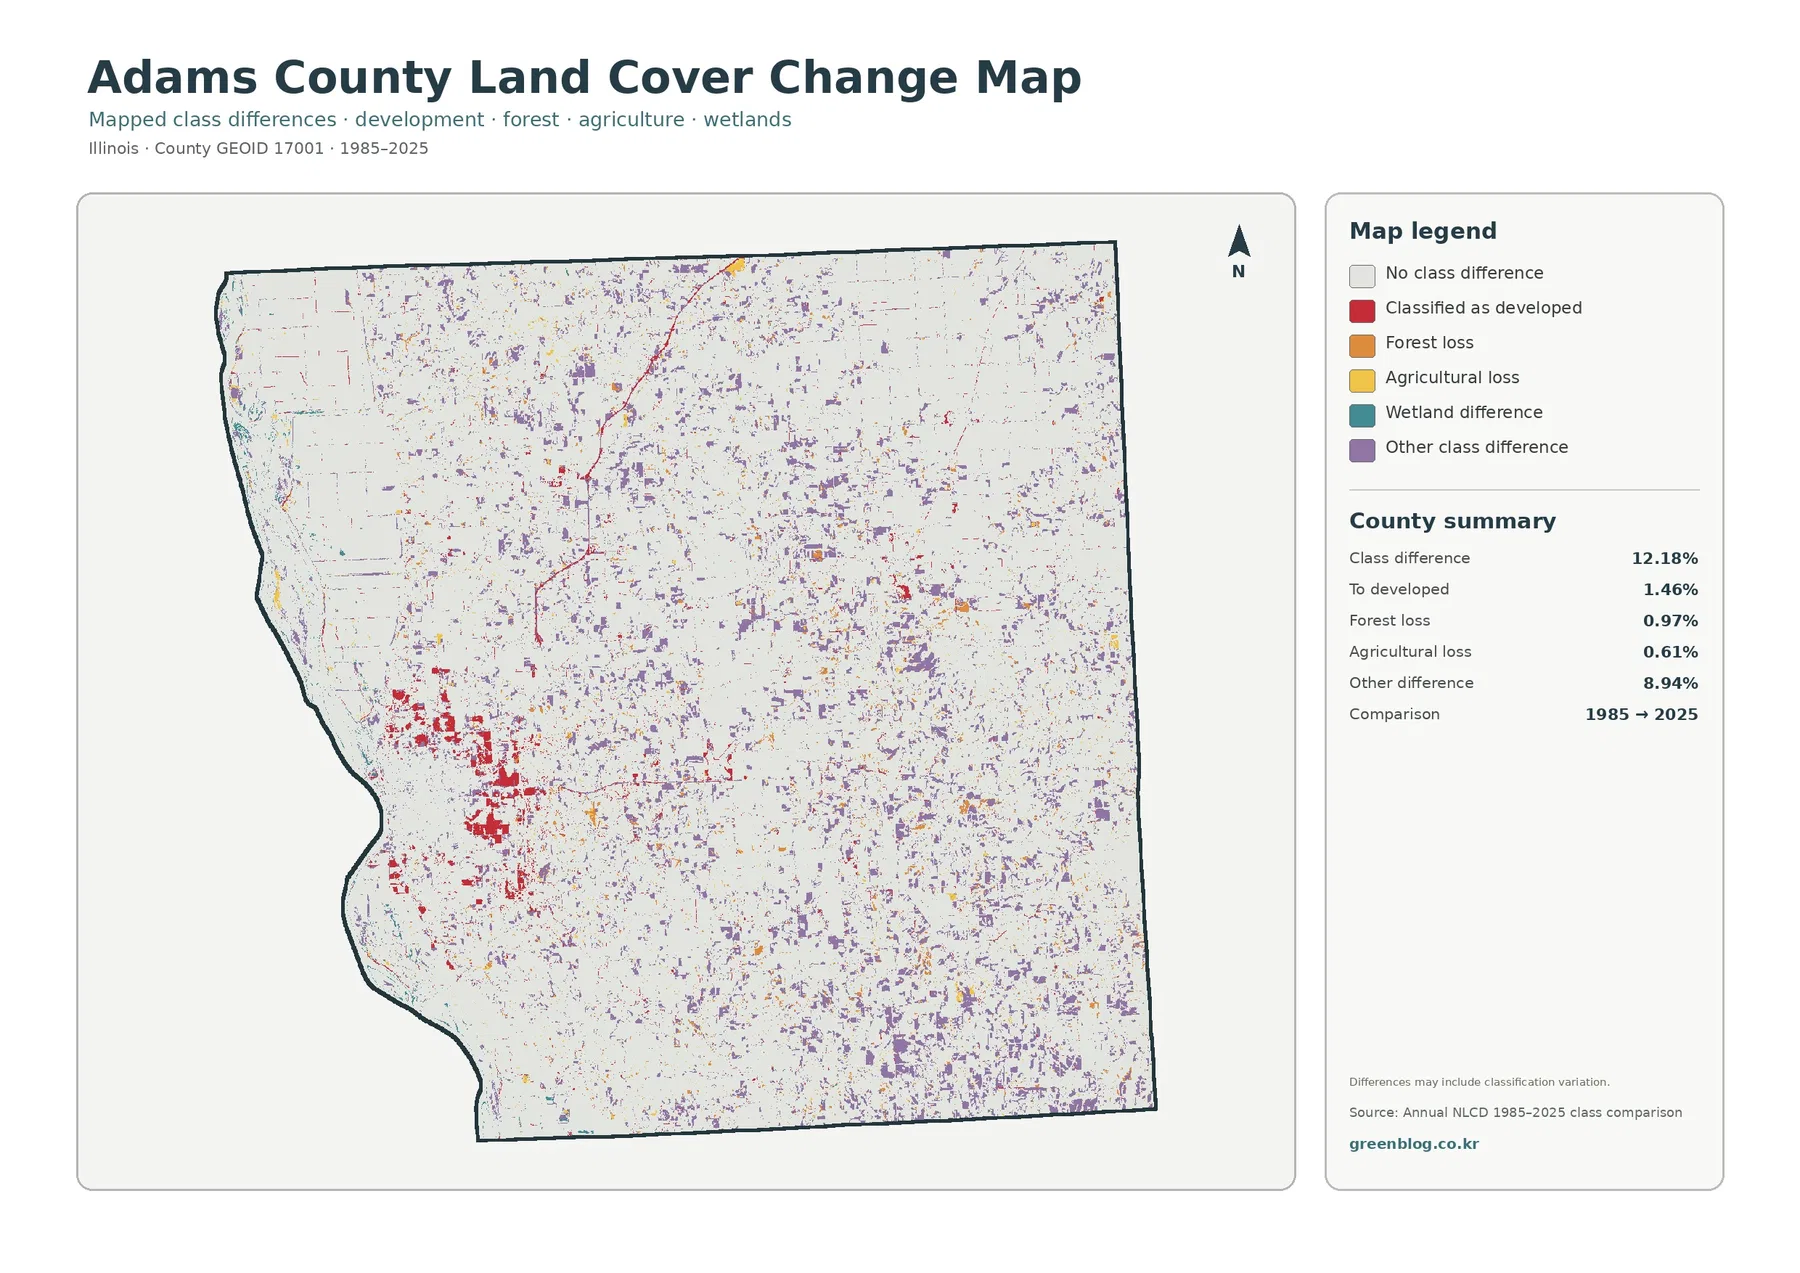
The comparison reports 12.18% total class difference between 1985 and 2025. Printed components include 1.46% classified as developed, 0.97% forest loss, 0.61% agricultural loss, and 8.94% other difference. Wetland difference appears in the legend without its own printed percentage. It should not be estimated from the preview or calculated as an official residual.
Red developed-conversion cells are most concentrated around Quincy, where they reinforce the present-day urban cluster. Smaller red patches and narrow traces appear elsewhere. Purple other-difference cells are much more widespread, while orange forest-loss and yellow agricultural-loss cells occur in scattered pockets. The map therefore does not support a story in which one single land-cover process explains most of Adams County.
A forest-loss cell only means that the 1985 endpoint was classified as forest and the 2025 endpoint was not. It does not identify logging, storm damage, farming, construction, natural succession, or a classification issue as the cause. Agricultural loss and developed conversion have the same timing limitation. Intermediate imagery and local records are needed to determine when and why a location changed.
River-bottom management provides useful context without replacing the land-cover map
Adams County lists four levee or drainage districts along the Mississippi River. The county says Lima Lake and Indian Grave districts protect large areas of farmland, while South Quincy and Sny Island cover additional river-bottom land. This helps explain why agriculture, water, wetlands, and development can sit close together along the western edge. It does not mean that every yellow or teal cell belongs to one of those districts.
Choose the current map first, then add the focused view that answers the next question
Use the impervious surface map when the question is about paved and built intensity. The 2.60% mean is meaningful only when read beside the dense Quincy cluster and the much lighter rural interior. For historical comparison, place the 1985–2025 class-difference map after the current map so red change cells are not confused with current developed land.
Resolution and date set clear limits on parcel and current-condition use
The current land-cover layer represents the supplied 2025 observation year. Construction, crop changes, vegetation recovery, timber activity, flood effects, or other surface changes after that observation may not appear. Parcel ownership, exact zoning, official wetland boundaries, engineering drainage, and legal development questions require newer and more specialized records.
Four original JPG maps in one download
Frequently Asked Questions
Does 67.67% agriculture mean that every yellow area is a surveyed farm parcel?
No. The percentage represents 30-meter cells classified as agricultural cover in the supplied 2025 Annual NLCD summary. The cells are not ownership or survey boundaries, and small roads, ditches, tree rows, or buildings can be absorbed into a predominant class. Parcel-level work requires property records or higher-resolution imagery.
Is the large western developed cluster the exact boundary of Quincy?
No. The largest developed and impervious concentration aligns broadly with Quincy on the Mississippi River, but the land-cover maps do not draw municipal boundaries. Use City of Quincy or Adams County boundary maps when exact city limits, streets, zoning, or parcels are needed.
Does 12.18% class difference mean 12.18% of Adams County was damaged between 1985 and 2025?
No. It is the share of cells with different endpoint classifications. Real surface change may be part of the result, but mixed pixels, seasonal conditions, and classification variation can also contribute. Timing and cause require intermediate imagery and local records.
Sources and Reference Data
- MRLC Annual NLCD Data – official access point for annual land-cover and comparison products
- USGS Annual NLCD Land Cover Classification – official classification definitions and guidance for the 30-meter product
- U.S. Census Bureau TIGER/Line Shapefiles – official county-boundary reference for Adams County
- Adams County Drainage Districts – county information on Mississippi River levee, drainage, farmland, and floodplain context
- City of Quincy – official city page describing Quincy on the banks of the Mississippi River
- Illinois Extension – Natural Resources – trusted local forestry, water, wildlife, and conservation resources serving Adams County
Map File Information
The ZIP contains four original JPG maps for comparing Adams County agriculture, forest, Mississippi River water and wetlands, Quincy-area hard surfaces, and 1985–2025 class differences.
- Included Files: Use only the versions confirmed in the article and supplied images
- File Type: Use the confirmed download contents
- Intended Use: Printing, education, presentations, and map-based projects
Related Maps
- From Cook to Alexander: Reading an Illinois County Map
- Illinois Population Density: Chicago Stands Apart Across 102 Counties
- A Craighead County Arkansas Land Cover Map
Green Map creates custom-edited map images using open geographic data sources such as geoBoundaries, Natural Earth, OpenStreetMap, and government open data.
These maps are edited visual materials, not raw data files, and are provided for education, documents, presentations, and graphic reference.