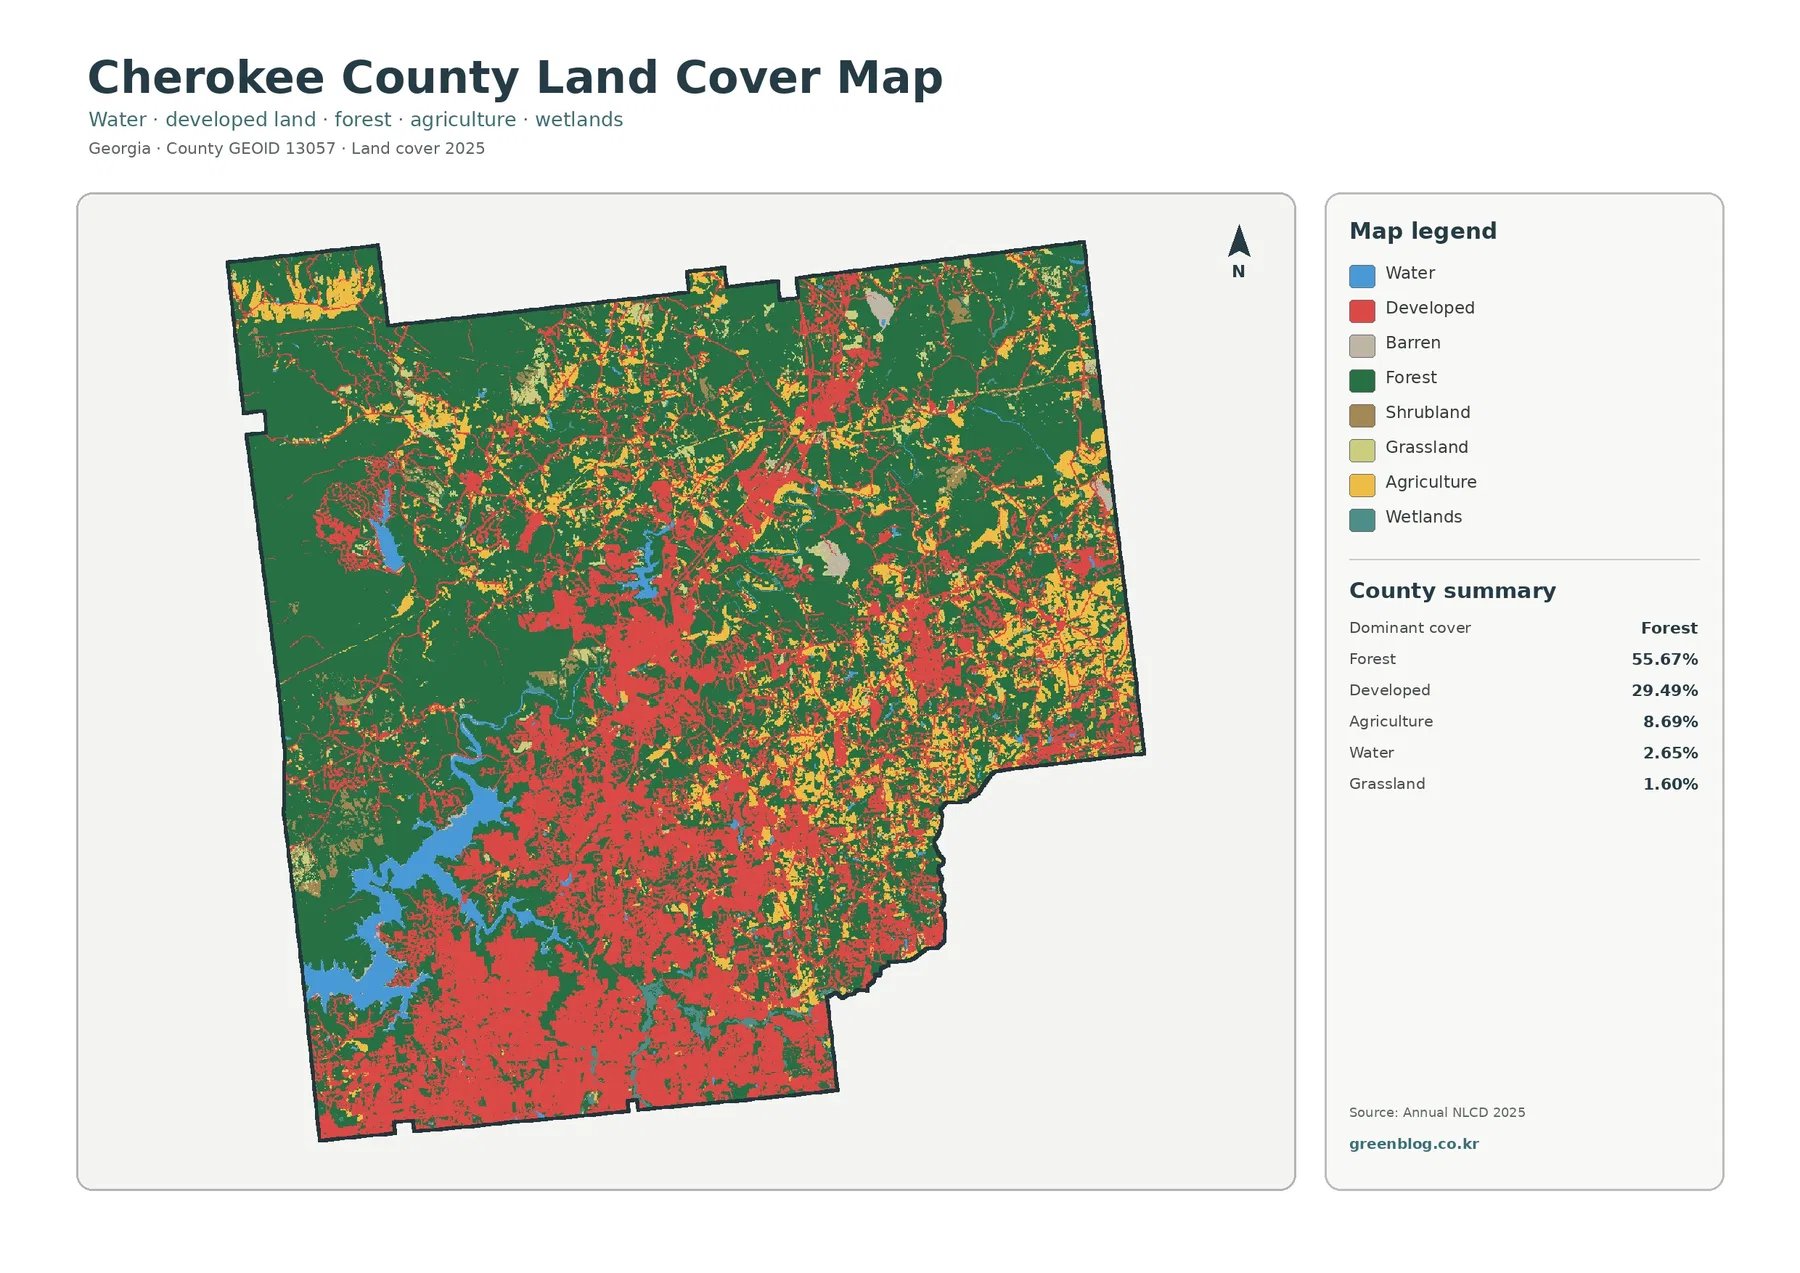
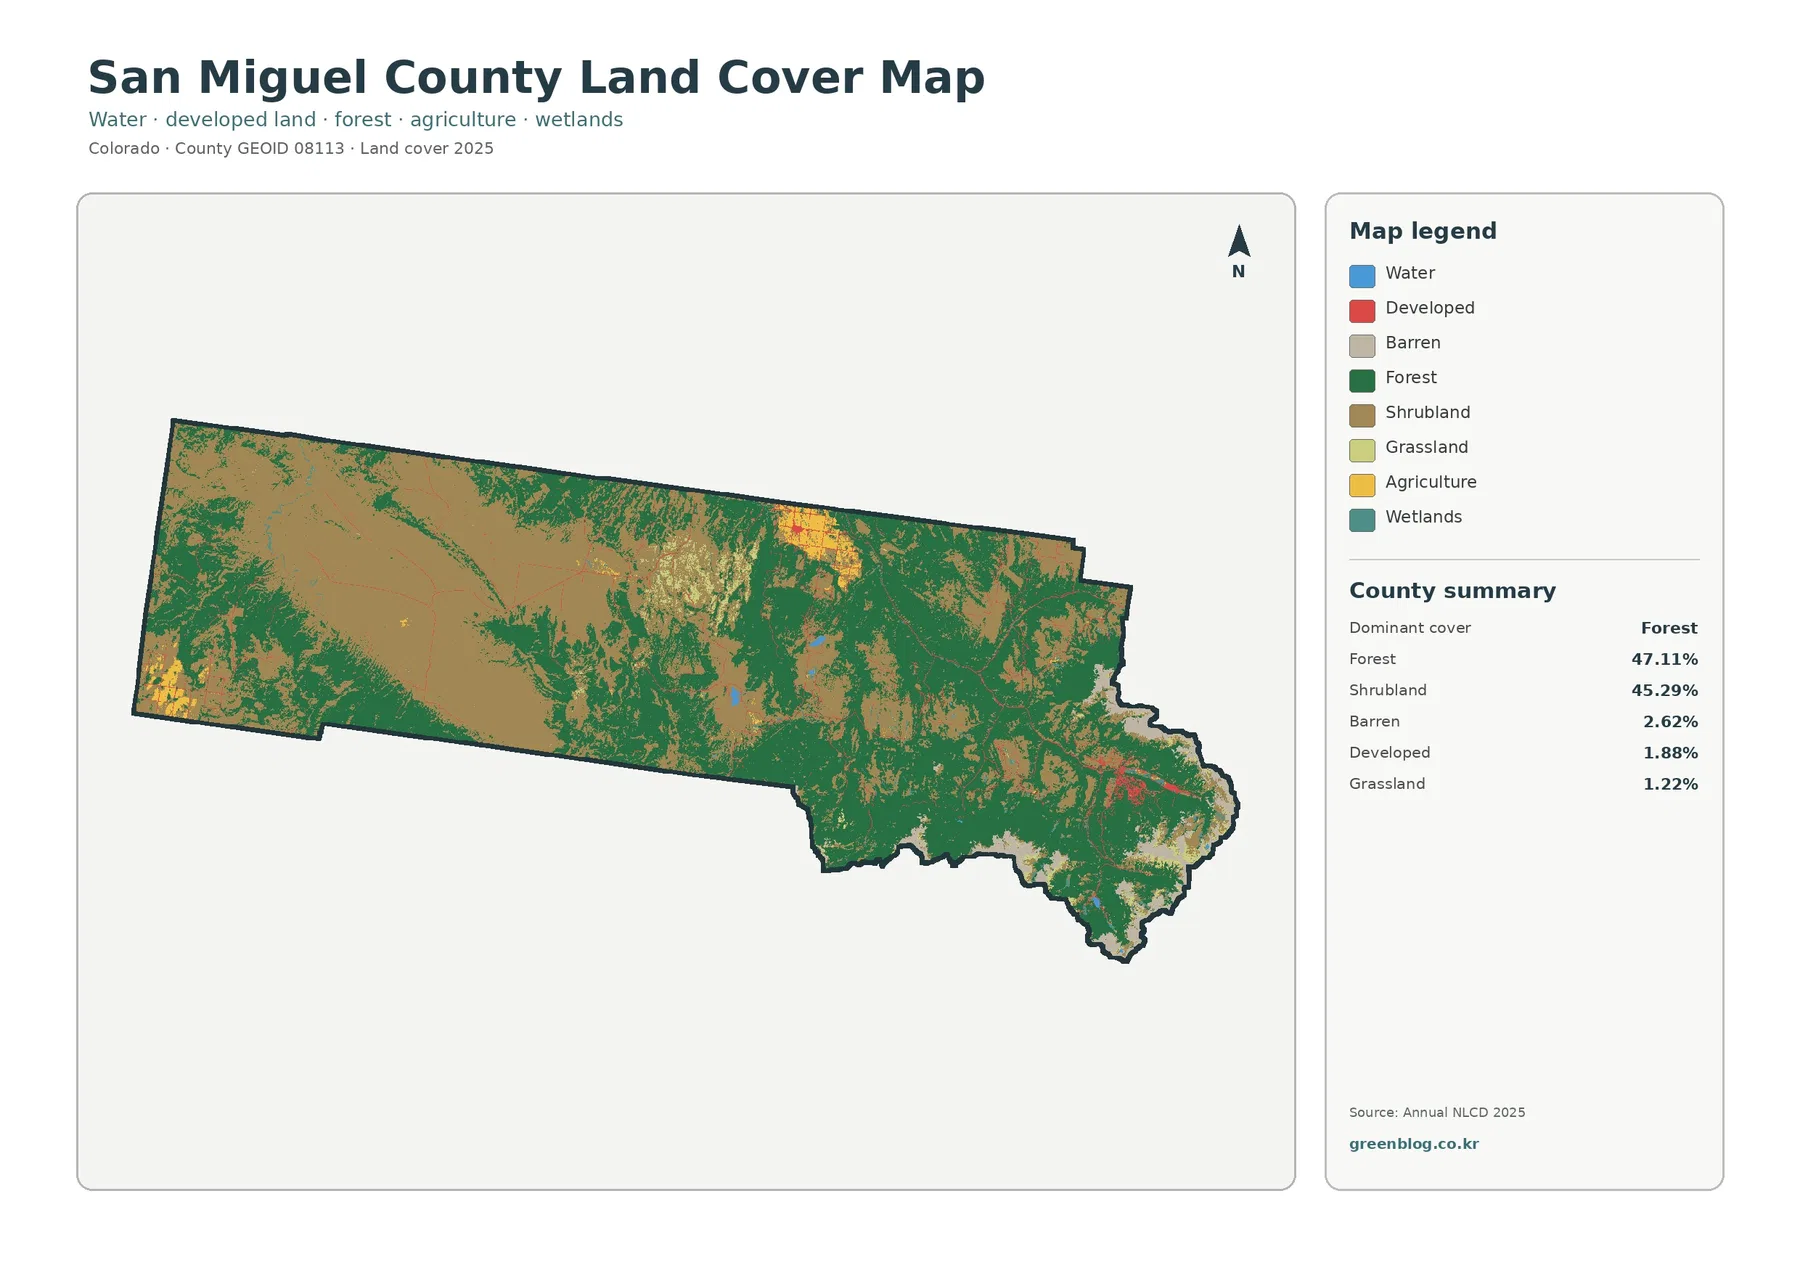
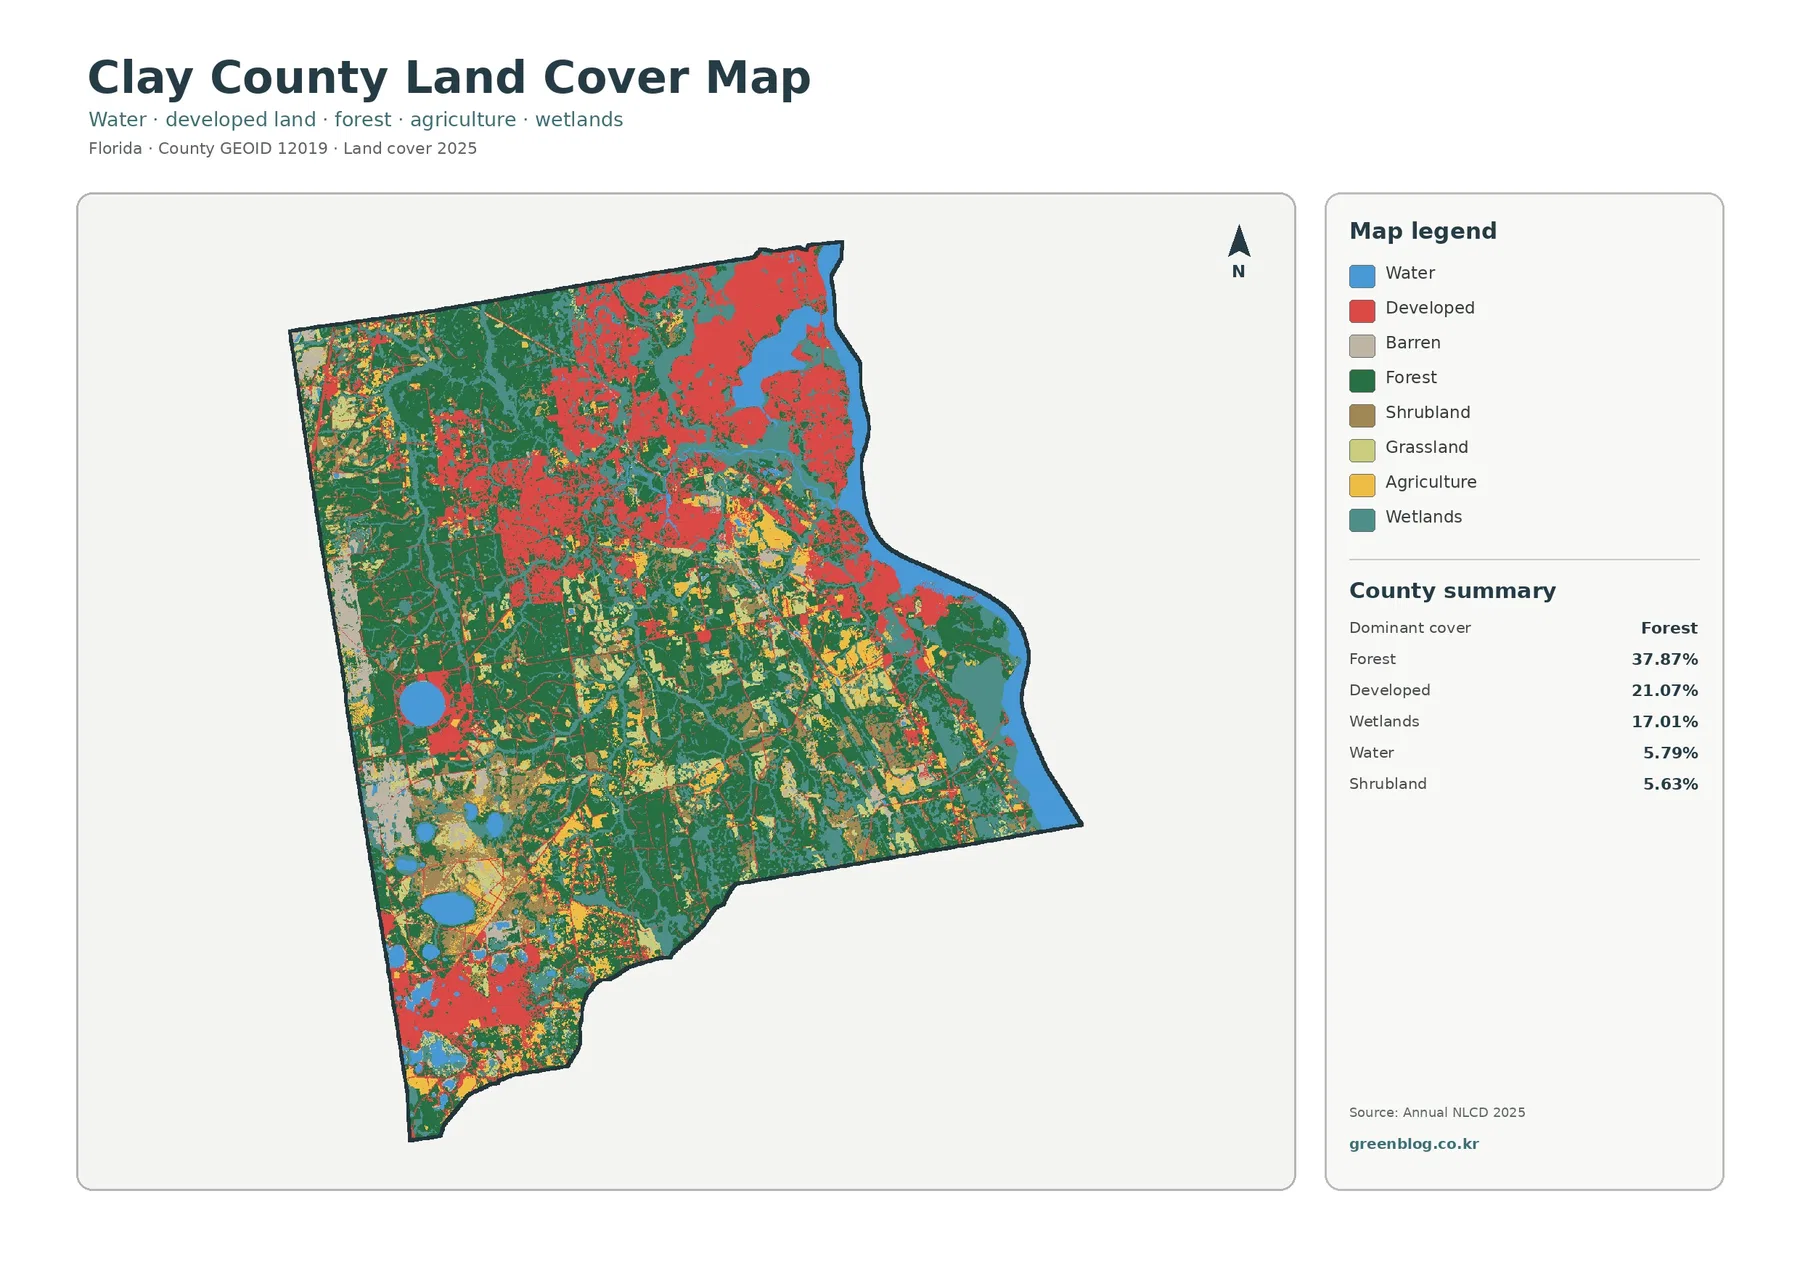
Twin Falls County has one of the clearest north-to-south contrasts in the supplied Idaho map set. The 2025 summary is led by shrubland at 45.98%, but most of the obvious farm grid and the strongest developed concentration sit in the northern part of the county. This Twin Falls County Idaho Land Cover Map makes it possible to compare that farmed plateau with the much more open shrub-and-grass country to the south.
The page includes a 2025 land-cover overview, a forest-and-farmland view, an impervious-surface map, and a 1985–2025 class-difference comparison. The WebP images are placed with the explanation, while the four original 2480 × 1754-pixel JPG maps are available together in one ZIP below. They work well for county profiles, classroom discussion, presentations, and side-by-side interpretation of agriculture, development, and open land.
Table of Contents
A farmed northern plateau sits above a much larger open southern landscape
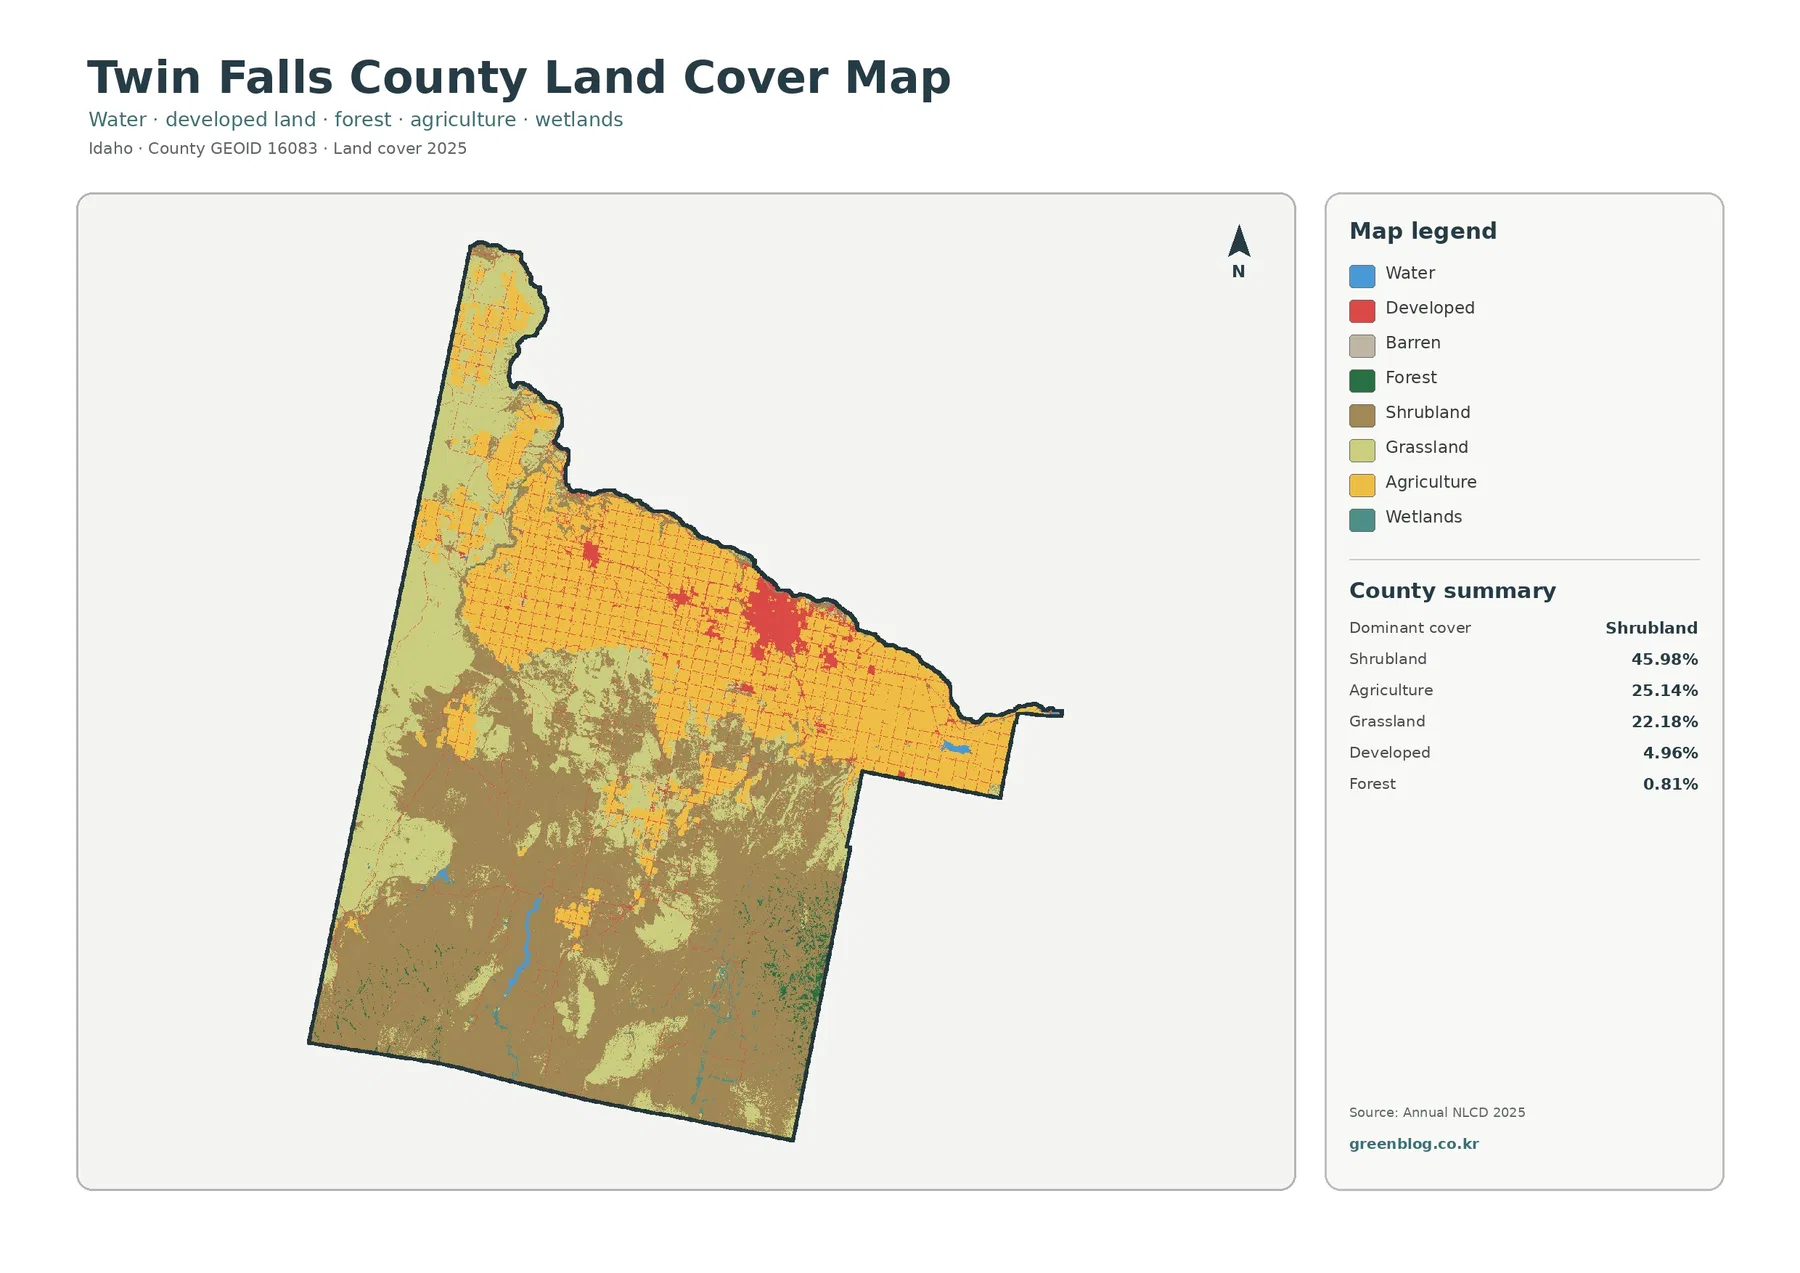
Shrubland covers 45.98% of the county, making it the dominant class by a wide margin. Grassland adds another 22.18%. Those two open-cover categories spread across much of the south and southwest, where broad brown and pale-green areas replace the dense rectangular field pattern seen farther north. Agriculture accounts for 25.14%, yet its strong visual presence comes from concentration rather than countywide coverage.
The northern third is packed with yellow agricultural blocks, fine road-like lines, and red developed cells. A large red cluster stands out near the north-central to northeastern part of the farm belt, broadly matching the Twin Falls urban area. Smaller concentrations occur elsewhere across the cultivated zone. The map does not label city limits or road names, so those smaller clusters should not be assigned to a specific municipality or highway without a separate boundary or transportation layer.
Twin Falls County’s planning documents provide useful context for this split. The county describes its north as a broad, gently rolling basalt plateau used heavily for agriculture and containing the major population centers. The southern part is steeper and more rolling, with large areas of public land and open country. That description helps explain the map, but it does not turn the land-cover colors into a topographic, ownership, or zoning map.
Land cover is a classification of the surface visible in imagery. It tells whether a 30-meter cell is predominantly shrubland, cropland, grassland, developed land, water, wetland, forest, or another class. It does not identify a legal parcel, a crop owner, a zoning designation, or permission to build. Developed classes can contain lawns, trees, and bare soil, while agricultural cells do not define exact field boundaries or crop types.
The 25.14% agricultural share forms a connected belt rather than scattered patches
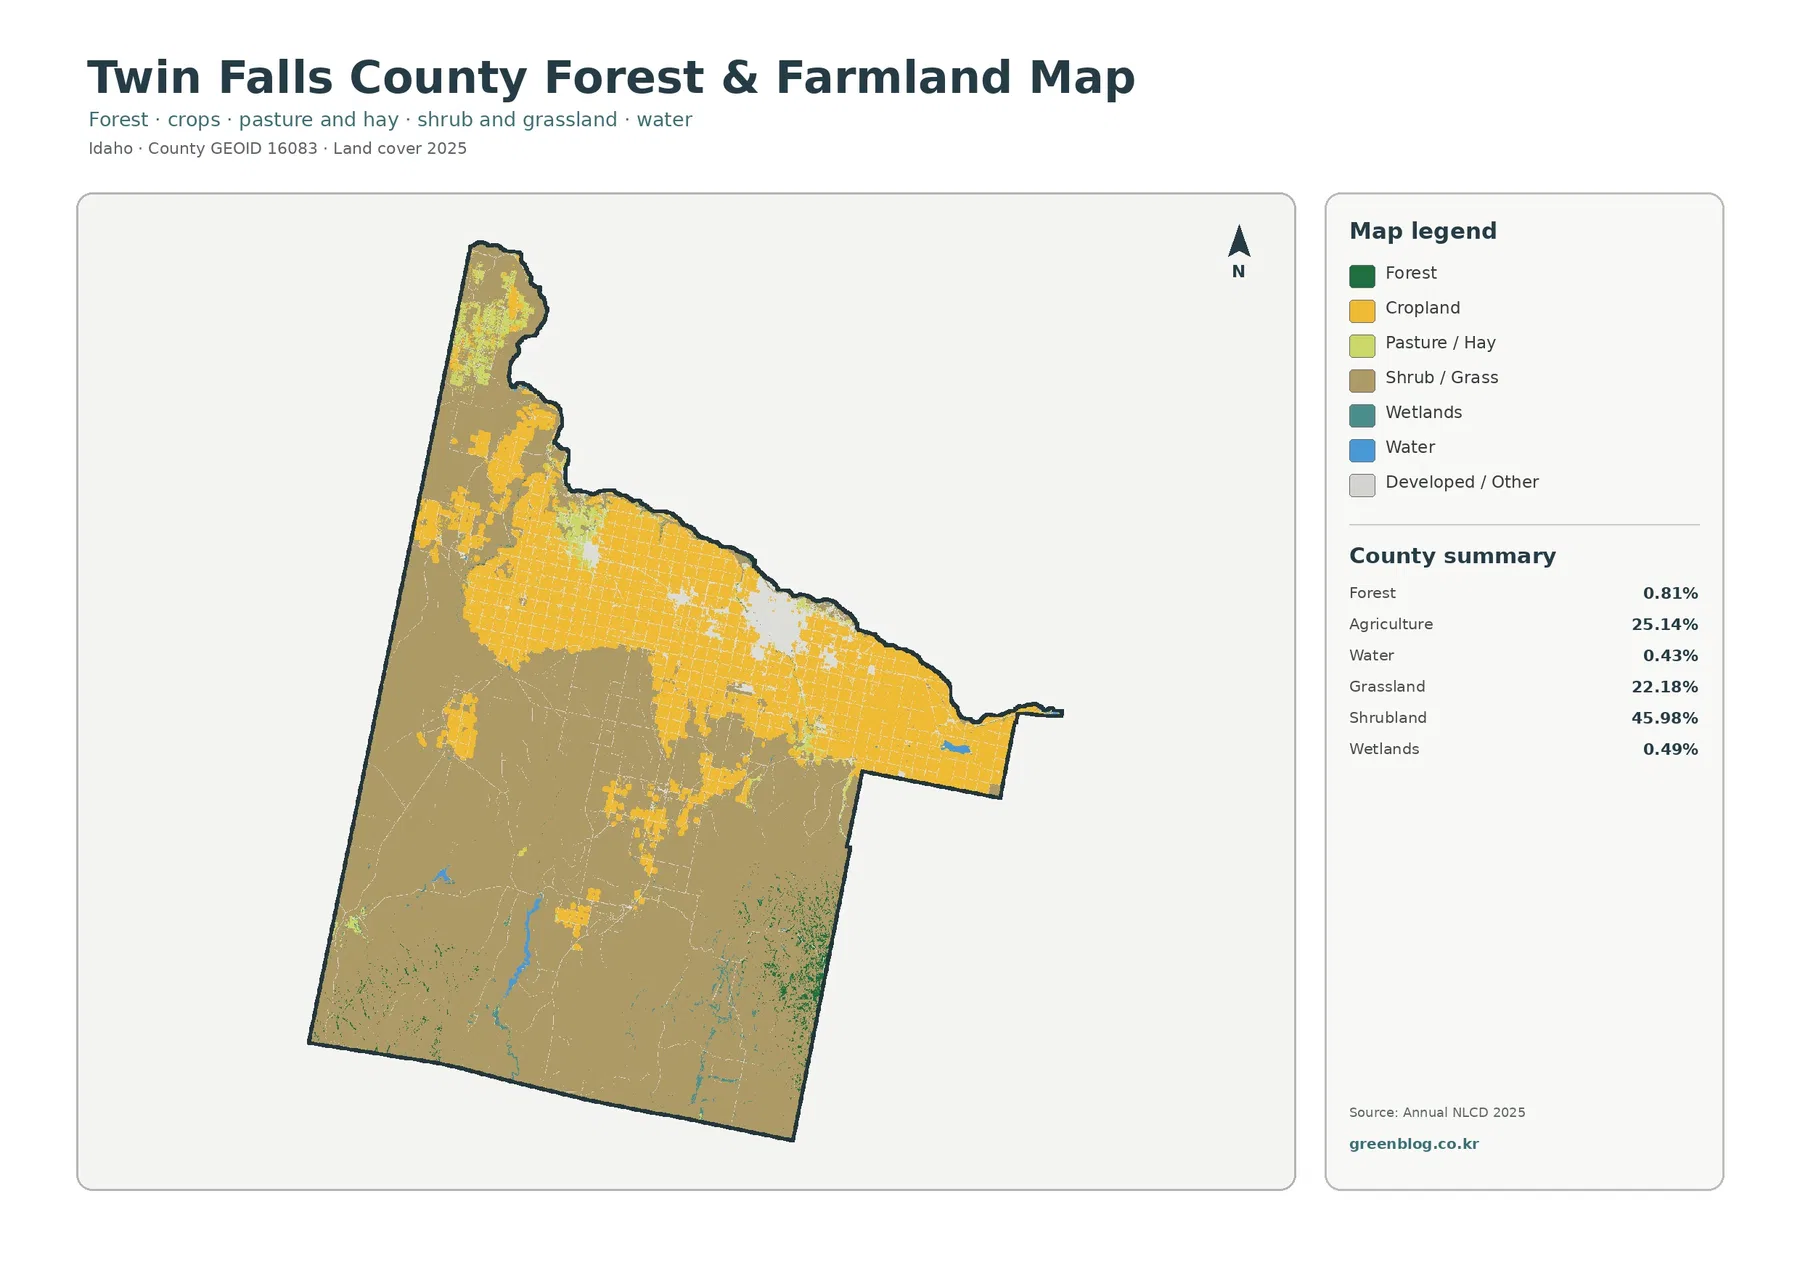
Fading the developed and miscellaneous surfaces makes the farm pattern much easier to follow. Cropland forms a broad connected belt across the north and extends into the narrow northwestern portion of the county. The blocks are especially dense around and west of the Twin Falls urban concentration. Farther south, cropland becomes patchier and then gives way to extensive shrub-and-grass cover, with only isolated agricultural pieces remaining.
The county’s current planning material links this northern agricultural landscape to a long-established irrigation system. Twin Falls County also lists the Twin Falls Canal Company, Salmon Falls Canal Company, and Milner Irrigation District among local agencies. Those sources help explain why irrigated agriculture is such an important part of the northern landscape. They do not, however, allow every straight line on the land-cover image to be named as a canal or parcel boundary.
Forest is only 0.81% of the county. Small green patches appear mainly in portions of the south and southeast, but they never approach the scale of shrubland, grassland, or agriculture. That small share is important because it prevents a misleading reading of southern Twin Falls County as broadly forested upland. The dominant visual story there is open shrub-and-grass cover with limited forest embedded in a much larger high-desert landscape.
Water accounts for 0.43% and wetlands for 0.49%. Blue and teal cells are therefore sparse, appearing as small features in the southern half and in a few narrow settings. Those percentages describe mapped surface area, not the geographic importance of water. The county is bounded on the north by the Snake River Canyon, and its planning documents also discuss deeply cut canyons along Rock Creek and Salmon Falls Creek.
Twin Falls produces the strongest hard-surface signal in a mostly low-impervious county
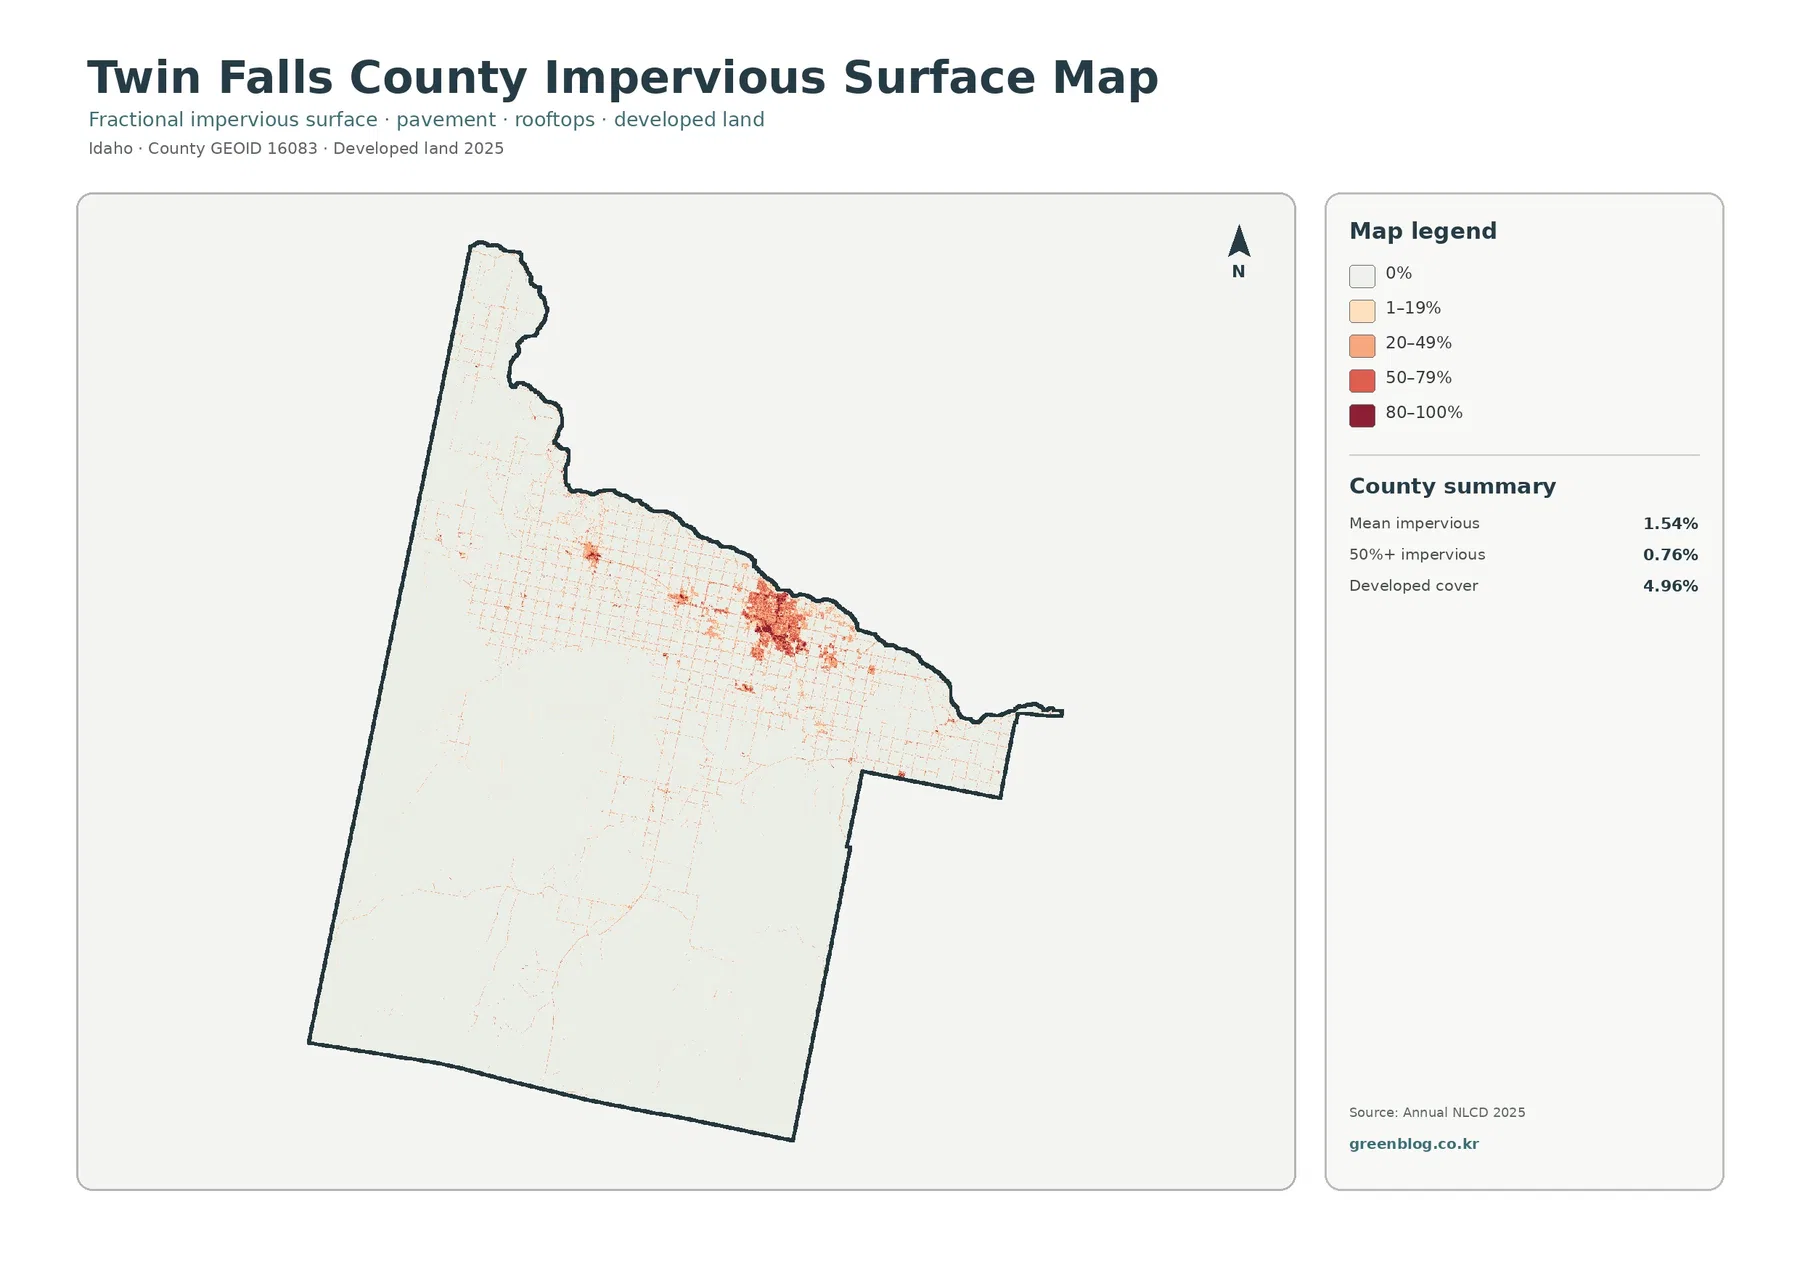
Mean impervious cover is 1.54%, and only 0.76% of the county is mapped at 50% impervious or greater. Both values are well below the 4.96% developed-land share. The difference is expected because a developed class may contain permeable surfaces such as yards, trees, soil, and open space. The impervious layer narrows the question to roofs, pavement, parking areas, and similar hard surfaces.
The darkest tones form a compact concentration around Twin Falls. Fine lines and smaller points spread through the surrounding agricultural grid, and lesser clusters appear elsewhere across the northern farm belt. This is a much more concentrated pattern than the broad agricultural color on the general map. It is useful when the question is not simply where development exists, but where the hardest surfaces are most continuous.
Twin Falls County provides separate Area of Impact maps for Buhl, Filer, Hansen, Hollister, Kimberly, Murtaugh, Twin Falls, and other communities. Those planning boundaries should not be inferred from this image. A dark impervious cluster may fall inside or outside a municipal boundary, and a city impact area can include land that still appears agricultural or open in the 2025 classification. Planning jurisdiction and observed surface cover answer different questions.
The countywide average also hides the contrast between city and countryside. A value of 1.54% combines dense urban blocks with huge southern areas that are close to zero. For presentations, the location and continuity of darker cells communicate development intensity more clearly than the mean alone. Flood or runoff analysis requires additional information, including rainfall, soil, slopes, drainage infrastructure, and stream or floodplain data.
Small mapped water shares coexist with major canyon and irrigation context
The low water and wetland percentages can look surprising in a county whose northern edge is defined by the Snake River Canyon. The apparent contradiction disappears once the measurements are separated. The land-cover percentages count surface area classified as open water or wetland. A river canyon can be geographically and economically important while the water surface itself occupies only a narrow fraction of the county.
Twin Falls County’s comprehensive planning material names the Snake River, Rock Creek, Salmon Falls Creek, and Deep Creek as canyon systems with deeply incised basalt terrain. Those named features are not labeled on the supplied map. A blue or teal strip should therefore be treated as a mapped water-related surface until it is checked against an official hydrography layer. Narrow channels may also be simplified within 30-meter cells when water, vegetation, rock, and adjacent land share the same area.
Irrigation adds another reason not to equate the blue pixels with the full role of water. County material credits historic dams and canal systems with sustaining agriculture across the northern plateau for more than a century. The land-cover map captures the resulting surface pattern of fields, not the complete water-delivery network. A crop block can depend on irrigation even when no blue canal line is visible at this map scale.
The 1985–2025 comparison is dominated by “other class difference,” not development
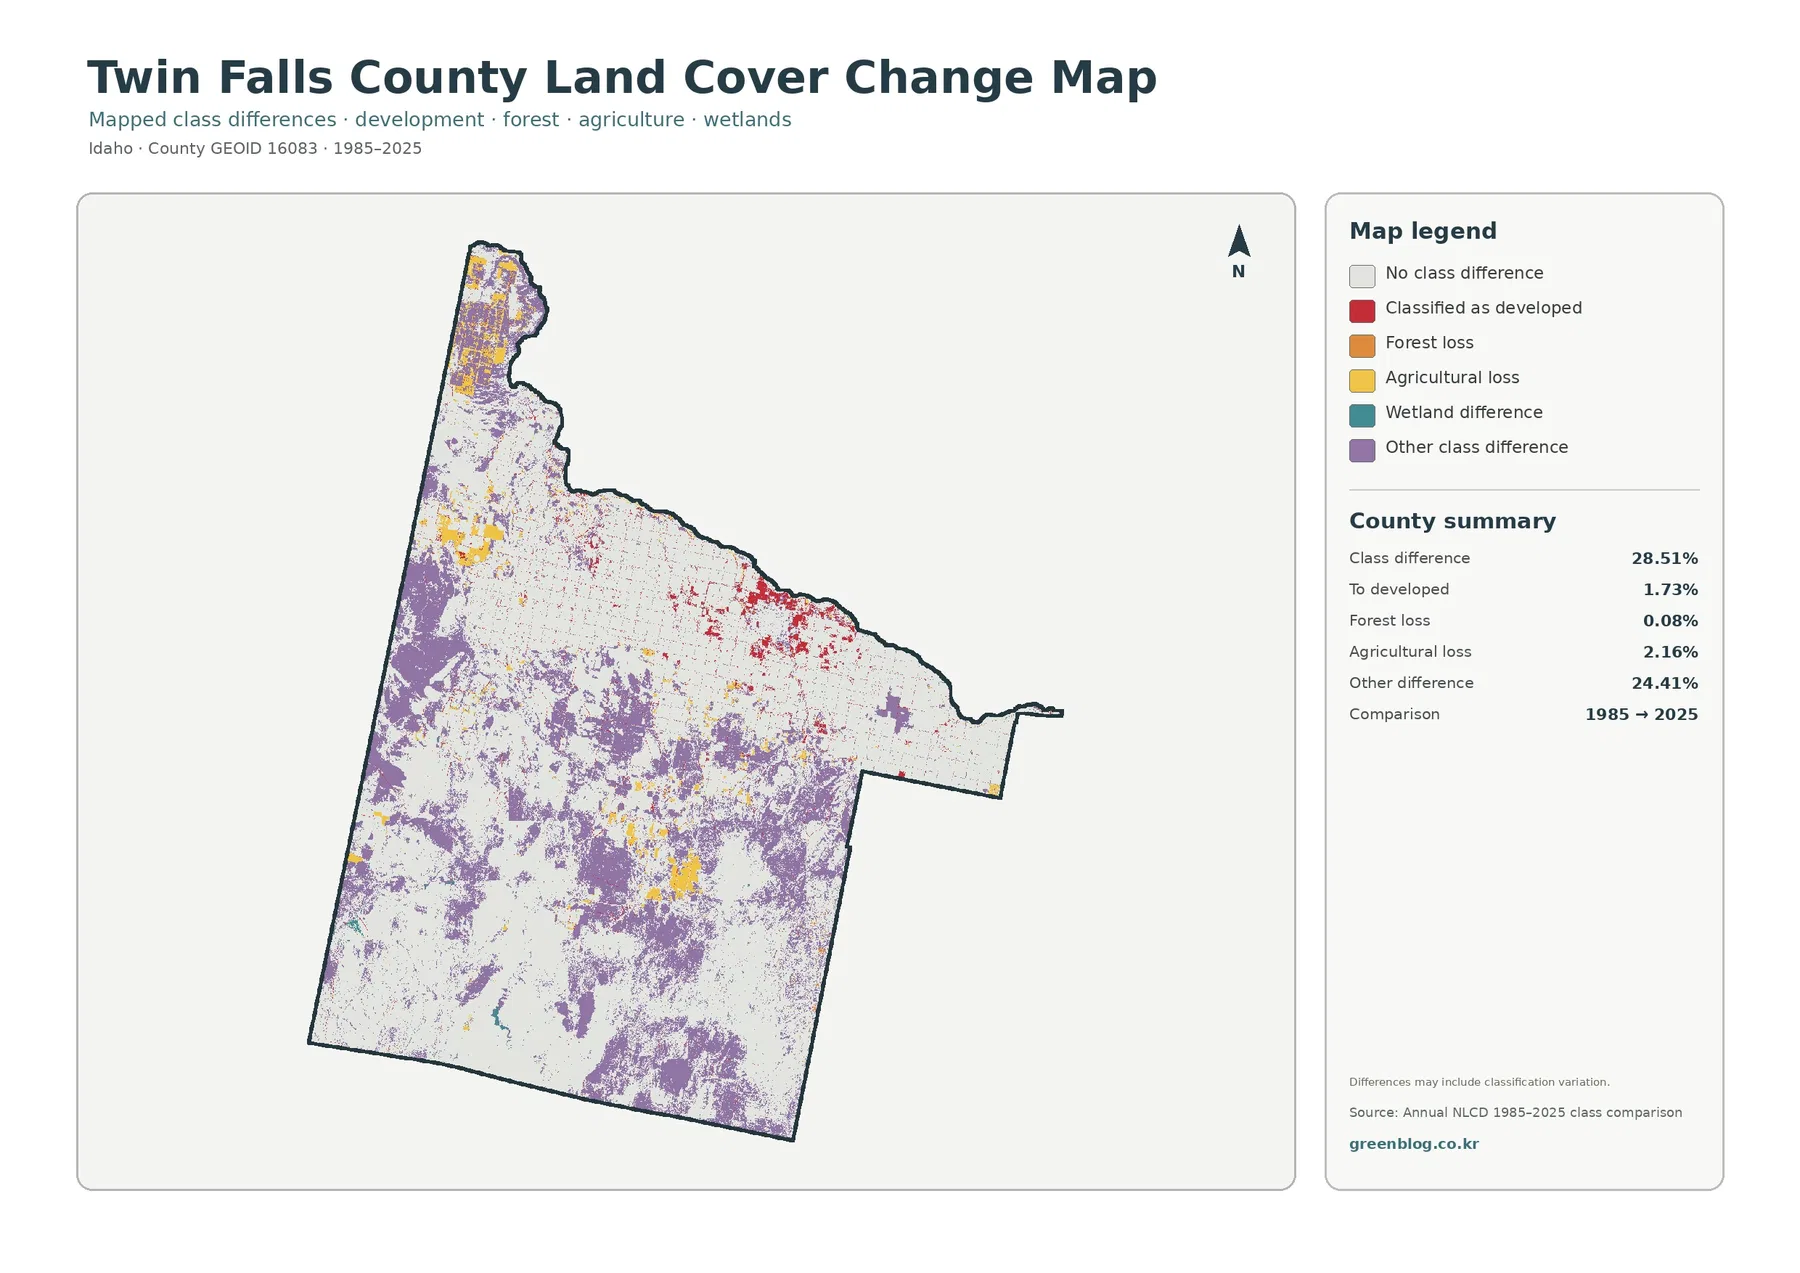
Total class difference is 28.51%. The largest listed component is “other difference” at 24.41%, followed by agricultural loss at 2.16%, cells classified as developed at 1.73%, and forest loss at 0.08%. Wetland difference appears in the legend but does not receive a separate percentage in the summary. A residual calculation should not be presented as an official wetland-change value.
Purple other-difference cells are widespread across the south and west and also occur in the narrow northern extension. Red developed-conversion cells are more concentrated in the northern farm-and-city belt, especially around the Twin Falls area. Yellow agricultural-loss patches occur in several cultivated and transition zones. Orange forest-loss cells are scarce, which is consistent with forest occupying only 0.81% of the current countywide map.
The word “loss” is a class-comparison label, not a diagnosis. An agricultural cell in 1985 that receives another class in 2025 is counted as agricultural loss even though the map alone cannot say whether the cause was construction, fallowing, vegetation change, water conditions, management, or classification variation. The same caution applies to the developed category, which does not provide the construction date or identify a particular project.
The 24.41% other-difference share deserves the most restraint. It is too broad to translate directly into damage, restoration, rangeland decline, or land-use conversion. Annual imagery from intermediate years, aerial photography, permits, and land-management records are needed to explain a specific location. The comparison is best used as a screening map that identifies places worth checking, not as a complete 40-year history.
Public land in the south provides context without defining the shrubland class
Twin Falls County’s 2020 planning document notes that federal and state lands make up well over half of the county’s acreage and are concentrated in the south. The BLM’s Twin Falls District and Jarbidge Field Office manage large areas of public land in south-central Idaho, where grazing is an important permitted activity. That information fits the broad open-country character visible in the southern map, but the shrubland class cannot be treated as a public-land boundary.
Ownership, grazing allotments, zoning, and land cover are separate layers. A private parcel can be shrubland, a public parcel can include grassland or water, and a planned development area may still appear agricultural. Keeping those categories separate is especially important in Twin Falls County because the visual divide between the intensively farmed north and open south is strong enough to invite assumptions that the map itself does not support.
A clear four-map sequence works better than trying to make one image answer everything
For a county profile, start with the 2025 overview. It establishes the 45.98% shrubland share, the northern agricultural belt, the 22.18% grassland component, and the Twin Falls developed cluster in one frame. Follow with the forest-and-farmland view when the discussion turns to irrigated agriculture, open southern land, or the very small forest share.
Add the impervious map when the topic is urban concentration, pavement, rooftops, or the difference between developed land and hard surface. Its 1.54% mean and 0.76% high-impervious share are most informative when paired with the location of the Twin Falls cluster. Place the 1985–2025 comparison last so readers have already seen the current classes before they encounter the separate colors used for class differences.
This sequence also helps prevent common misreadings. Purple on the change map is not a current land-cover class, red change cells are not the same as all 2025 developed land, and pale areas on the impervious map do not mean the land is unused. Each image isolates a different question. Using two maps together is often enough to make a point without overloading a slide or handout with four legends at once.
Thirty-meter cells set the limit for parcel and road-level interpretation
Annual NLCD uses 30-meter cells. A single cell may contain part of a field, a farm road, a ditch, a house, trees, and bare soil but still receive one predominant class. The rectangular agricultural pattern can resemble property boundaries, yet the classification is not a parcel survey. Likewise, a thin impervious line can suggest a road corridor without providing an official centerline, width, route number, or traffic information.
The maps represent the supplied 2025 observation year. Construction, harvest, wildfire, vegetation recovery, irrigation changes, or water-level differences after that observation may not appear. The 1985–2025 comparison uses two endpoints and therefore cannot show every intermediate transition. Current planning or site decisions should rely on newer local records, higher-resolution imagery, and field information when available.
Each original JPG measures 2480 × 1754 pixels. That size is useful for screens, documents, classroom handouts, and many presentation layouts. The asset manifest does not mark the files as meeting an A3 high-resolution reference, so large-format printing should be tested before final production. These images are reference maps, not engineering drawings, flood determinations, wetland-jurisdiction maps, or legal survey products.
Four original JPG maps in the Twin Falls County download
The ZIP contains one JPG for 2025 land cover, forest and farmland, impervious surface and developed land, and 1985–2025 land-cover change. Together they cover the county’s main visual contrast: a cultivated and urbanized northern belt set against extensive shrub-and-grass country to the south. Choose the overview first, then add the specialized image that directly matches the question you need to explain.
Frequently Asked Questions
Is agriculture the largest land-cover class in Twin Falls County?
No. Agriculture covers 25.14%, while shrubland is the largest class at 45.98% and grassland adds 22.18%. Agriculture looks especially prominent because it is concentrated in a dense northern belt rather than spread evenly across the county.
Does the dark impervious cluster show the exact Twin Falls city boundary?
No. The strongest hard-surface concentration broadly matches the Twin Falls urban area, but municipal and Area of Impact boundaries are not drawn on the image. Use the county’s official planning maps when an exact jurisdictional boundary matters.
Does 28.51% class difference mean that more than one-quarter of the county was damaged after 1985?
No. It is the share of cells receiving different classifications at the 1985 and 2025 endpoints. Most of the listed difference is the broad “other difference” category at 24.41%, and the map warns that classification variation may be included. Causes require intermediate imagery and local records.
Sources and Reference Data
- MRLC Annual NLCD Data – official access point for annual land-cover and comparison products
- USGS Annual NLCD Land Cover Classification – official definitions and guidance for the mapped classes and 30-meter product
- U.S. Census Bureau TIGER/Line Shapefiles – official county-boundary reference for Twin Falls County
- Twin Falls County 2020 Vision for the Future – county context for the Snake River Canyon boundary, irrigation, agriculture, public land, and the north-south landscape
- Twin Falls County Area of Impact Codes and Maps – official planning and boundary resources for communities including Buhl, Filer, Kimberly, Murtaugh, and Twin Falls
- University of Idaho Extension – Twin Falls County – local research-based education and county agricultural or horticultural context
- BLM Jarbidge Field Office – public-land and grazing context for south-central Idaho
Map File Information
The ZIP contains four original JPG maps for comparing Twin Falls County’s 2025 land cover, northern agriculture, southern shrub-and-grass country, hard surfaces, and 1985–2025 class differences.
- Included Files: Use only the versions confirmed in the article and supplied images
- File Type: Use the confirmed download contents
- Intended Use: Printing, education, presentations, and map-based projects
Related Maps
Green Map creates custom-edited map images using open geographic data sources such as geoBoundaries, Natural Earth, OpenStreetMap, and government open data.
These maps are edited visual materials, not raw data files, and are provided for education, documents, presentations, and graphic reference.