Teton County’s supplied 2025 land-cover summary is split almost evenly between forest and agriculture. Forest accounts for 33.32% of the county and agriculture for 31.62%, while shrubland adds 19.78%. The Teton County Idaho Land Cover Map also shows a broad wetland presence through the middle of the county and smaller developed clusters concentrated in only a few areas.
This page compares four related views: 2025 land cover, forest and farmland, impervious surface and developed land, and a 1985–2025 class-difference map. The WebP images can be reviewed in the article, and the four original 2480 × 1754-pixel JPG maps are available together in one ZIP below for county profiles, lessons, presentations, and general landscape comparison.
Table of Contents
Start with the farm-and-forest divide, then look at the wetland middle
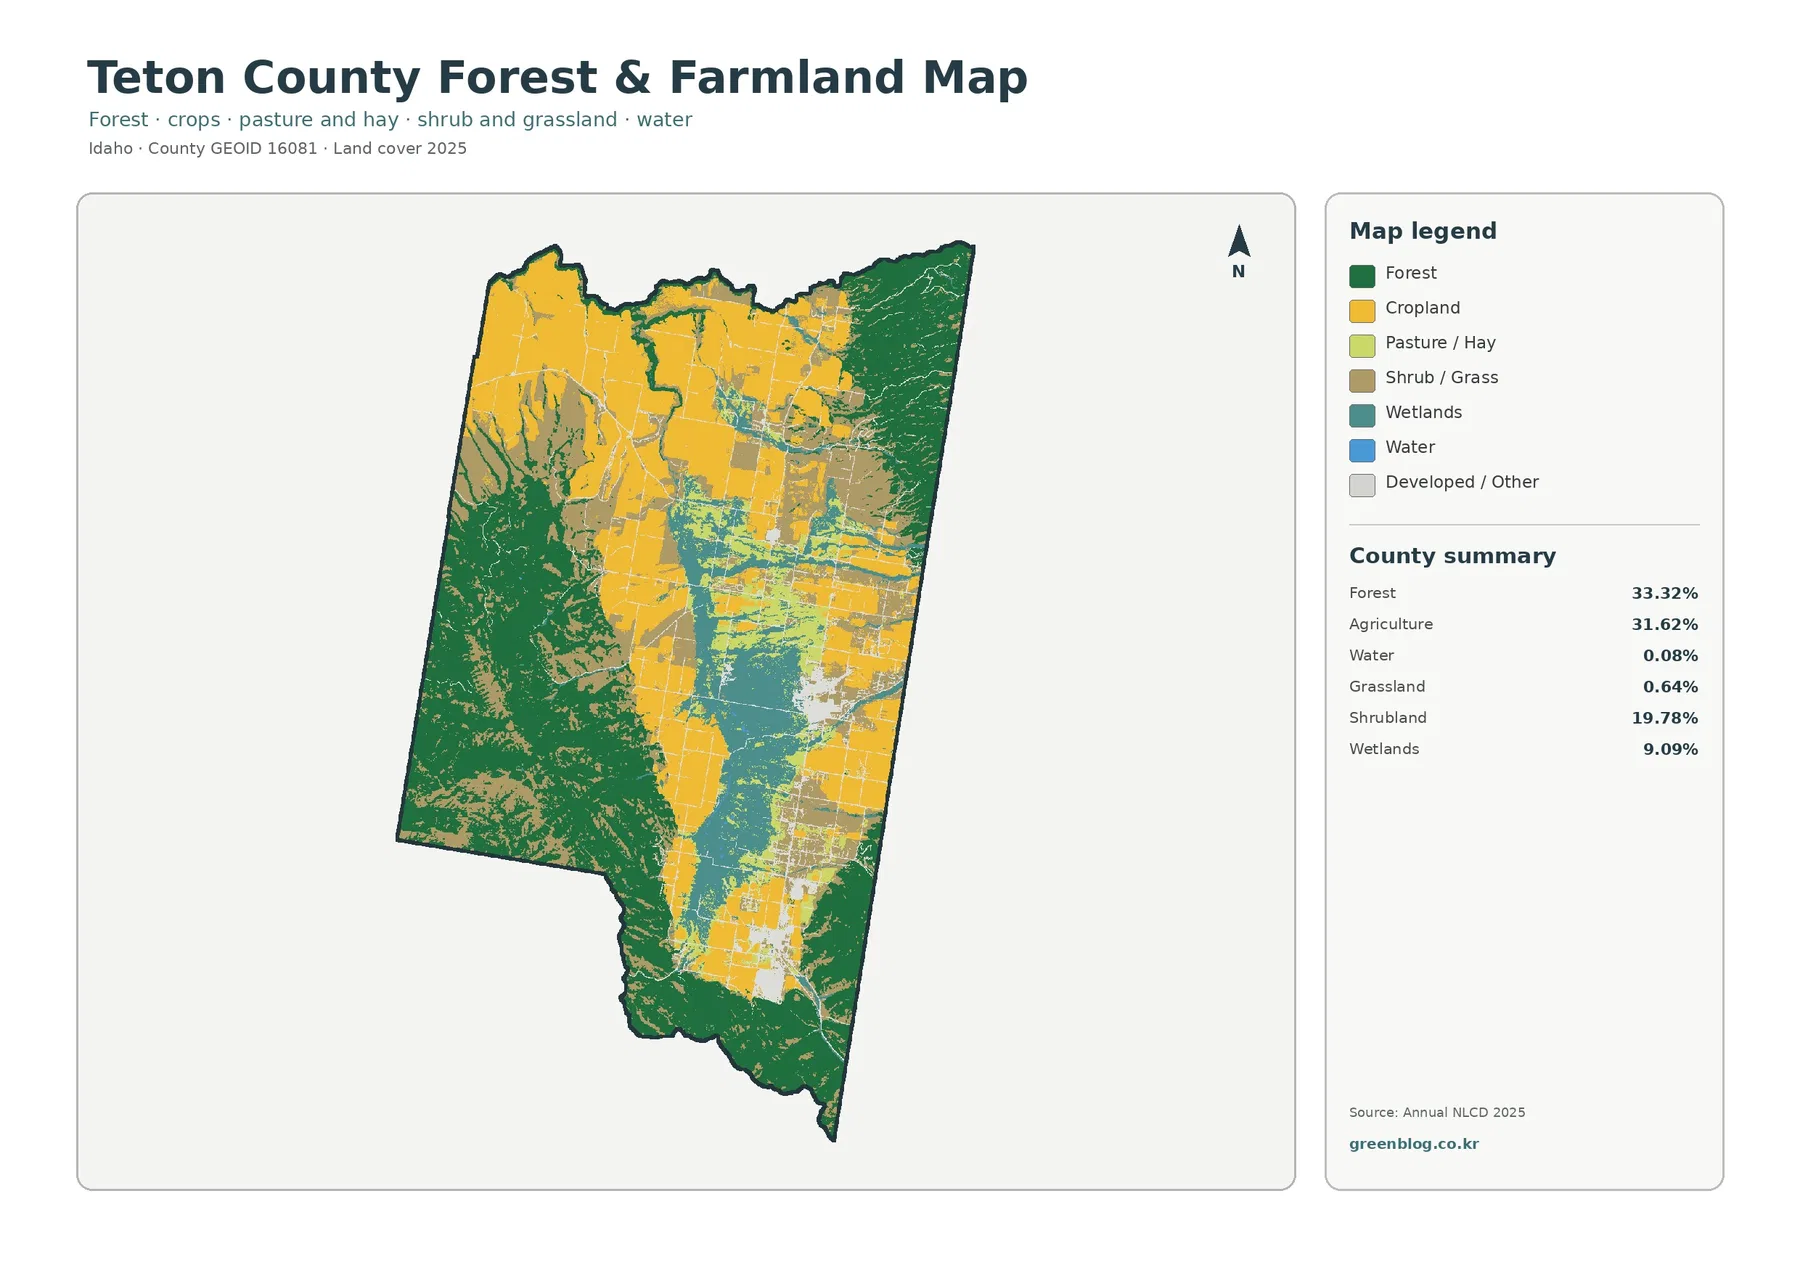
The forest-and-farmland view makes the county’s broad arrangement easier to see because developed and miscellaneous surfaces are faded. Large yellow cropland blocks occupy much of the central and northern interior and continue southward in smaller pieces. Dark green forest forms extensive areas along the western and eastern sides. Instead of a county covered by one dominant surface, the image shows a wide agricultural interior between large wooded margins.
Agriculture accounts for 31.62% in the supplied summary. The focused legend separates cropland from pasture or hay, so the working landscape is not represented by a single yellow class. Pale green pasture or hay appears among cropland and wetland areas, especially through the middle of the county. The straight edges of many farm-colored blocks are visually distinct from the irregular forest and shrub boundaries around them.
Wetlands account for 9.09% and form one of the most noticeable non-farm patterns. Teal areas run through the central part of the county and widen in several places, with smaller wetland pieces scattered among fields. Open water, however, is listed at only 0.08%. Those numbers are not contradictory: open-water classes represent exposed water surfaces, while wetland classes can include saturated ground and water-influenced vegetation.
Hard surfaces occupy a much smaller footprint than the developed class
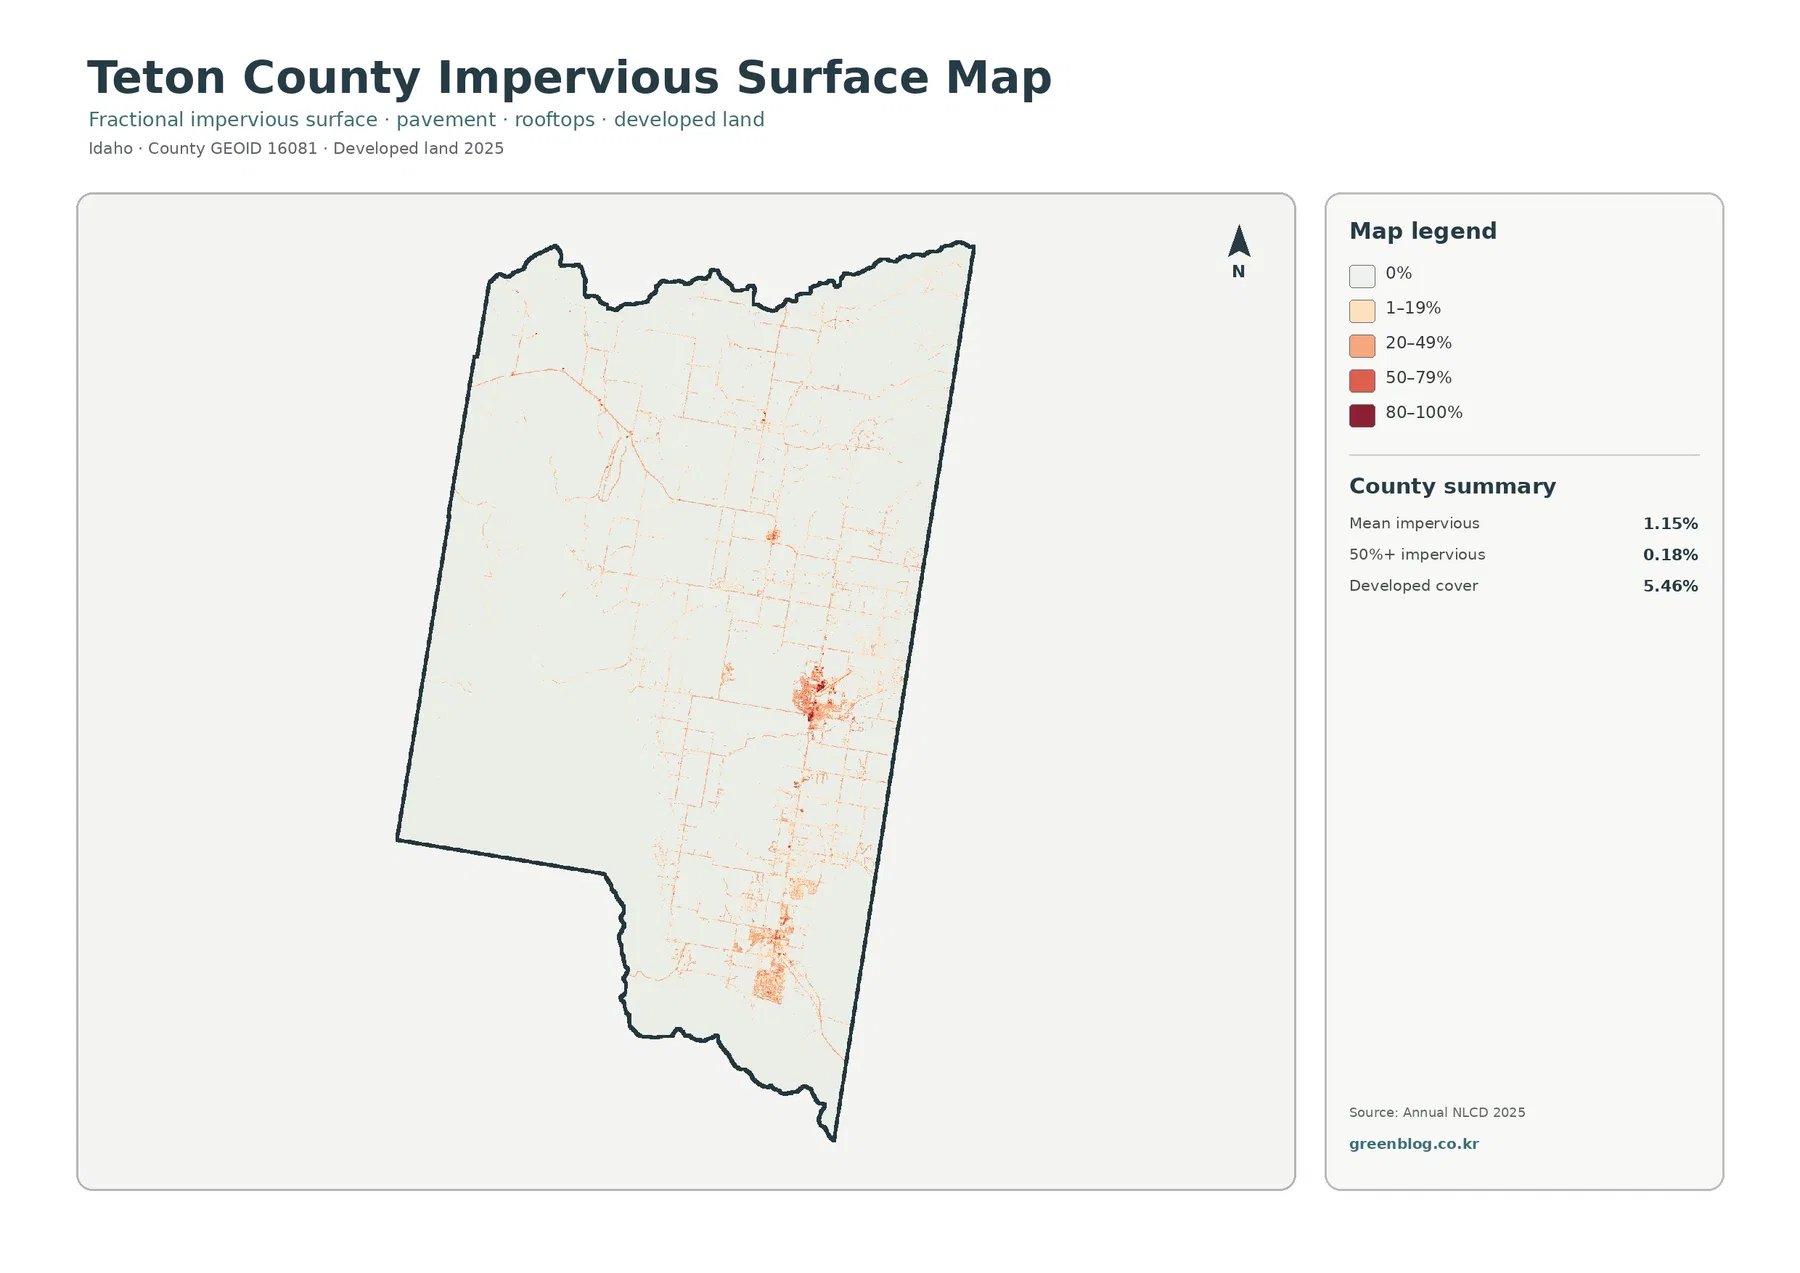
The impervious map looks much lighter than the general land-cover view because it isolates surfaces that resist water infiltration. Mean impervious cover is 1.15% countywide, and only 0.18% of the county is mapped at 50% impervious or greater. Developed land, by comparison, accounts for 5.46% of the 2025 land-cover summary.
That difference is expected. Developed land can include lawns, trees, bare soil, and other permeable surfaces surrounding buildings and roads. Impervious cover focuses more narrowly on roofs, pavement, parking areas, and similar hard materials. A developed neighborhood can therefore occupy a larger land-cover footprint than its strictly impervious portion.
The strongest hard-surface concentration appears in the central-eastern part of the county, with another clear cluster farther south. Fine lines and smaller marks connect or surround these concentrations, and thin traces also extend through parts of the agricultural interior. The preview does not label streets, highways, town boundaries, or traffic volumes, so those lines should not be assigned specific route names from this image alone.
The 2025 overview combines forest, farms, shrubland, wetlands, and compact development
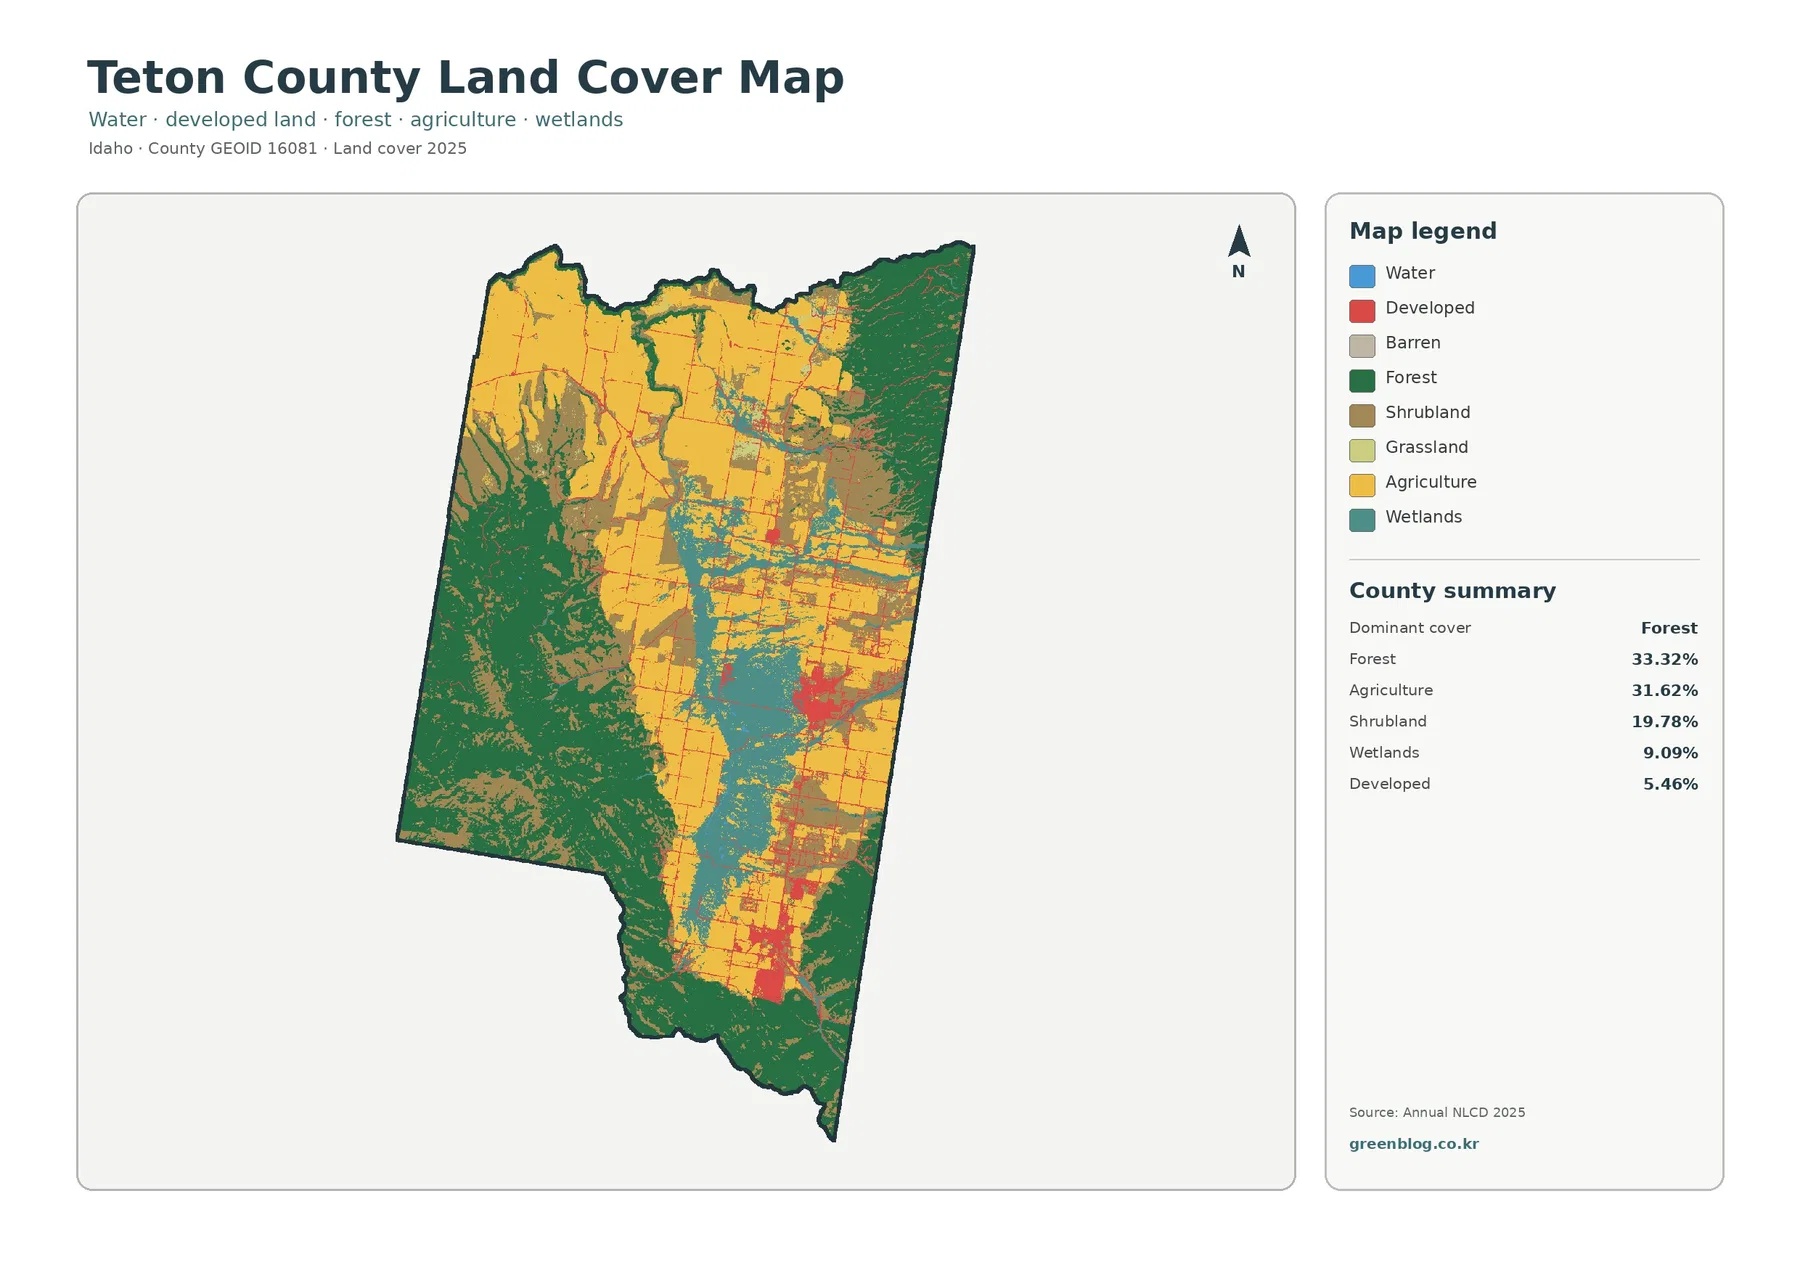
In the full 2025 view, forest is the largest class at 33.32% and agriculture follows closely at 31.62%. Shrubland contributes another 19.78%, wetlands 9.09%, and developed land 5.46%. The map therefore has several large components rather than one class covering nearly everything. Forest dominates broad western and eastern areas, while agriculture occupies much of the interior.
Red developed cells are concentrated rather than evenly scattered. One prominent cluster appears in the central-east, and another stands out farther south. Smaller red pieces and thin traces occur between and around them. The pattern can be described as concentrated development within a much larger agricultural and natural landscape, but the map does not provide municipal boundaries or enough labels to define the exact limits of any settlement.
The general map also shows why land cover should not be treated as zoning or legal land use. A developed cell does not establish a building permit or zoning designation, and an agricultural cell does not prove that an entire parcel is actively cultivated. Forest and wetland colors likewise do not define ownership, regulatory buffers, or jurisdictional wetland boundaries. Those questions require current official records and, in some cases, field work.
The 1985–2025 comparison marks different classifications, not a single cause
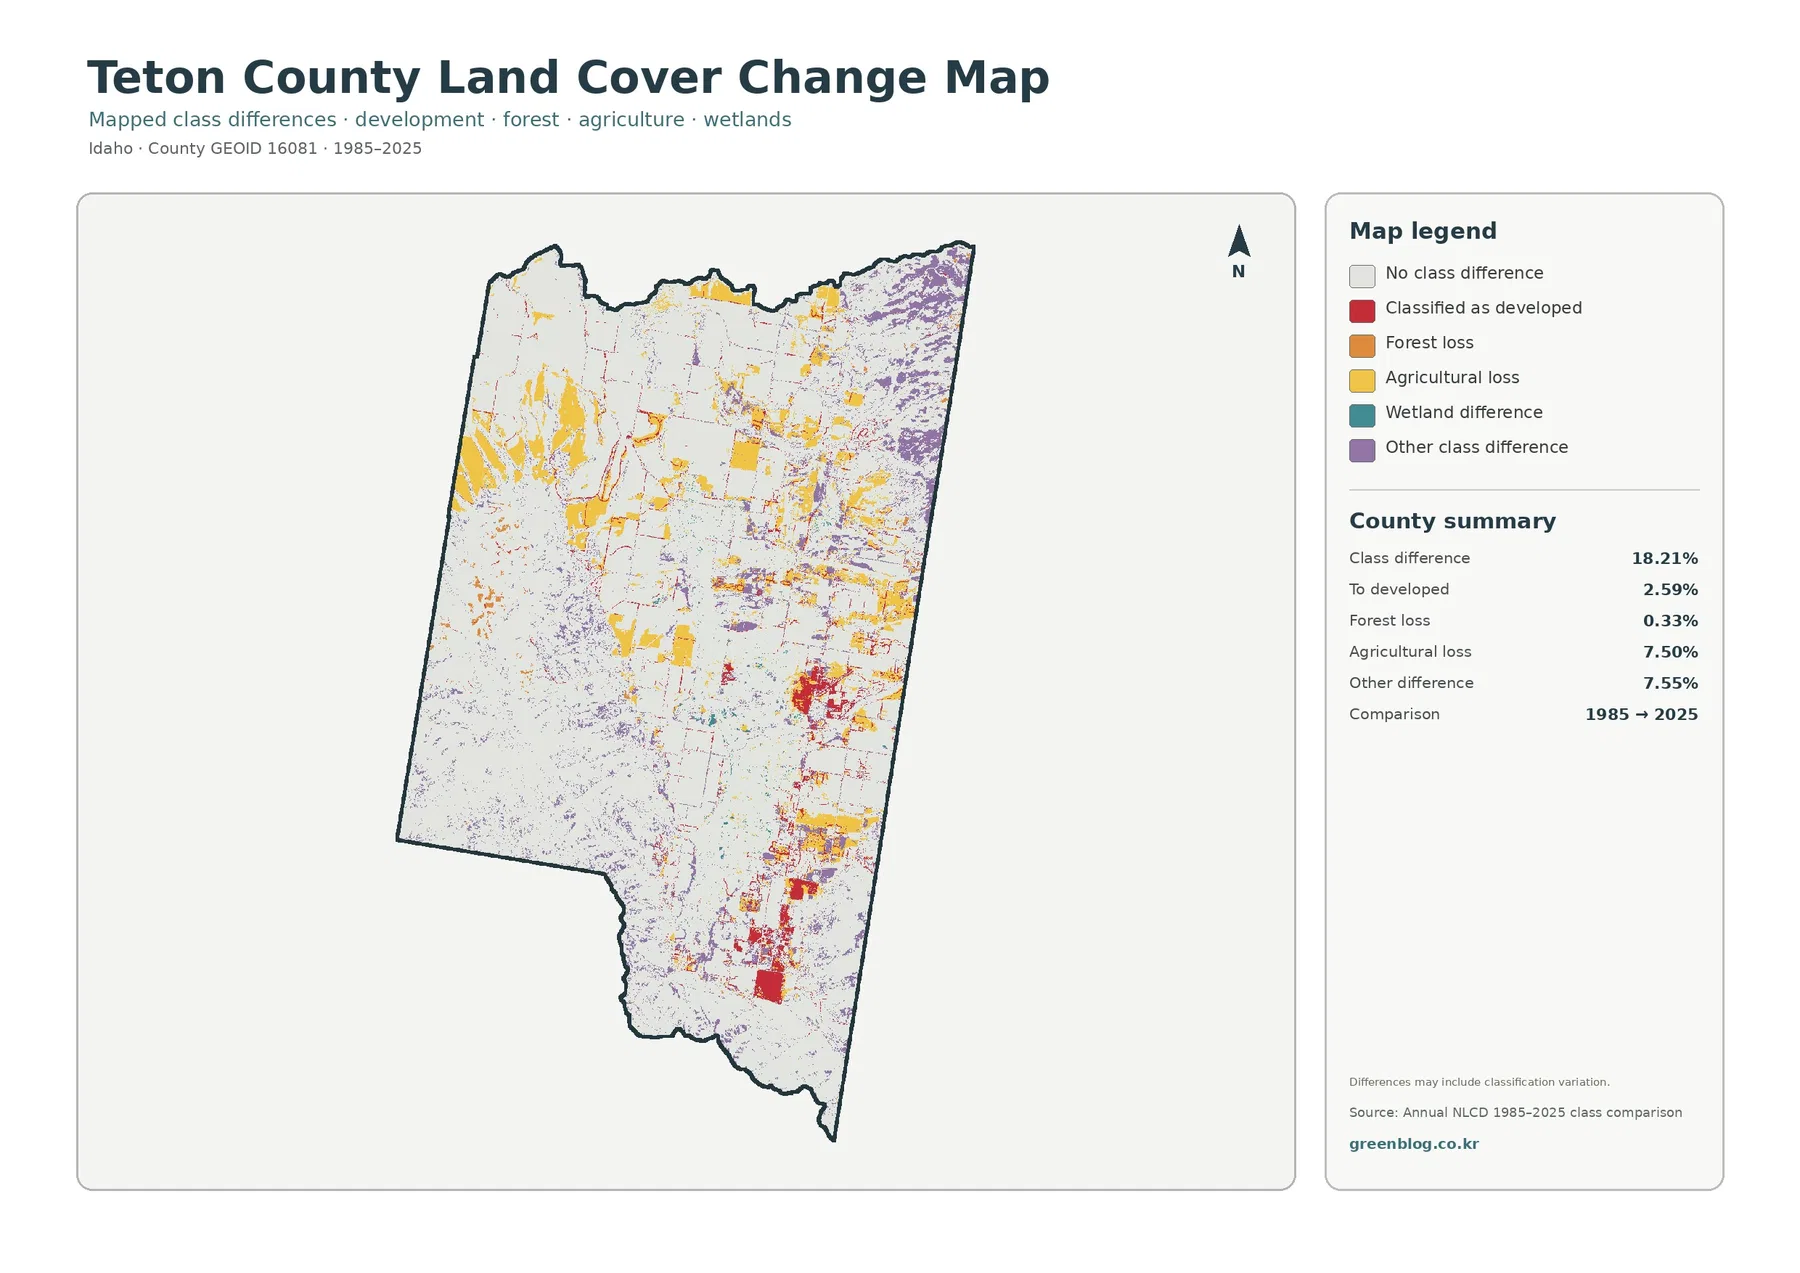
The supplied endpoint comparison reports 18.21% total class difference between 1985 and 2025. Listed components include 2.59% classified as developed, 0.33% forest loss, 7.50% agricultural loss, and 7.55% other difference. Wetland difference appears in the legend, but the summary does not provide a separate percentage for it. A residual calculation should therefore not be presented as an official wetland-change value.
Agricultural-loss colors appear in multiple northern and central blocks, often near the broad agricultural areas seen on the current-cover map. Purple other-class differences are widespread along portions of the eastern side and occur in several interior areas. Red cells classified as developed are most noticeable around the same central-eastern and southern areas where current hard surfaces are concentrated, although smaller red marks occur elsewhere as well.
The label “agricultural loss” means that a cell classified as agriculture at the earlier endpoint received another class at the later endpoint. It does not identify abandonment, subdivision, erosion, a particular crop decision, or any other cause. Likewise, “forest loss” does not by itself prove logging, fire, development, or permanent clearing. Real land change and classification variation can both contribute to endpoint differences.
Timing also remains unresolved in a two-date comparison. A cell that differs in 1985 and 2025 could have changed at any point between those dates, while a cell with the same class at both endpoints could have changed in the middle and later returned to the original category. Intermediate annual imagery and local records are necessary when the exact year or cause matters.
How the four views work together
Each original JPG measures 2480 × 1754 pixels. That is useful for screen graphics, documents, ordinary presentations, and many classroom materials. The package does not mark these files as meeting an A3 high-resolution reference, so a large-format print should be tested before relying on fine boundary detail or small text.
Resolution, date, and classification limits matter at local scale
Annual NLCD is designed for consistent regional land-cover comparison. Its 30-meter raster cells are appropriate for county-scale patterns, but they simplify local detail. A narrow stream, hedge, road shoulder, small wetland, or building can be absorbed into the predominant class of a cell. The maps should therefore be treated as broad surface summaries rather than substitutes for survey, parcel, or engineering data.
The current maps represent the supplied 2025 observation year. Construction, vegetation changes, agricultural activity, flooding, restoration, or other surface changes after that observation may not appear. Anyone using the page for a present-day project should compare it with current imagery and the latest local records.
Files included in the four-map JPG download
The ZIP contains one JPG for 2025 land cover, one for forest and farmland, one for impervious surface and developed land, and one for the 1985–2025 land-cover comparison. A practical way to use the set is to select the overview first, then add the specialized map that matches the topic: vegetation and farming, hard surfaces, or endpoint class differences.
Frequently Asked Questions
Is Teton County more forested or more agricultural in the 2025 summary?
Forest is slightly larger at 33.32%, while agriculture accounts for 31.62%. Their totals are close, but their locations differ: broad forest areas occupy much of the western and eastern sides, while large agricultural blocks are concentrated through the interior.
Why is wetland cover 9.09% when open water is only 0.08%?
The classes describe different surfaces. Open water focuses on exposed water, while wetlands can include saturated ground and water-influenced vegetation. That is why broad teal wetland areas can appear through the county even though mapped open water is very limited.
Does the 18.21% class difference mean that 18.21% of the county was damaged or developed?
No. It is the share of cells that received different land-cover classes at the 1985 and 2025 endpoints. The difference can reflect real surface change as well as classification variation, and it does not identify the exact year or cause of a change.
Sources and Reference Data
- MRLC Annual NLCD Data – official access point for annual land-cover and comparison products
- USGS Annual NLCD Land Cover Classification – definitions and guidance for forest, agriculture, wetlands, developed land, and related classes
- U.S. Census Bureau TIGER/Line Shapefiles – official county-boundary reference for Teton County
Map File Information
The ZIP contains four original JPG maps for comparing Teton County’s 2025 land cover, forest and farmland, impervious and developed surfaces, and 1985–2025 class differences.
- Included Files: Four original JPG land-cover maps
- File Type: JPG files in one ZIP archive
- Intended Use: Printing, education, presentations, and map-based projects
Related Maps
Green Map creates custom-edited map images using open geographic data sources such as geoBoundaries, Natural Earth, OpenStreetMap, and government open data. These maps are edited visual materials, not raw data files, and are provided for education, documents, presentations, and graphic reference.