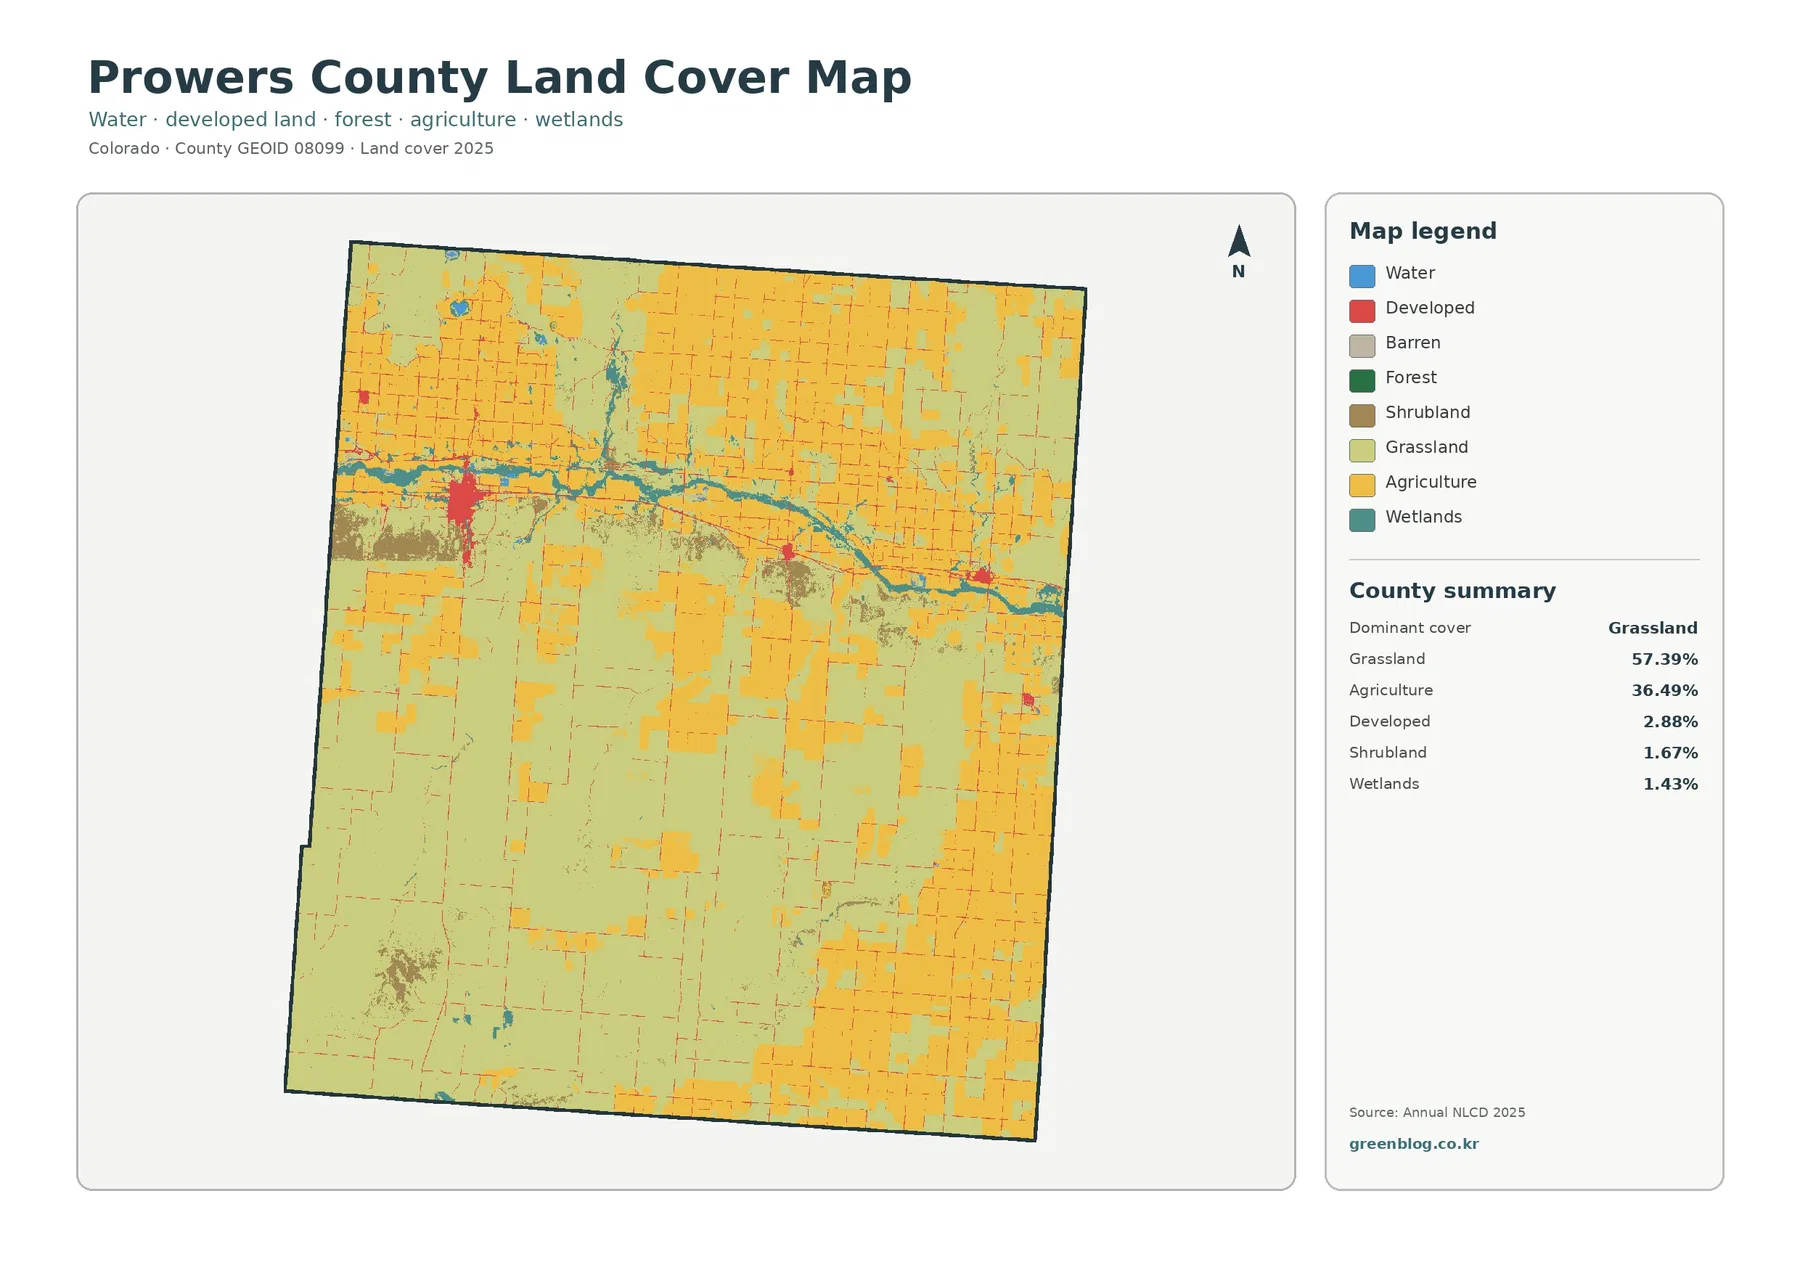
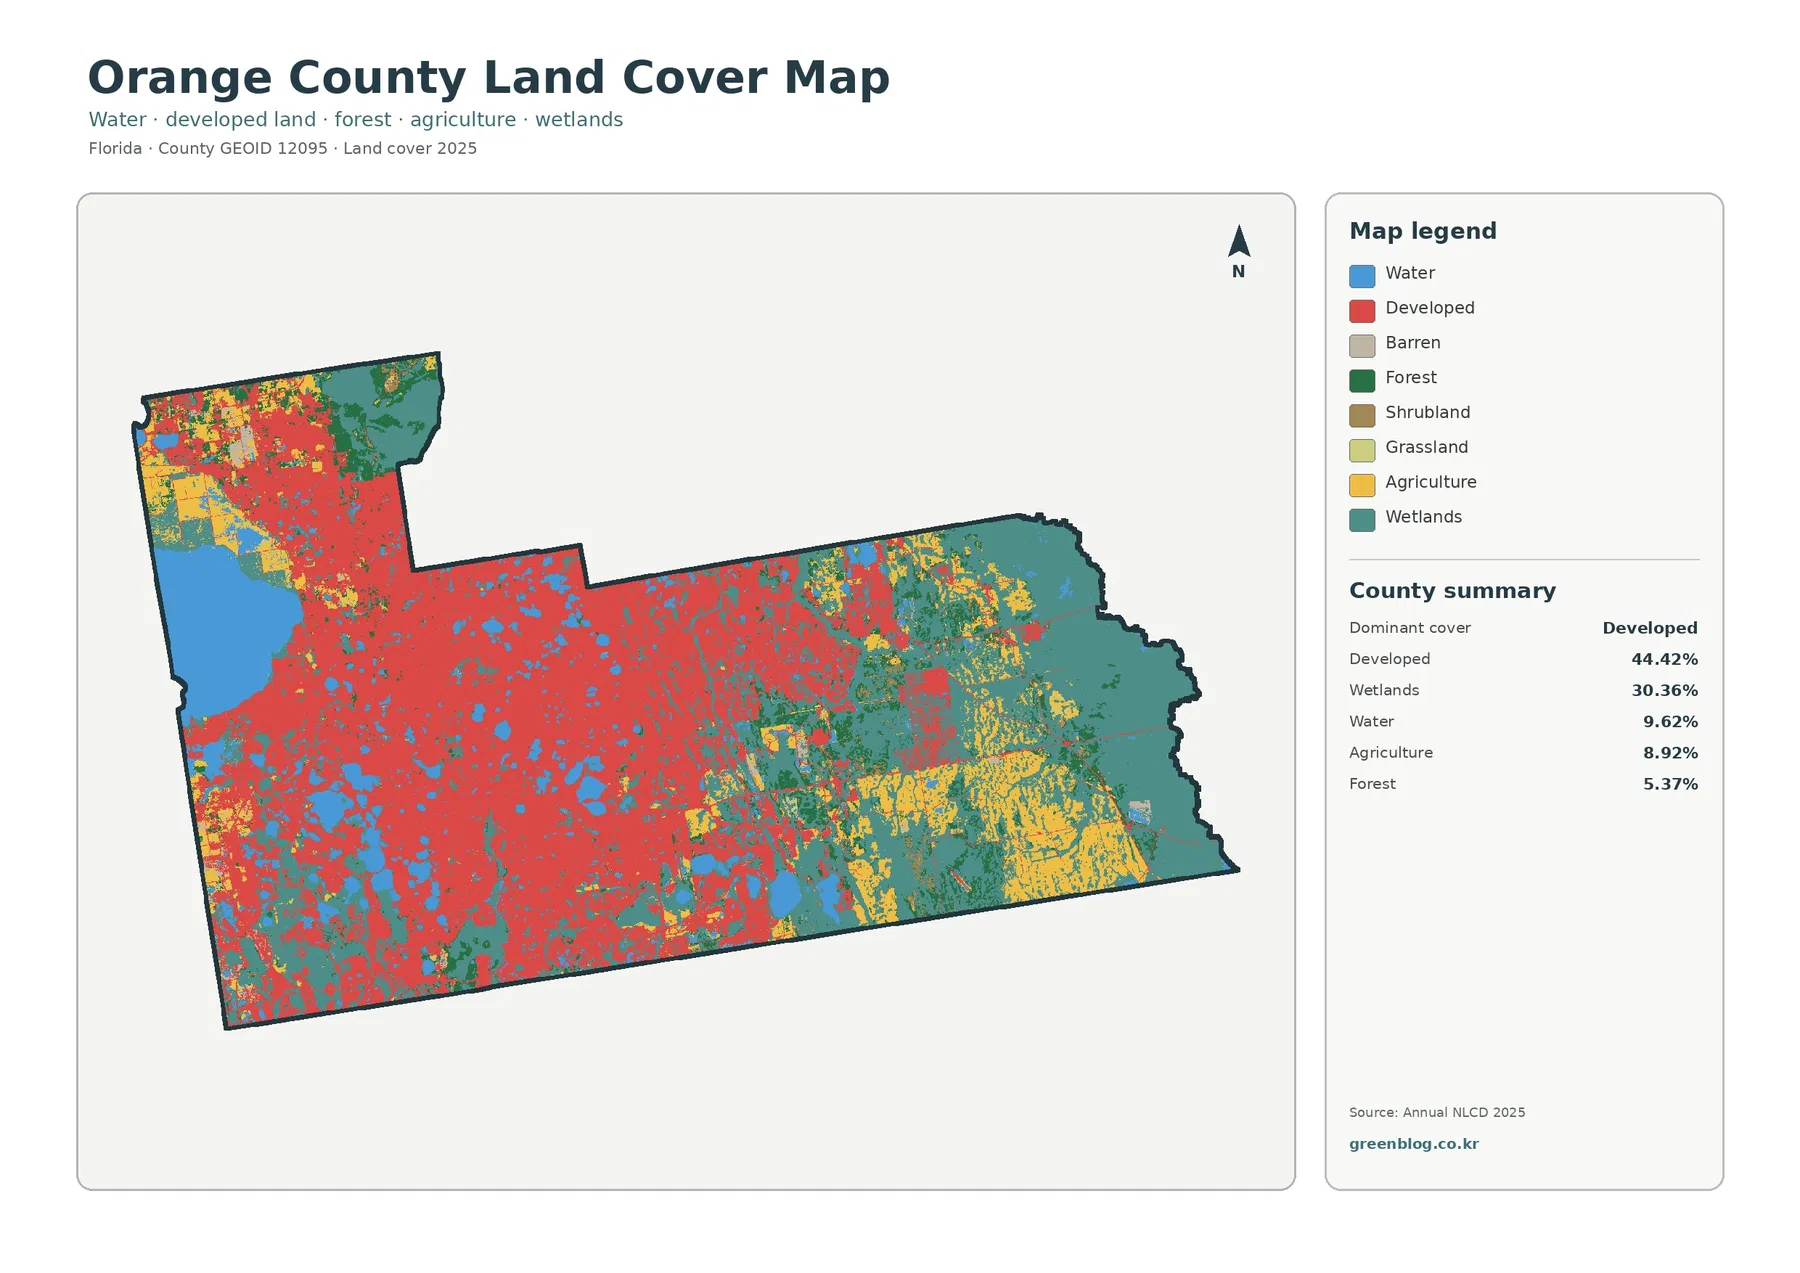
The Power County Idaho Land Cover Map shows a county where open shrub and grass cover occupies most of the broad landscape, while agriculture forms large blocks around the Snake River and American Falls Reservoir and in several interior valleys. The 2025 summary lists shrubland at 41.79%, agriculture at 24.93%, and grassland at 21.25%. Forest accounts for 6.29%, developed land for 2.75%, water for 2.42%, and wetlands for 0.55%. Those percentages are more useful when read with the map, because the smaller forest and developed classes are strongly concentrated in particular parts of the county rather than spread evenly from border to border.
This page includes four related views: 2025 land cover, forest and farmland, impervious surface and developed land, and a 1985–2025 class-difference comparison. The WebP previews make it easy to compare the same county at a glance, and the four original JPG maps are available together in one ZIP download below. Each JPG is 2480 × 1754 pixels. They work well for county profiles, lessons, presentations, and general reference, but the package does not mark them as meeting an A3 high-resolution standard, so large-format printing should be tested before final use.
Table of Contents
Shrub country dominates the acreage, but farm blocks break up the open cover
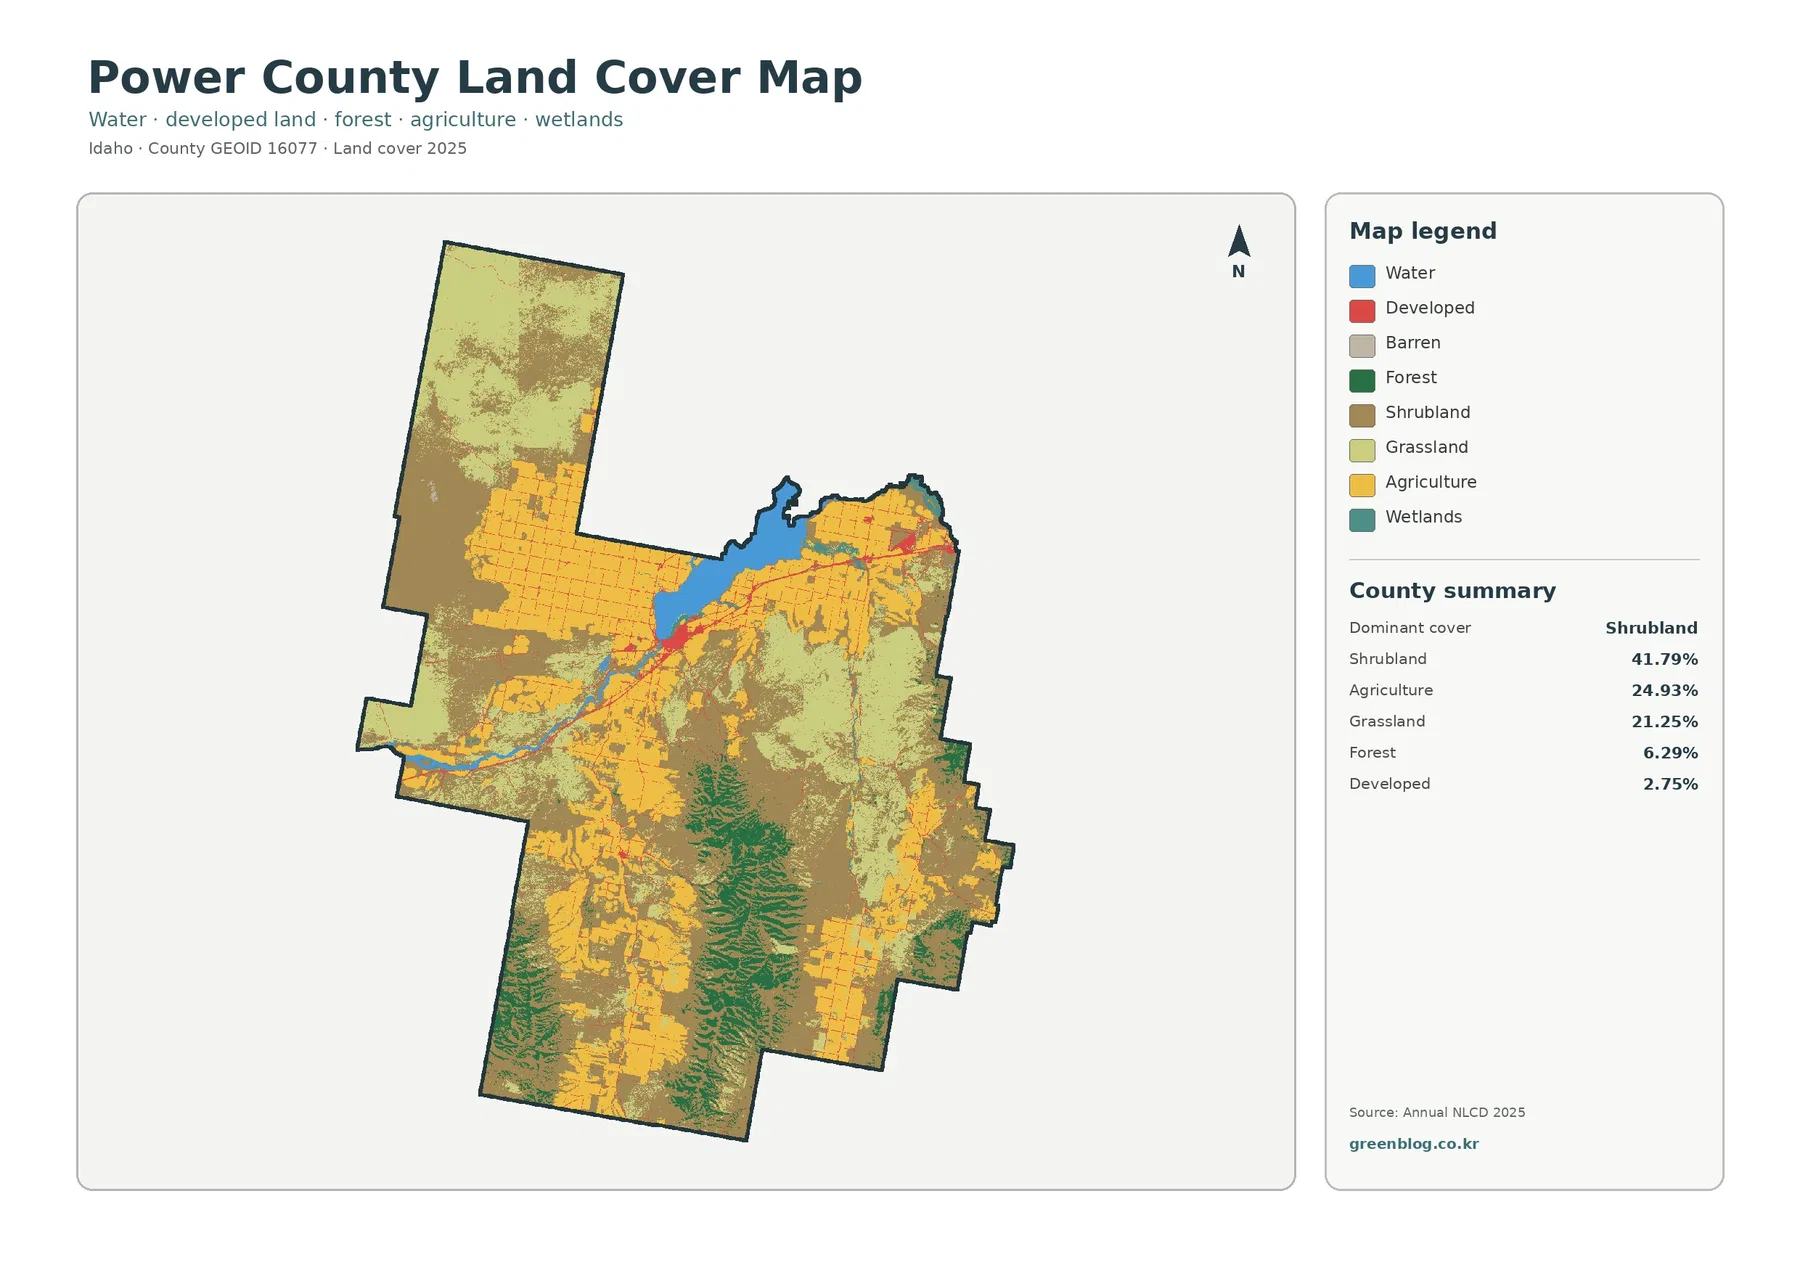
Shrubland is the largest class at 41.79%. It fills much of the long northern extension, covers broad central and eastern areas, and continues through large sections of the south. Grassland adds another 21.25%, so open non-forest cover is a major part of the countywide picture. The two classes touch and intermingle in many places instead of forming one clean north-south division. That makes it more accurate to describe Power County as a shrub-dominant county with substantial grassland and agricultural interruptions than as a landscape controlled by a single uniform cover type.
American Falls Reservoir puts water beside some of the county’s largest farm areas
Local material from the Power Soil and Water Conservation District describes agriculture and ranching as major parts of the county and notes the use of American Falls Reservoir, the Snake River, and groundwater for irrigation. It also identifies potatoes, grains, sugar beets, and cattle among important regional commodities. Those facts help explain the local setting around the mapped farm blocks, but the yellow land-cover cells do not identify crop species. A cell classified as agriculture can show working cropland or related agricultural cover without telling a reader whether a particular field contains potatoes, wheat, sugar beets, or another crop in a given year.
Fading the towns makes the southern forest and irrigated field network easier to see
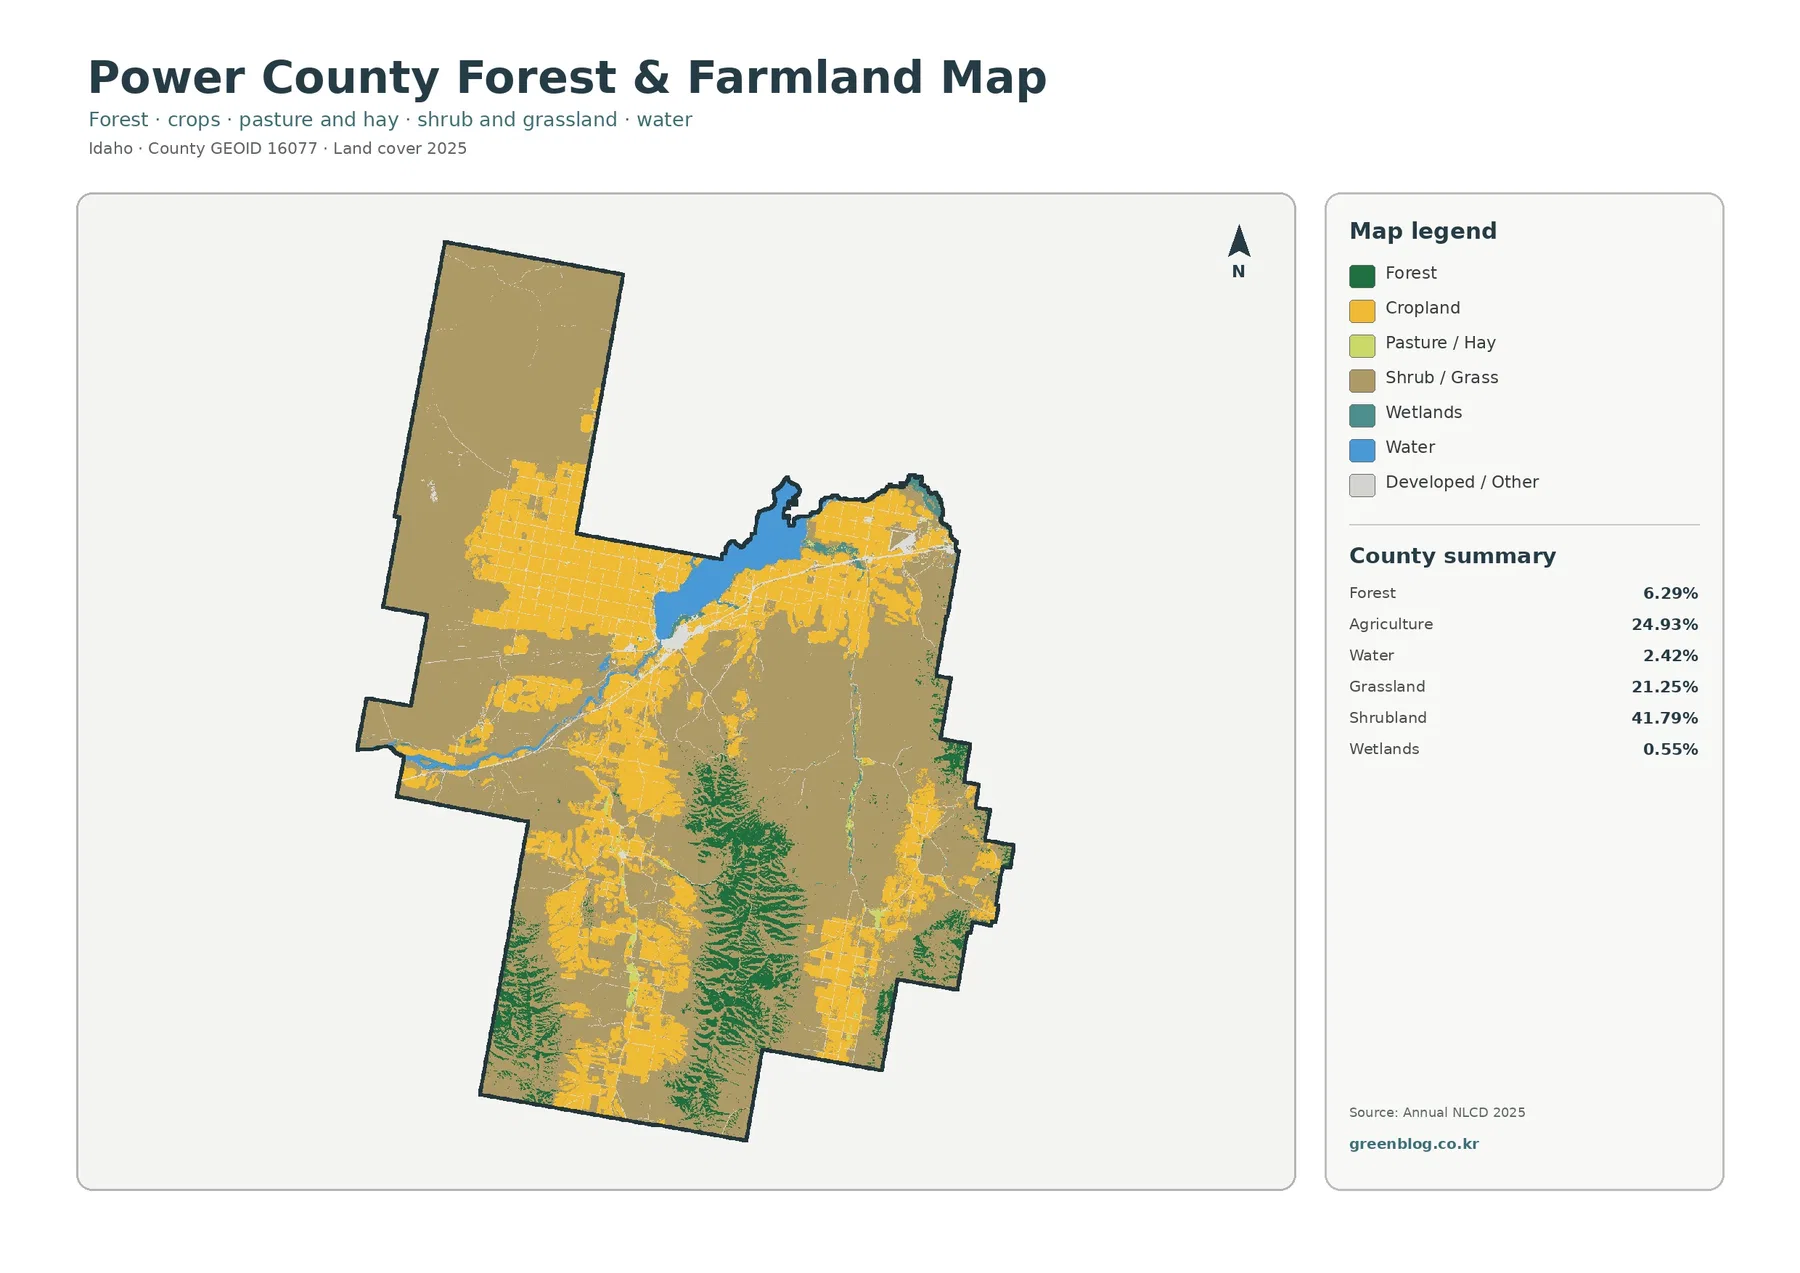
The forest-and-farmland view reduces the visual weight of developed and miscellaneous surfaces, so the 24.93% agricultural share and the 6.29% forest share become easier to compare by location. The large western farm grid is especially clear, and fields also continue around the reservoir, through the interior, and into parts of the south and east. Because the surrounding shrub and grass cover is simplified into broad open tones, the map makes the edges between working land and natural vegetation more noticeable than the general land-cover view does.
Only a small share is developed, and hard surfaces are even more concentrated
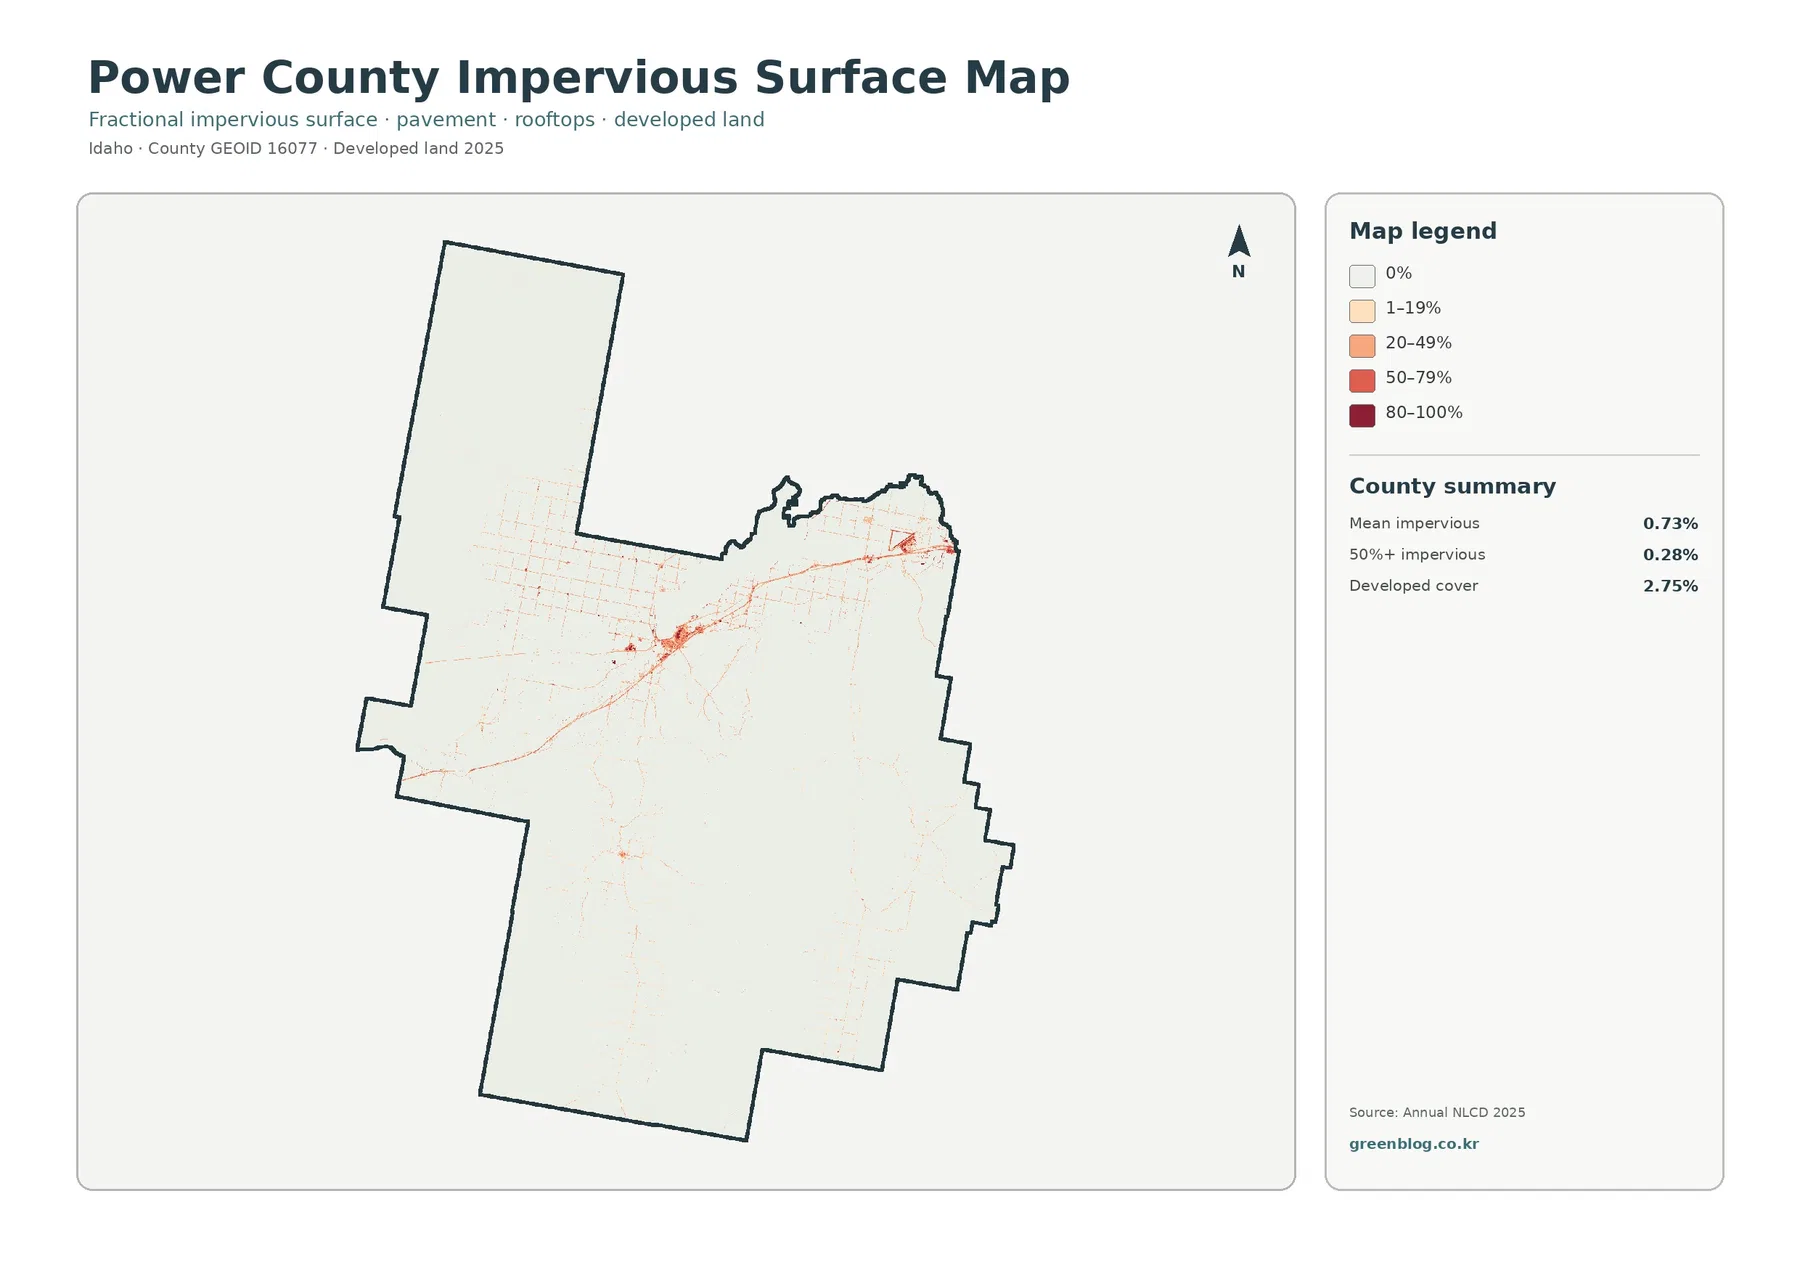
Impervious surface means hard material such as rooftops, pavement, and parking areas where water does not readily soak into the ground. Power County’s mean impervious cover is 0.73%, and only 0.28% of the county is mapped at 50% impervious or higher. Both values are lower than the 2.75% developed-land share. That difference is expected because a developed land-cover class can include lawns, trees, exposed soil, and other permeable surfaces around buildings and roads, while the impervious layer focuses more narrowly on hard materials.
The darkest and most continuous hard-surface concentration appears in the American Falls area near the reservoir and Snake River corridor. Thin lines extend outward from that cluster, and a separate group is visible toward the northeastern side of the mapped county. Scattered marks also appear in the south. Those lines may coincide with transportation routes, but the preview has no route labels or traffic information. An official transportation or county GIS layer is needed before attaching a road name, classification, or traffic interpretation to any one line.
The 29.91% endpoint difference is a classification comparison, not a damage total
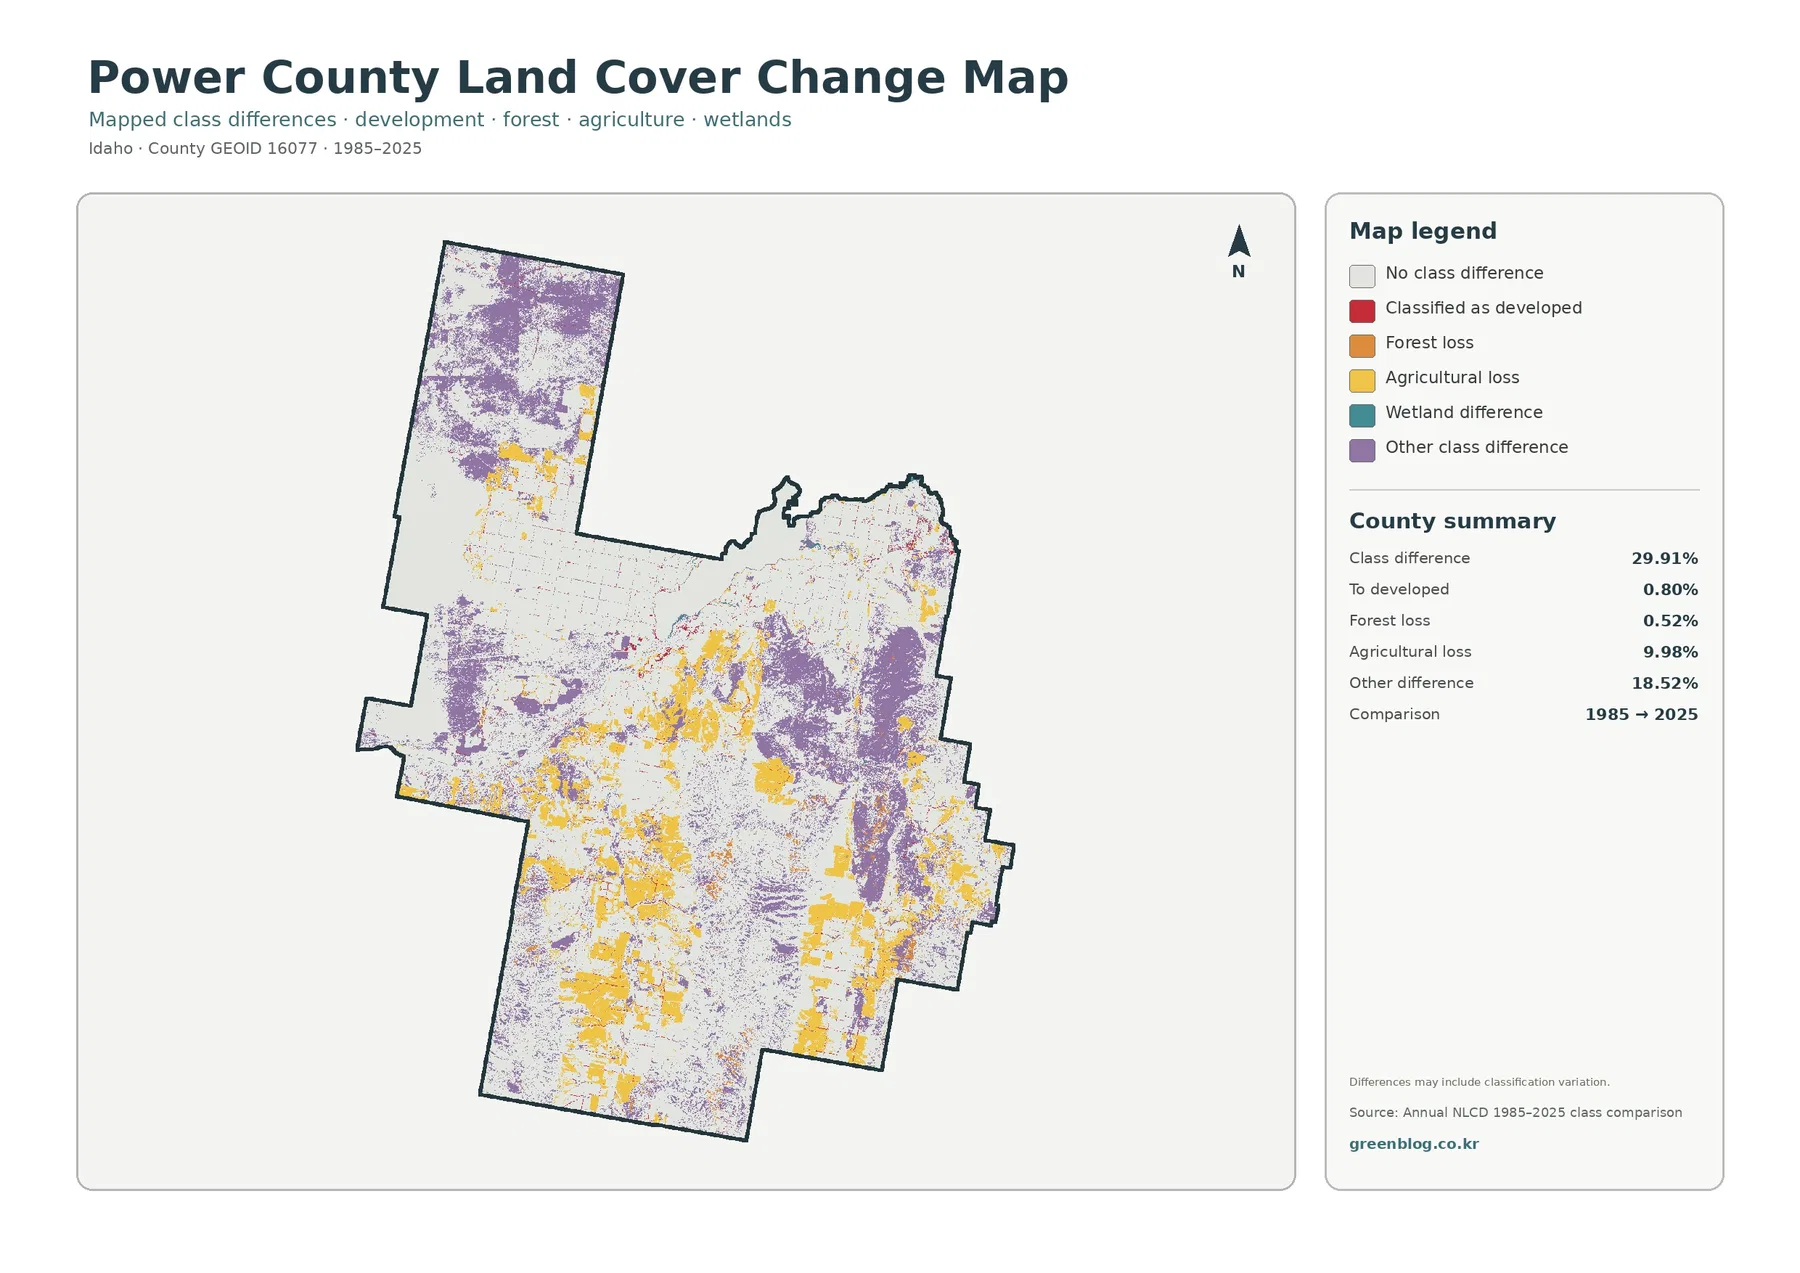
The endpoint comparison reports 29.91% total class difference between 1985 and 2025. The listed components are 0.80% classified as developed, 0.52% forest loss, 9.98% agricultural loss, and 18.52% other difference. Wetland difference appears in the legend but does not have its own percentage in the county summary. A residual should therefore not be calculated and presented as an official wetland value. The safest interpretation is to use only the percentages explicitly supplied by the map.
“Agricultural loss” means that a cell classified as agriculture in 1985 received another class in 2025. It does not automatically mean permanent farm abandonment or urban construction. Crop rotation, fallow conditions, a change between cropland and grass-related classes, irrigation conditions, image timing, and mixed pixels can all complicate an endpoint comparison. To determine when and why a specific field changed, a reader would need intermediate Annual NLCD years, aerial imagery, agricultural records, and often local knowledge.
How to use the 30-meter maps without treating them like parcel data
Annual NLCD uses square cells about 30 meters across and assigns one predominant land-cover class to each cell. A cell may contain crops, a ditch, a farm road, a tree line, a building, and bare soil, yet the map still reduces that mixture to one main category. Zooming in makes the cells larger on screen but does not create missing parcel detail. These maps are useful for county-scale comparison, not for property ownership, exact field boundaries, zoning, legal wetland determinations, building permits, or survey work.
Each supplied JPG measures 2480 × 1754 pixels. The files are appropriate for ordinary documents, slides, web graphics, and moderate-size reference prints, but the package does not identify them as A3 high-resolution output. Test any large enlargement before production. When a project requires precise boundaries or editable geographic data, combine these reference graphics with Census TIGER/Line files, current county GIS or planning maps, higher-resolution imagery, or the original land-cover datasets rather than trying to extract detail that is not present in the JPG.
What is included in the four-map JPG download
The ZIP contains one JPG each for 2025 land cover, forest and farmland, impervious surface and developed land, and 1985–2025 land-cover change. Start with the countywide image, then add the focused map that best supports the question. That approach keeps legends and colors easier to explain while still showing the county’s broad shrubland, agricultural blocks, reservoir-side development, southern forest, hard surfaces, and endpoint class differences.
Frequently Asked Questions
Is agriculture the largest land-cover class in Power County?
No. Shrubland is the largest 2025 class at 41.79%. Agriculture accounts for 24.93%, and grassland accounts for 21.25%. Farm blocks are visually prominent because many have straight edges and occur in large groups, but open shrub cover occupies more total area.
Why is developed land 2.75% when mean impervious cover is only 0.73%?
Developed land-cover classes can include lawns, trees, soil, and other permeable surfaces around buildings and roads. Impervious cover isolates rooftops, pavement, parking areas, and similar hard materials, so the countywide mean is lower than the full developed-land percentage.
Does the 29.91% class difference mean that nearly one-third of Power County was damaged?
No. It is the share of cells with different classifications at the 1985 and 2025 endpoints. Real land-cover change and classification variation can both contribute. The map does not identify the exact year, event, project, or environmental cause for an individual difference.
Sources and Reference Data
- MRLC Annual NLCD Data – official access point for annual land-cover and comparison products
- USGS Annual NLCD Land Cover Classification – definitions and guidance for shrubland, grassland, agriculture, forest, developed land, water, wetlands, and related classes
- U.S. Census Bureau TIGER/Line Shapefiles – official county-boundary reference for Power County
- Power County Comprehensive Plan – official local planning context for American Falls, Rockland, land use, and county development
- Bureau of Reclamation – American Falls Resource Management Plan – official background on American Falls Dam, Reservoir, and project lands
- Power Soil & Water Conservation District – local information on farming, ranching, irrigation, soils, and natural resources
Map File Information
The ZIP contains four original JPG maps for comparing Power County shrubland, agriculture, grassland, American Falls Reservoir, developed surfaces, and 1985–2025 class differences.
- Included Files: Use only the versions confirmed in the article and supplied images
- File Type: Use the confirmed download contents
- Intended Use: Printing, education, presentations, and map-based projects
Related Maps
Green Map creates custom-edited map images using open geographic data sources such as geoBoundaries, Natural Earth, OpenStreetMap, and government open data.
These maps are edited visual materials, not raw data files, and are provided for education, documents, presentations, and graphic reference.