Lincoln County, Idaho is dominated by open cover in the 2025 land-cover summary. Grassland accounts for 47.89% of the county and shrubland adds 36.93%, while agriculture occupies 12.65% in several distinct blocks. Developed land covers 2.43%, so towns and roads appear as small features inside a much larger grass-and-shrub landscape. The four maps on this page make it possible to compare that broad pattern with farm areas, impervious surfaces, and mapped class differences between 1985 and 2025.
The four original JPG maps are available together in one download. They are useful when you want the same county boundary shown with different information rather than trying to read every question from one crowded map. Land cover describes what is physically covering the ground in the mapped data. It does not show parcel ownership, zoning, water rights, legal land use, or whether a particular property can be developed.
Table of Contents
Open cover defines the county before farms or towns come into view
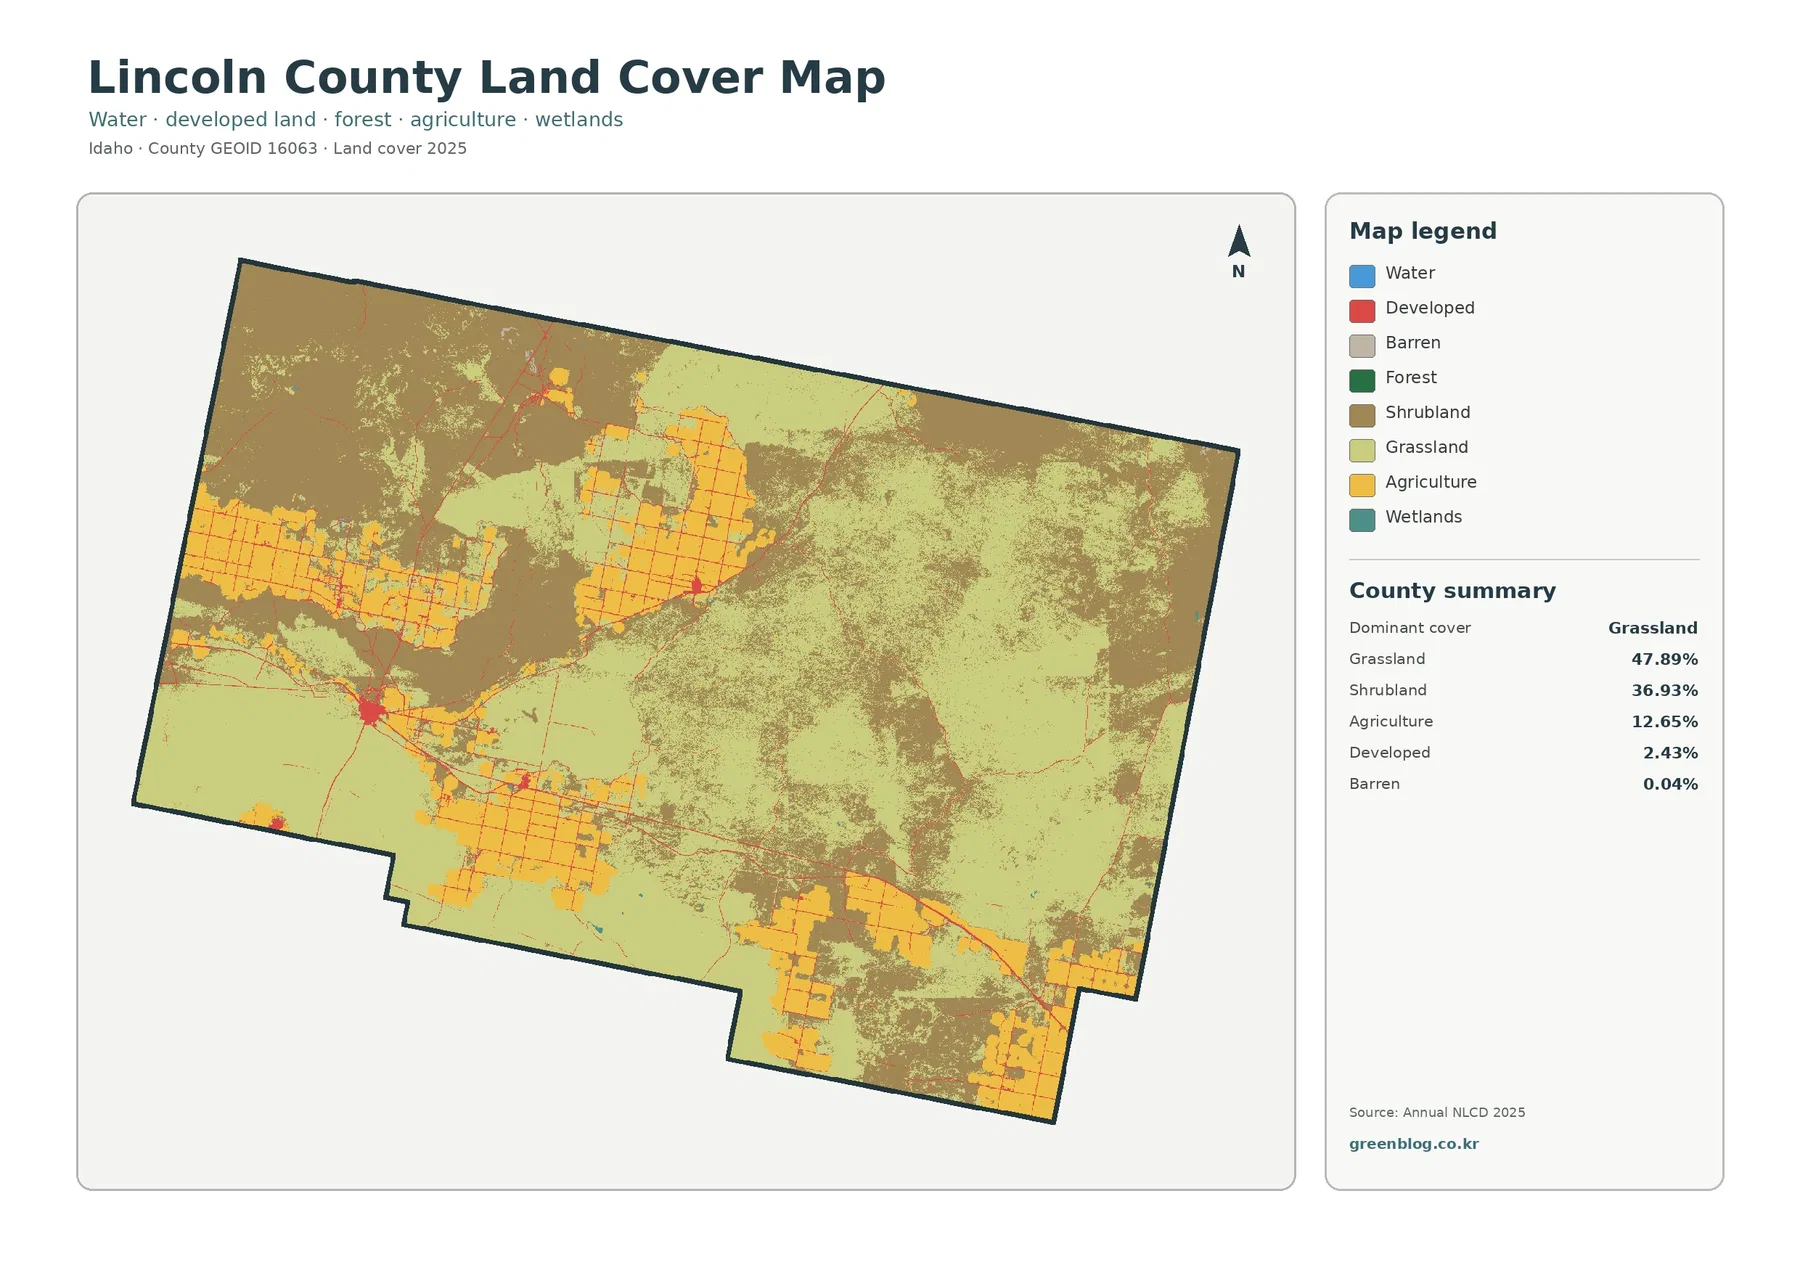
The 2025 land-cover map is mostly a combination of light grassland tones and brown shrubland. Together, those two classes exceed 84% of Lincoln County. The largest continuous areas occur across much of the eastern half and through broad northern and interior sections outside the farm blocks. This is the first pattern to establish before focusing on small red developed features or the yellow agricultural areas, because the countywide landscape is overwhelmingly open rather than forested or urban.
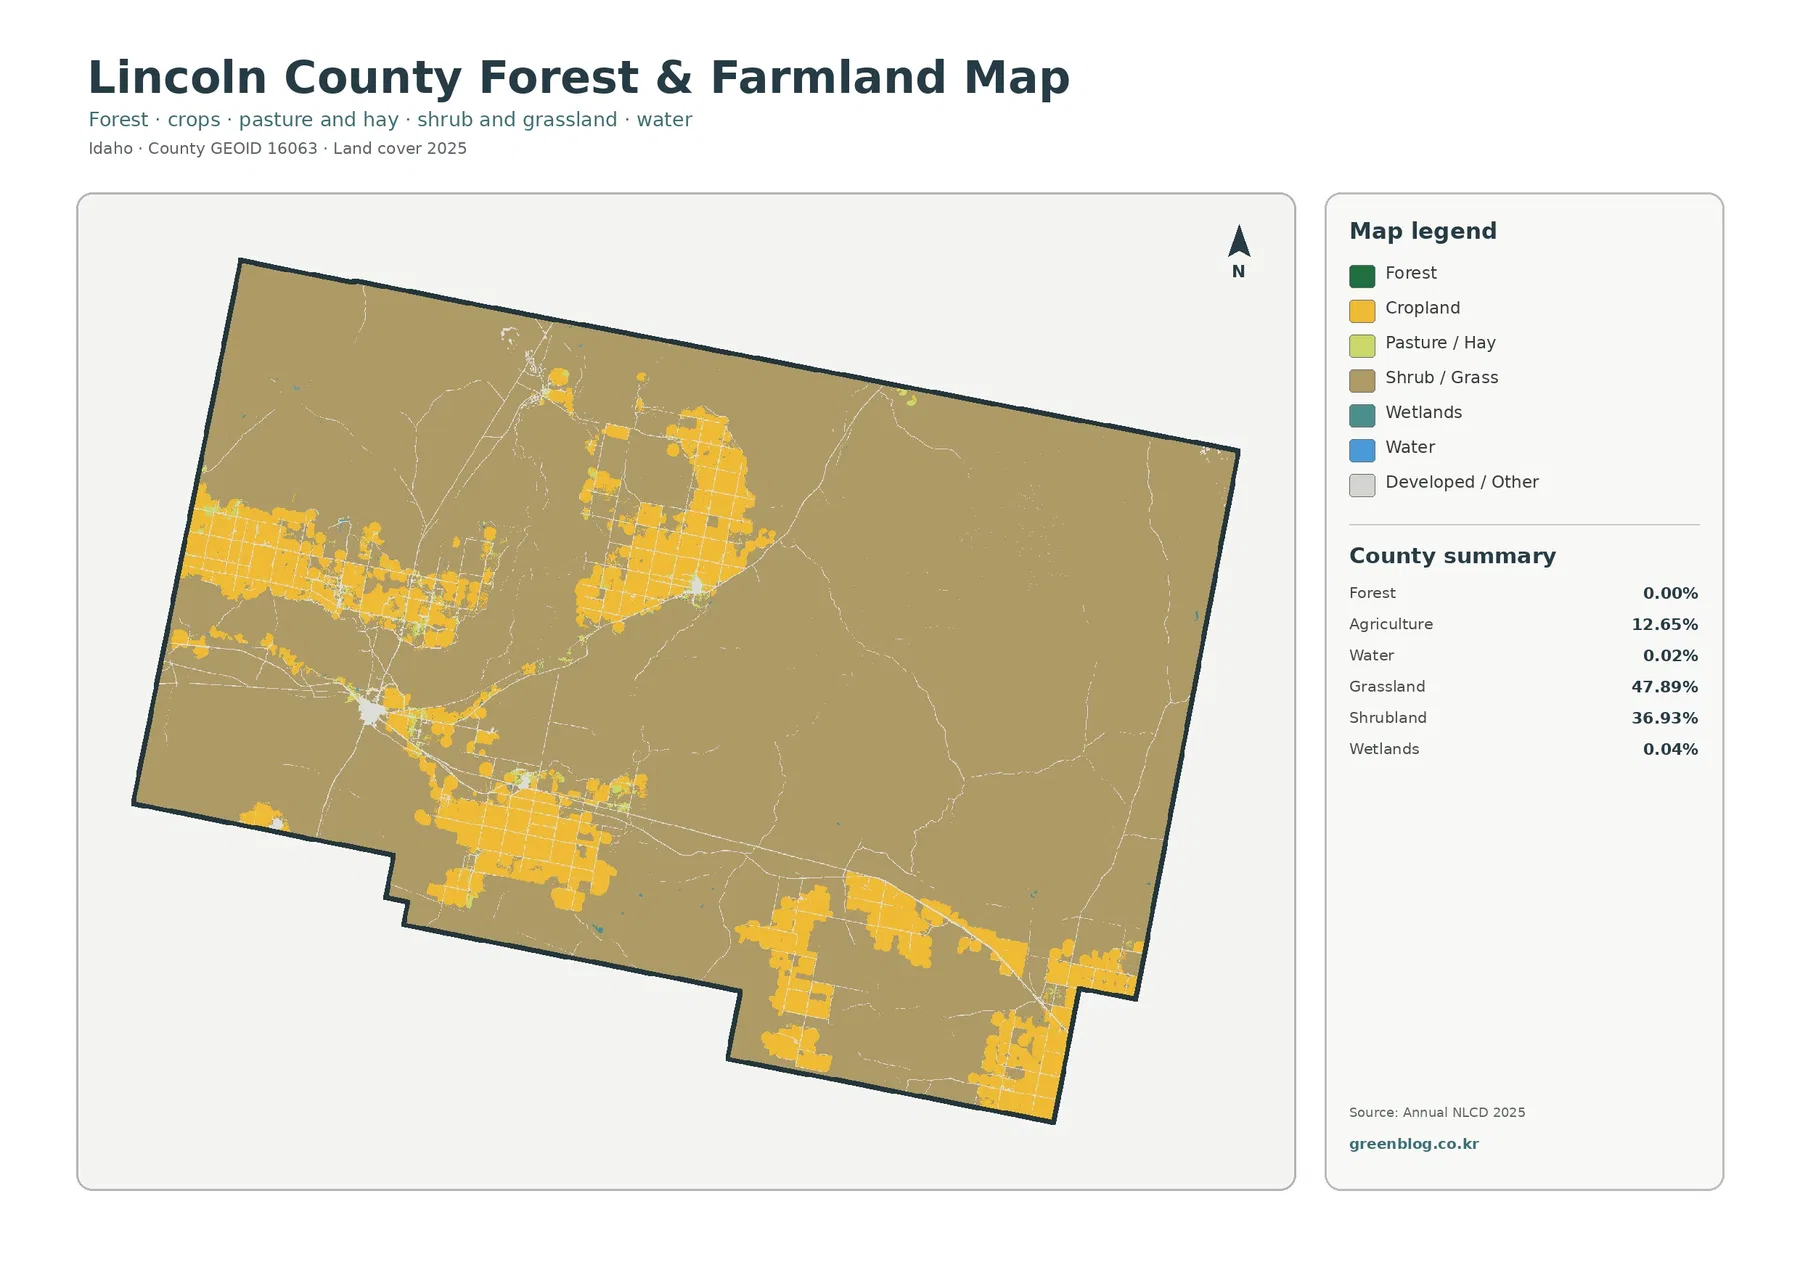
Agriculture forms a different geometry. Instead of spreading evenly, yellow fields collect in large blocks in the west, north-central interior, southern area, and southeast. Many of those blocks have straight edges and grid-like internal lines that contrast with the more irregular grassland and shrubland around them. Agriculture represents 12.65% of the county, which is modest as a countywide percentage but visually dominant inside the places where farming is concentrated.
Developed land is 2.43%, barren land 0.04%, water 0.02%, and wetlands 0.04%. Forest is reported as 0.00% in the county summary. That number should not be read as a claim that no individual trees or woody vegetation exist anywhere in Lincoln County. It means that the mapped 2025 county summary has essentially no area counted in the forest class at the displayed precision. Small tree groups or riparian vegetation can fall inside other 30-meter cells and still be present on the ground.
Shoshone, Dietrich, and Richfield remain small marks on the impervious surface map
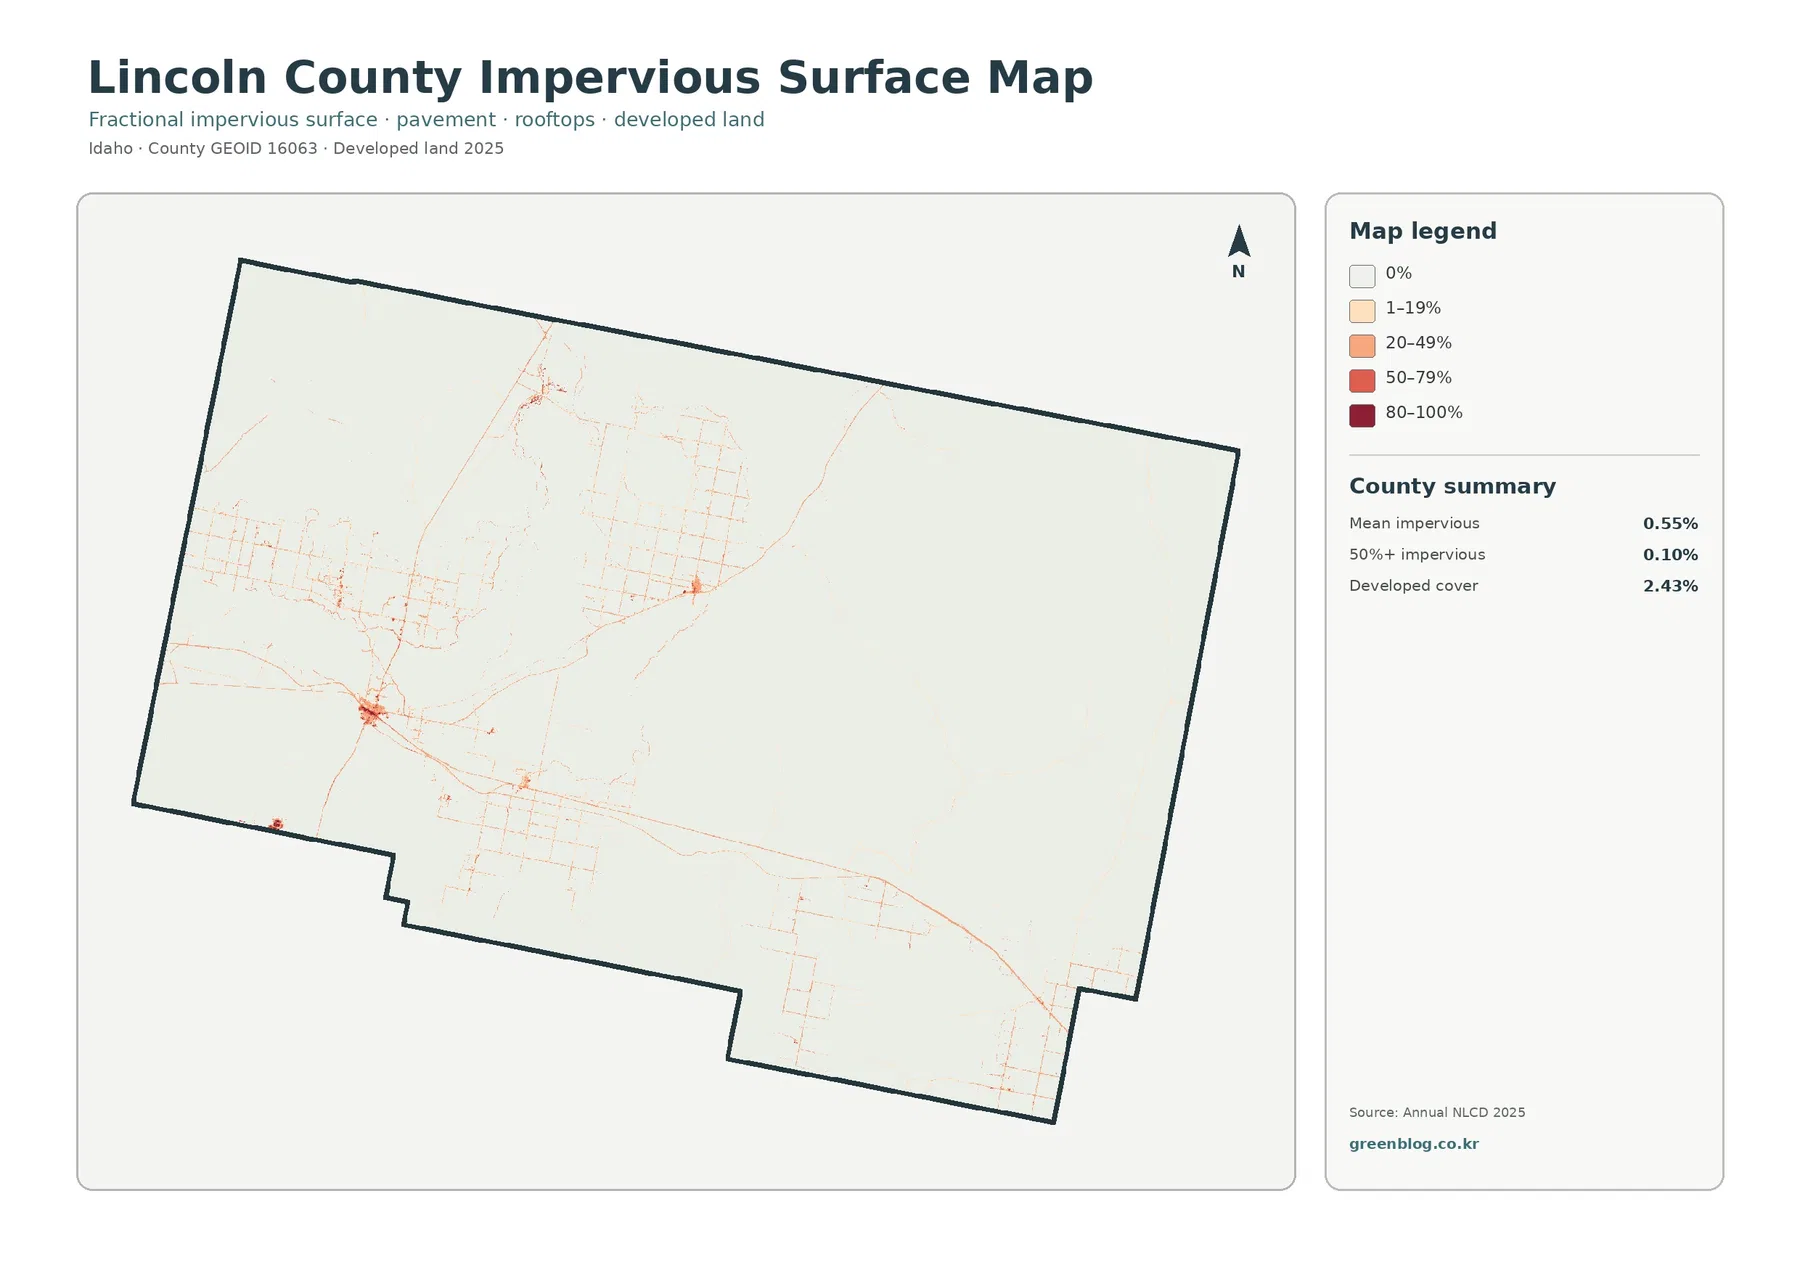
Impervious surface means pavement, rooftops, parking areas, and other hard surfaces that do not readily absorb water. Lincoln County has a mean impervious value of just 0.55%, and only 0.10% of the county is summarized as having more than 50% impervious cover. Those values are lower than the 2.43% developed-land figure because the two layers measure different things. A developed land-cover cell can still contain soil or vegetation, while the impervious product estimates the hard-surface fraction within a cell.
The U.S. Census Bureau geographic reference map identifies Shoshone, Dietrich, and Richfield inside Lincoln County. Using those places as reference points helps explain the small clusters on the impervious map. The strongest concentration is around the Shoshone area, while other settlements and connecting roads appear as smaller red or orange marks. Most of the large open interior remains near zero, making even compact rural towns visually distinct at county scale.
Thin linear values across agricultural areas should not automatically be interpreted as urban expansion. Rural roads, farm facilities, and other hard surfaces can create narrow impervious features without turning the surrounding land into a dense settlement. The map is therefore better for comparing the concentration of hard surfaces than for measuring a town boundary. When a location matters, compare the impervious map with the general land-cover map and a current street or parcel source rather than treating the colored line as a legal roadway footprint.
Farm blocks make more sense when the local water-management setting is included
The simplified forest-and-farmland map removes much of the color complexity from the general classification. With forest at 0.00%, the county is largely a background of shrub and grass cover interrupted by crop blocks and smaller pasture or hay areas. The major cultivated sections in the west and north-central interior are especially easy to trace in this view, as are separate agricultural areas toward the south and southeast. It is a useful map when the question is not “which of every possible classes is here?” but rather “where are the working agricultural areas relative to the open range?”
University of Idaho Extension describes water availability as a major issue for Lincoln County producers. Its county agriculture program notes irrigation connected to the Magic Reservoir and American Falls Reservoir systems and emphasizes efficient water delivery, soil-moisture monitoring, and conservation. That local context helps explain why irrigation matters when interpreting the mapped farm blocks. It does not mean the yellow edge of a land-cover polygon is an irrigation-district boundary, and the map should never be used to infer an individual farm’s water right.
The distinction between cropland and open grass or shrub cover is also important because the county is not simply “agricultural” wherever the ground looks open. Grassland alone accounts for nearly half of the area, and shrubland is more than one-third. On a photo, dry pasture, native grass, rangeland, and harvested fields can sometimes look similar at a glance. The classified map separates those broad surface types, while the simplified view keeps the farm blocks visible without asking the reader to track every minor class.
A 31.38% class difference is not the same as 31.38% confirmed land conversion
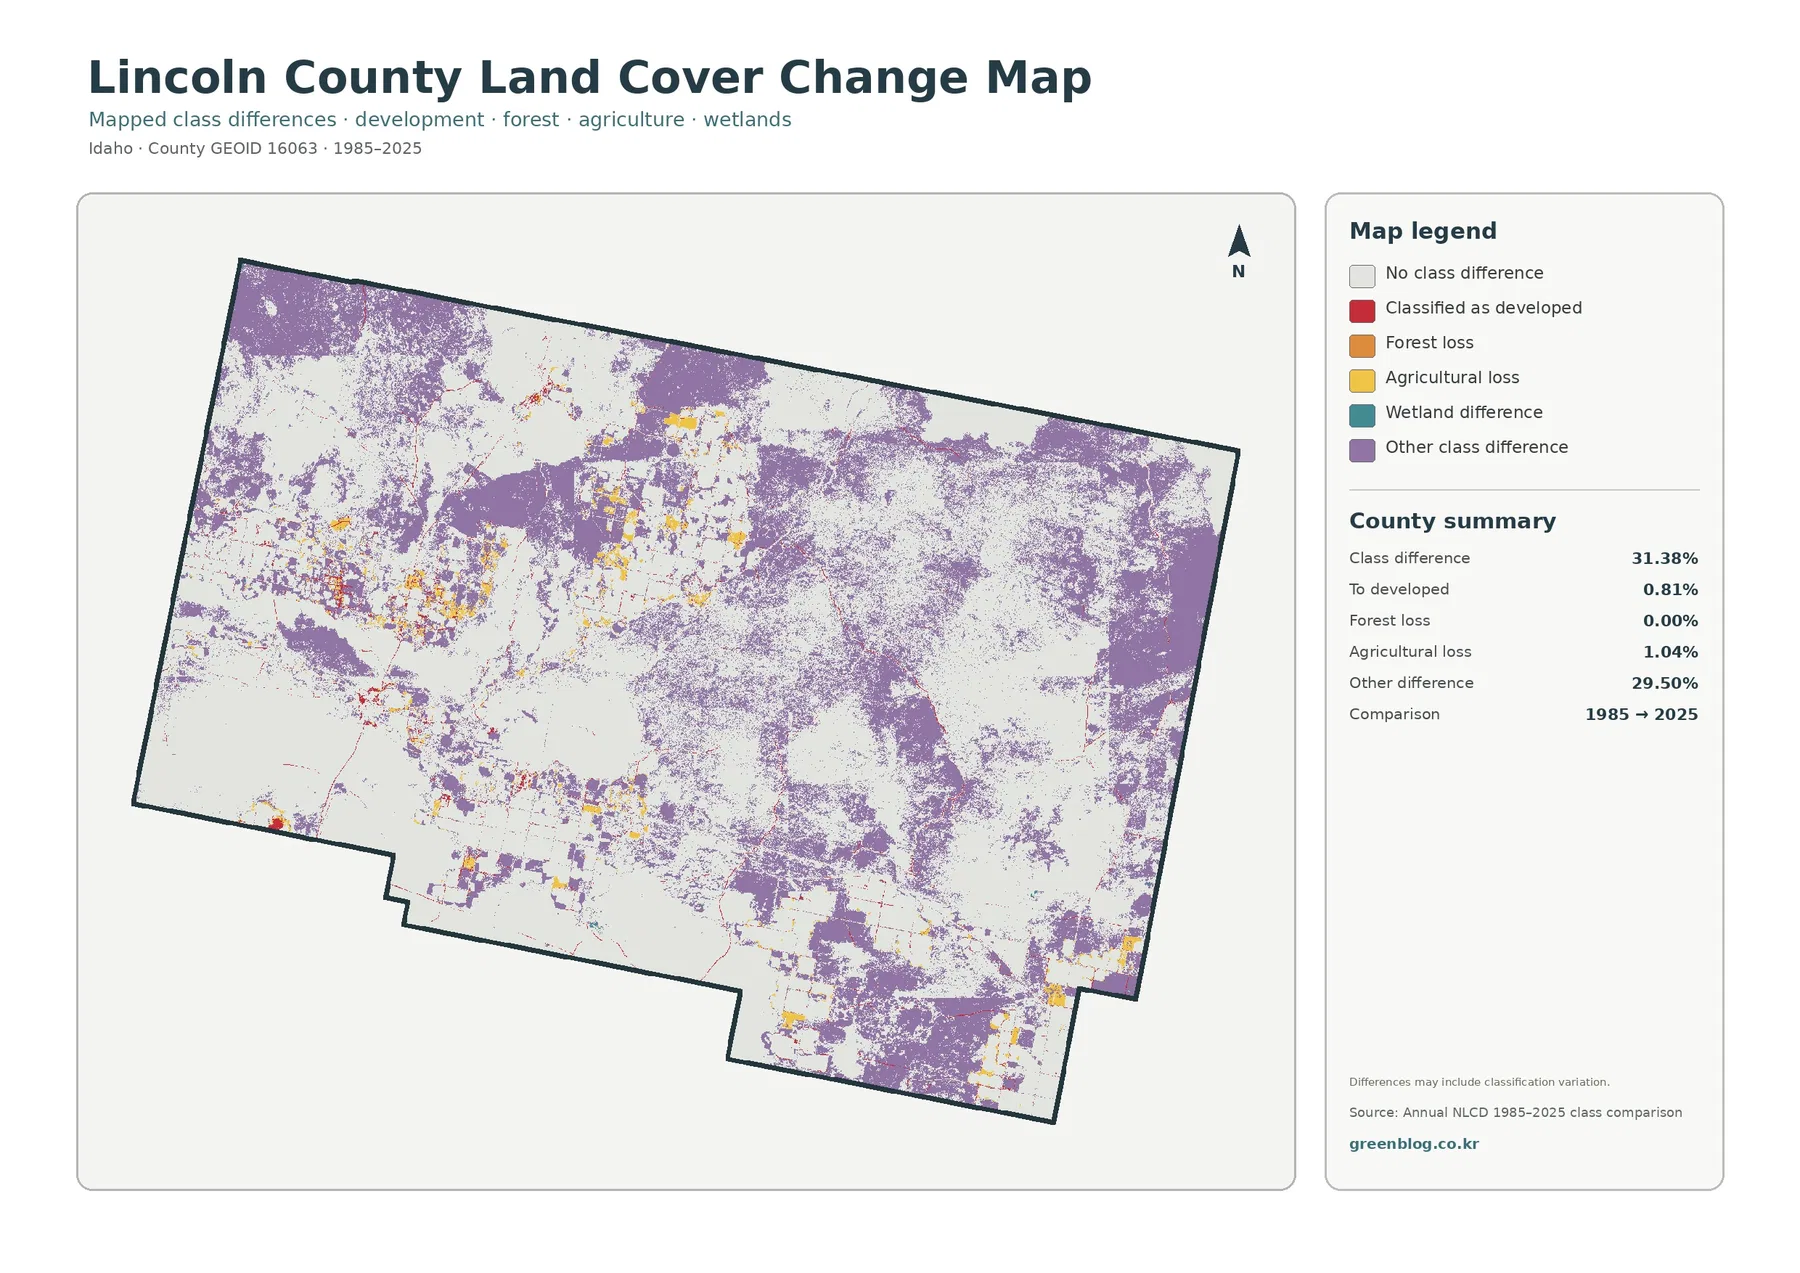
The 1985–2025 comparison map needs more caution than the current-cover maps. Lincoln County has a total mapped class difference of 31.38%, but 29.50% is placed in the broad “other class difference” category. The comparison also reports 0.81% classified as developed, 1.04% agricultural loss, and 0.00% forest loss. Because the map explicitly notes that differences may include classification variation, the total should not be presented as a measured amount of ecological degradation or land conversion.
Purple other-difference cells spread across large portions of the north, east, and parts of the west. Many occur in areas where current grassland and shrubland meet or form mottled patterns. A plausible reading is that some long-term differences involve shifts among open-cover classes, but the endpoint map does not identify a single cause. Changes in classification methods, mixed pixels, vegetation conditions, or real surface changes can all require further checking before a local conclusion is made.
Red developed-difference marks are much more limited and tend to appear around the same settlement and road areas that stand out on the impervious map. Yellow agricultural-loss cells occur in and near several farm blocks but represent only 1.04% in the summary. A field marked in that category should not be described as permanently abandoned without intermediate years. It may have changed more than once between 1985 and 2025, and the two endpoint classes do not provide a history of every year in between.
The Little Wood River is locally important even though water is only 0.02% countywide
Water and wetlands occupy very small percentages in the land-cover summary, so blue and teal features are easy to miss at this scale. That does not make water unimportant to local land use. USDA Natural Resources Conservation Service material describes a Lincoln County farm along the Little Wood River and highlights the riparian area beside the river. University of Idaho Extension likewise treats water availability and irrigation management as major agricultural concerns for the county.
This is a useful example of why area percentage and practical importance are different questions. A narrow river can cover little of a county’s total area while still mattering greatly for agriculture and riparian habitat. Annual NLCD uses 30-meter raster cells, so narrow channels may also be generalized or share cells with surrounding vegetation. The land-cover map is appropriate for comparing the cover around a river corridor, but a hydrography layer is better for tracing the exact channel.
The same principle applies to wetlands at 0.04%. Small wet areas may appear as isolated teal cells or short traces rather than broad polygons. Anyone studying drainage, flood exposure, wetland regulation, or irrigation infrastructure should use the land-cover map as an overview and then move to a source built for that specific purpose. County-scale classification is strongest when it answers landscape questions, not when it is forced into a parcel or engineering role.
A simple comparison order prevents the four legends from being mixed together
Start with the full 2025 map if you need an overall picture. Locate the broad grassland and shrubland areas first, then find the separate farm blocks. Once those anchors are clear, move to the simplified forest-and-farmland view to isolate cropland and pasture from the surrounding open cover. This order works well in Lincoln County because the county is overwhelmingly open, yet agriculture is concentrated enough to form strong local patterns.
For settlement questions, switch to the impervious map rather than trying to infer hard surfaces from the developed class alone. Compare Shoshone, Dietrich, and Richfield with nearby agricultural and open land, and remember that the countywide mean of 0.55% does not describe every town cell. A small town center can have much higher local values while the vast surrounding county keeps the average low.
Use the change map last. Its colors describe differences between two classifications, not the present land-cover class. A purple cell on the change map should be located again on the 2025 map before it is discussed, and any claim about cause should be checked against intermediate Annual NLCD years or local evidence. For a presentation or printed reference, keeping the legends and dates beside each map prevents a color in one view from being assigned the meaning it has in another.
Read the maps at county scale, not as parcel surveys
Annual NLCD is a raster dataset. In practical terms, the landscape is divided into grid cells and each cell receives a representative land-cover class or an impervious percentage. At about 30-meter resolution, a field edge, narrow road, small building, tree row, and nearby grass can all influence a small area. The colored boundary on the map is therefore a generalized classification boundary, not a surveyed property line.
The observation year matters as well. The current maps use 2025 data, so later construction, crop changes, vegetation recovery, or other events may not appear. The change map compares 1985 and 2025 and does not describe the timing of every change between those endpoints. This limitation is especially important in Lincoln County because the large 29.50% other-difference category requires more investigation before it is turned into a statement about real-world change.
Use the four maps for landscape-scale comparison: open rangeland versus farm blocks, small developed centers versus low-impervious surroundings, or current cover versus locations with mapped class differences. For parcel ownership, zoning, irrigation rights, engineering work, or regulatory wetland decisions, consult current county records and the relevant state or federal source. Matching the map to the question is the best way to avoid giving a useful county overview more precision than it actually has.
Frequently Asked Questions
What is the dominant 2025 land cover in Lincoln County, Idaho?
Grassland is the largest class at 47.89%, followed by shrubland at 36.93%. Together they account for more than 84% of the county, while agriculture occupies 12.65% in several concentrated blocks.
Why is forest listed as 0.00% on the Lincoln County map?
The 0.00% value is the displayed countywide share assigned to the forest class in the 2025 Annual NLCD summary. It does not mean that every individual tree is absent. Small woody areas or riparian vegetation can be mixed with other cover inside 30-meter cells.
Does the 31.38% change value mean one-third of Lincoln County was definitely converted to a new land use?
No. The 31.38% figure is a class difference between 1985 and 2025, and 29.50% falls in the broad other-difference category. The map also warns that classification variation may be included, so causes need to be checked with intermediate years and local evidence.
Map File Information
The four original Lincoln County land-cover maps are provided together in one ZIP file.
- Included Versions: land cover, forest and farmland, impervious surface and developed land, land-cover change
- File Type: ZIP containing four JPG files
Related Maps
Sources and References
- MRLC – Annual NLCD Data (official Annual NLCD data access for current land cover and long-term comparison)
- U.S. Geological Survey – Annual NLCD Land Cover Classification (official class definitions and information on the 30-meter raster product)
- University of Idaho Extension – Agriculture in Lincoln County (local information on irrigation, water management, crops, and livestock)
- USDA NRCS – Profiles in Soil Health: The Brossy Family (Lincoln County agricultural and riparian context along the Little Wood River)
- U.S. Census Bureau – Idaho Geographic Areas Reference Map (Lincoln County boundary and the locations of Shoshone, Dietrich, and Richfield)
Green Map creates custom-edited map images using open geographic data sources such as geoBoundaries, Natural Earth, OpenStreetMap, and government open data.
These maps are edited visual materials, not raw data files, and are provided for education, documents, presentations, and graphic reference.