Grassland is the defining land-cover class in Gem County in the supplied 2025 map set, accounting for 59.24% of the county. The southwest stands out for concentrated agriculture and developed land, while the northeast contains the largest forest blocks. Shrubland fills much of the space between those contrasting areas.
The four views on this page separate overall land cover, forest and farmland, impervious surfaces, and class differences from 1985 to 2025. The four original JPG maps are also available together in one ZIP for printing, county comparison, classroom work, and presentation reference.
Table of Contents
Southwest Gem County concentrates the farm and built classes that are sparse elsewhere
The southwest is the first place to examine if the goal is to understand where Gem County’s smaller land-cover classes are concentrated. Agriculture totals 12.55% countywide, but the yellow farm areas form broad blocks in the southwest instead of appearing evenly across the full county. Developed cover, which totals 5.08%, is also most noticeable in the same general part of the map.
That concentration makes the southwest visually different from the long northern section of the county. Roads and developed pixels become thinner and more scattered as the map extends northward. Farm colors also decline, leaving much larger areas of grassland and shrubland. The pattern is useful for describing where human land uses are concentrated without implying that one mapped class caused another.
Gem County’s 2023 comprehensive plan identifies the Payette River, Black Canyon Reservoir, irrigation canals, agricultural and ranching lands, and surrounding natural areas as resources that residents and planners value. It also discusses continued support for agriculture and protection of water resources. That official context helps explain why farm, water, and development patterns in the south deserve to be read together, although the map alone cannot identify the irrigation source or history of an individual field.
The 2025 overview is dominated by grassland, with clear regional contrasts
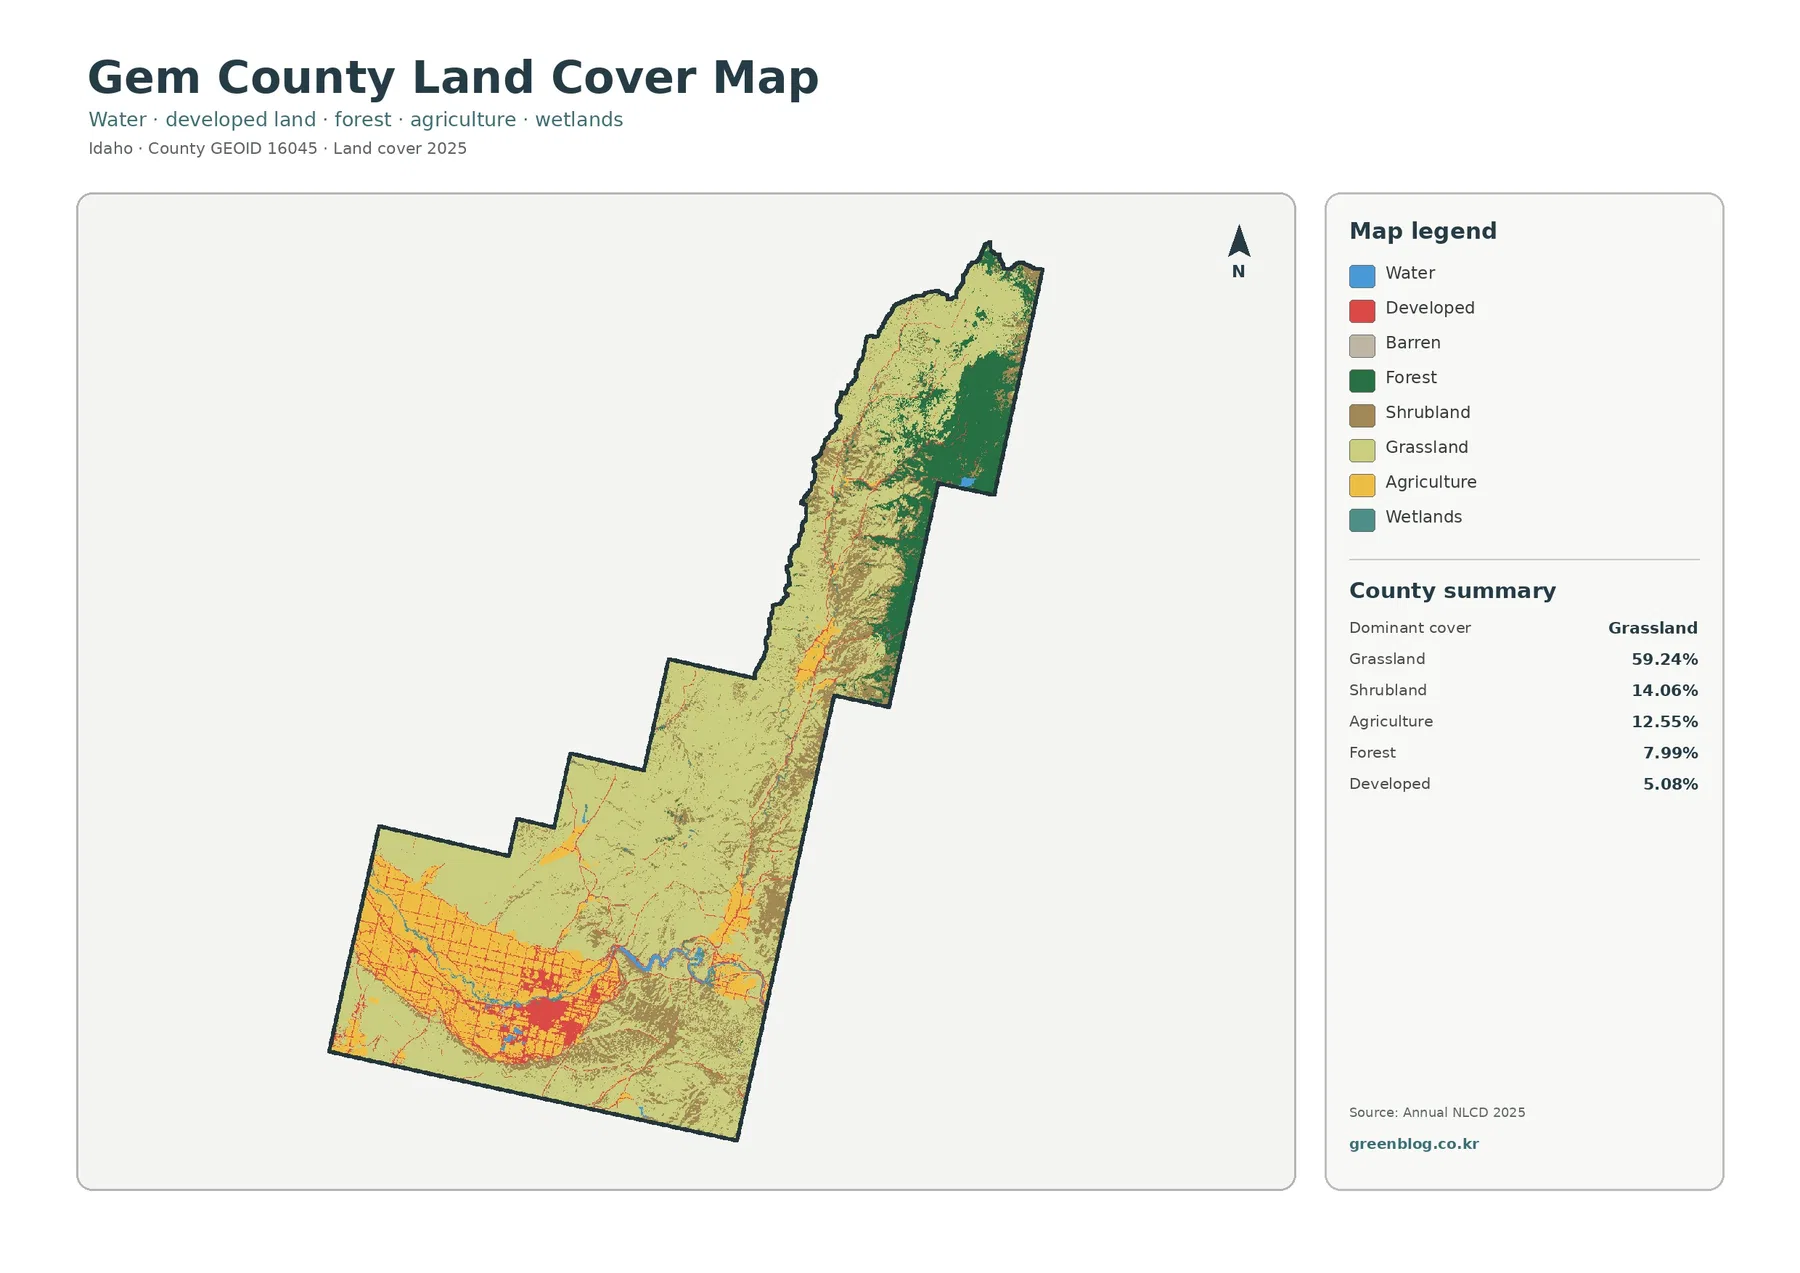
Grassland covers 59.24%, far more than any other single class. It occupies broad areas through the central and northern portions of the county and remains important around the edges of the southern agricultural zone. Because it is so widespread, grassland serves as the main reference for seeing where other classes become concentrated or disappear.
Shrubland ranks second at 14.06%. Brown shrub cover is mixed through the central and northern landscape, sometimes forming sizeable patches and sometimes appearing between grassland and forest. Grassland and shrubland both represent relatively open vegetation, but separating them reveals changes in plant cover that would be lost if all open land were grouped together.
Forest makes up 7.99% and is strongly concentrated toward the northeast and eastern edge. Dark green areas there are much larger and more continuous than the small forest patches farther south. The forest share is therefore modest in countywide percentage terms but geographically important because it is concentrated in a distinct part of Gem County.
Water accounts for 0.57% and wetlands 0.49%. Blue and teal areas are small compared with the open uplands, but they are easier to notice in the southern river and reservoir area. Gem County’s comprehensive plan specifically identifies the Payette River, Black Canyon Reservoir, Butte Creek, and other waterways as important natural resources, giving those small mapped classes additional local context.
The long central and northern section shifts from open cover toward forest in the northeast
Moving north from the developed southwest, the map becomes much less dominated by agriculture and built surfaces. Grassland remains extensive, while shrubland appears in larger patches along the interior. This open cover continues for a long distance before the eastern side of the far north becomes noticeably greener with forest.
The transition is not a simple straight line. Small forest patches occur within the northern open land, and grassland or shrubland continues between larger forest areas. The irregular edges are important because they show a mixed landscape rather than a county divided into two clean zones. At 30-meter resolution, however, those boundaries should still be treated as generalized rather than surveyed lines.
This north-south contrast gives the general map a practical role in county comparison. A neighboring county may have a similar total forest percentage but a completely different distribution. For Gem County, the location of the forest matters as much as the 7.99% figure because most of the large green blocks occupy one end of a long, narrow county shape.
Forest and farmland become easier to compare when the broad open classes are simplified
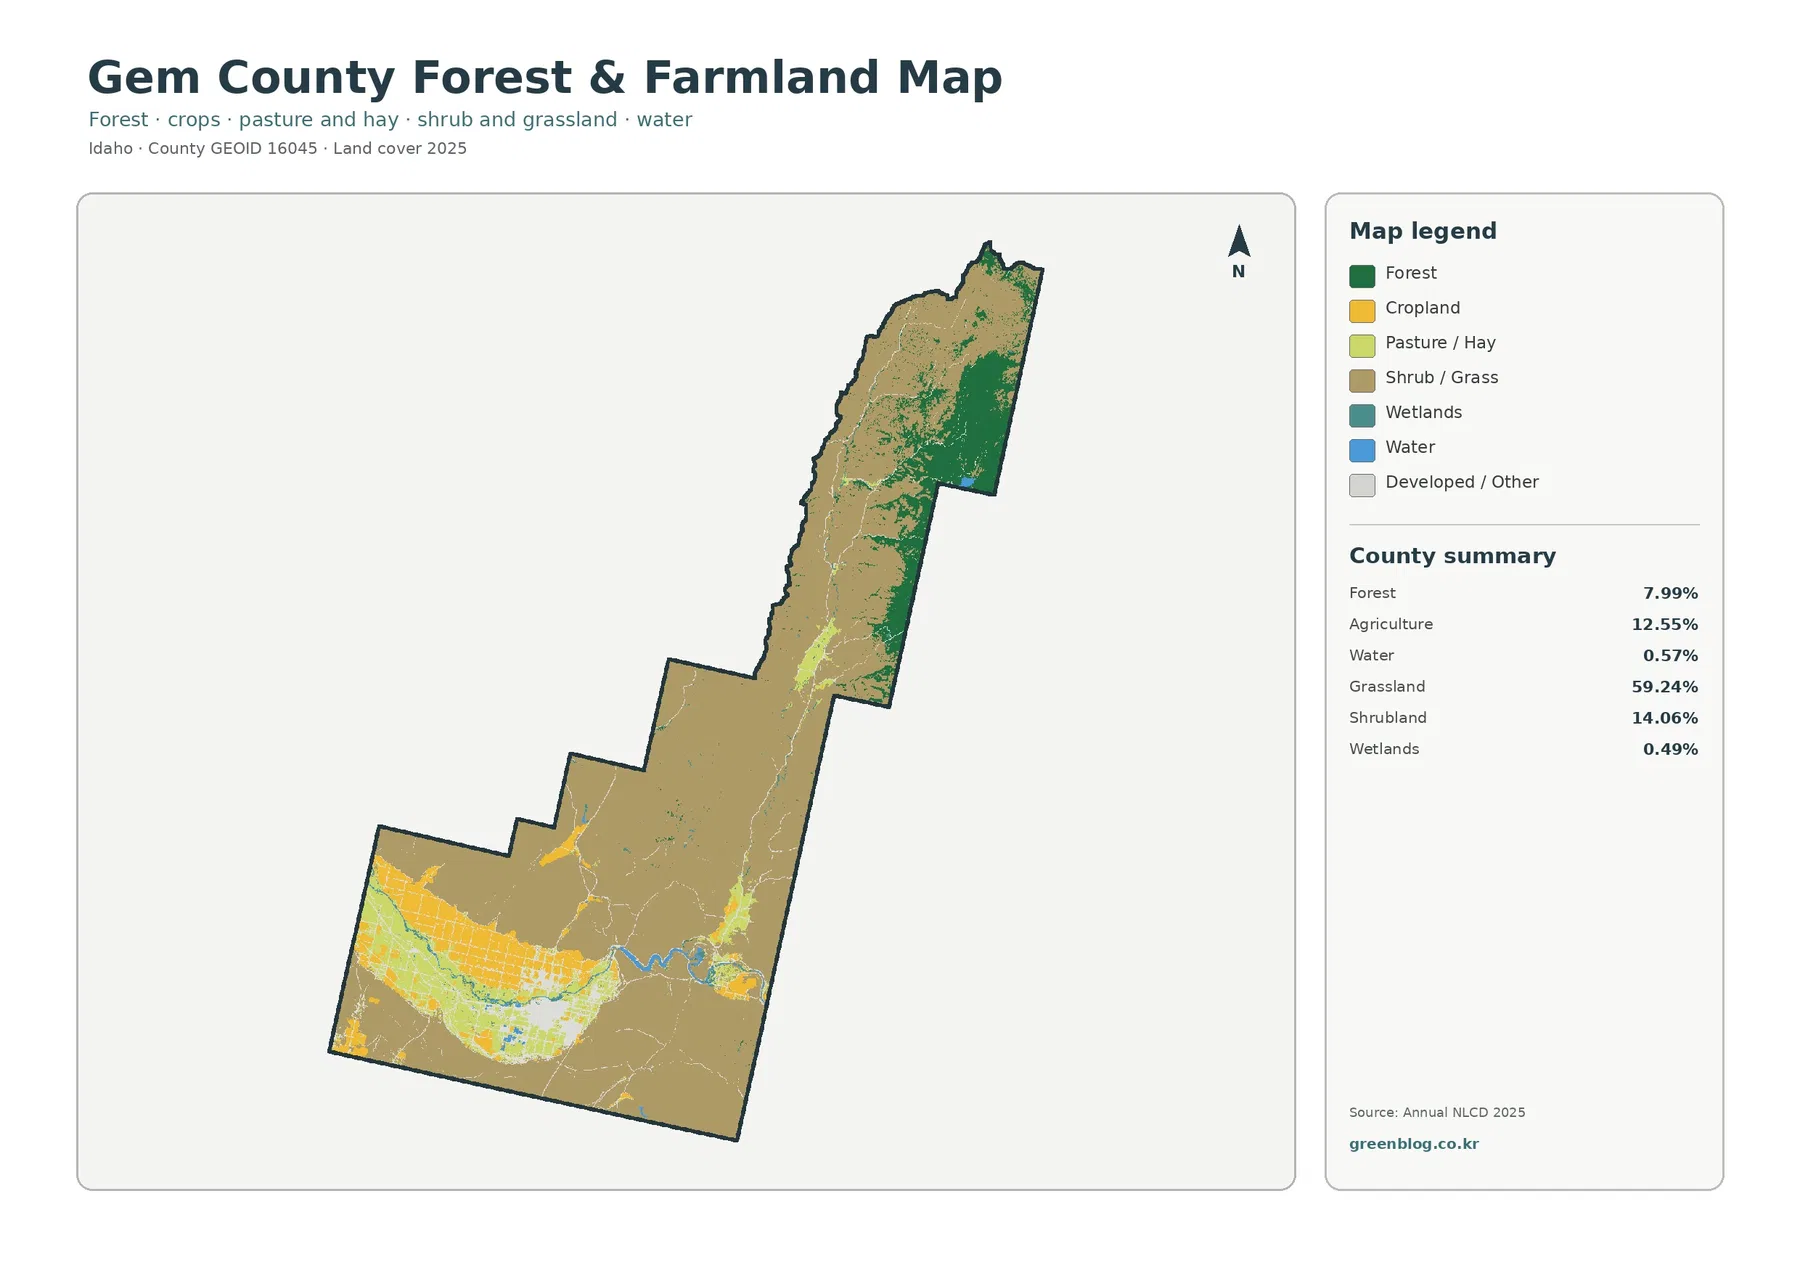
On this view, cropland forms a broad yellow concentration in the southwest, while pasture and hay add lighter agricultural areas around it. Smaller farm strips extend eastward and northward along a few corridors, but they do not dominate the long northern half of the county. Keeping cropland separate from pasture and hay makes the agricultural landscape more informative than a single combined percentage.
University of Idaho Extension in Gem and Boise counties provides programs on small acreage farming, farm financial management, livestock production, soil, water quality, weeds, pasture establishment, and grazing management. Those topics confirm that farming and ranching are active parts of the local land-management context. The map does not identify the crop or ownership of a specific parcel, so Extension information should be used as background rather than as a pixel-by-pixel explanation.
Forest, by contrast, is concentrated mainly in the northeast. The simplified legend makes that separation especially clear because much of the intervening county is grouped into shrub and grass. For a presentation about the contrast between the farmed southwest and forested northeast, this map communicates the pattern more directly than the full land-cover legend.
Wetlands and water remain small but useful reference features in the south. They can help orient the farm blocks around the river and reservoir area. Their mapped boundaries are not regulatory wetland determinations, however, and the land-cover product should not replace official water, flood, or wetland maps for site-specific decisions.
Impervious cover is low countywide but sharply concentrated in the southwest
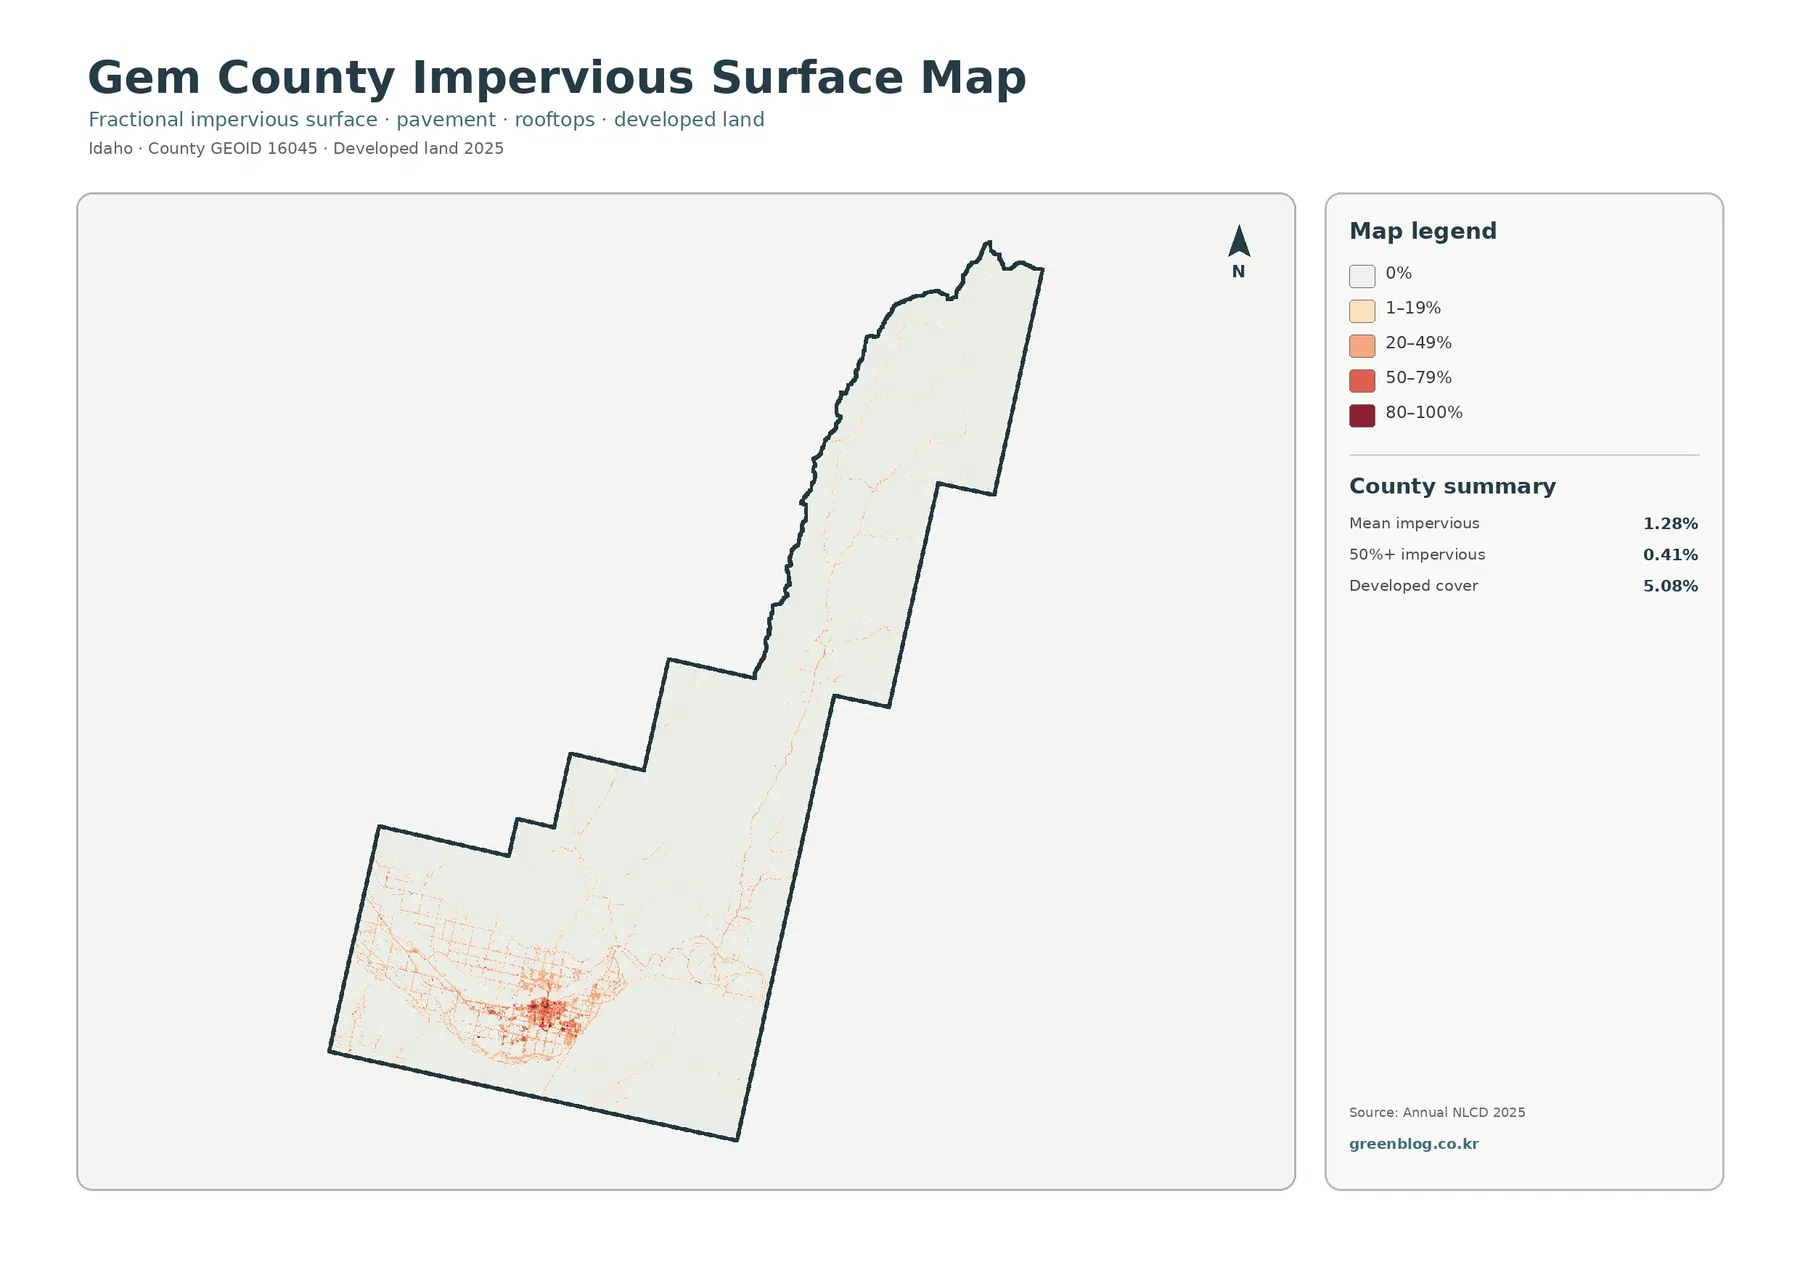
Impervious surface means pavement, rooftops, parking areas, and similar surfaces that water does not readily soak through. The countywide mean is 1.28%, and cells with at least 50% impervious cover account for 0.41% of the county. Those values are low, but the southwest cluster contains much higher local concentrations than the rest of the map.
Roads form thin orange lines across the southern section, and a dense red cluster marks the principal developed area in the southwest. Farther north, impervious traces become much thinner and more widely spaced. The pattern makes it clear that Gem County’s built footprint is not evenly distributed even though developed land totals 5.08%.
Developed cover and impervious cover should not be treated as the same measurement. A developed cell may contain lawns, bare soil, trees, or other permeable surfaces together with buildings and pavement. That is why the 5.08% developed share can coexist with a much lower 1.28% average impervious value.
The map is useful for comparing settlement intensity, road corridors, and open rural areas, but it is not detailed enough to measure a road width or building footprint. A narrow road or a small structure can occupy only part of a 30-meter cell. Parcel review or engineering work therefore requires higher-resolution imagery and authoritative local data.
Small water and wetland percentages still matter in the southern agricultural landscape
Water and wetlands together occupy little of Gem County’s total area, yet their location makes them important for interpretation. The Payette River and Black Canyon Reservoir are specifically named in the county comprehensive plan, and both sit within the broader southern landscape where agriculture and development are much more visible than in the north.
Readers studying watershed or agricultural context can compare the blue and teal features with nearby cropland and pasture. That comparison can show where different land-cover classes occur next to the same water corridor. It cannot show water rights, irrigation delivery, flood risk, or legal wetland boundaries, because those questions require different datasets.
The county plan also emphasizes protection of waterways, riparian areas, water quality, and agricultural resources. For an educational project, pairing the land-cover map with that planning document helps explain why even a 0.57% water share can matter locally. The map supplies the spatial pattern, while the plan supplies the policy and resource-management context.
A 20.94% class difference highlights locations for follow-up rather than a single conversion rate
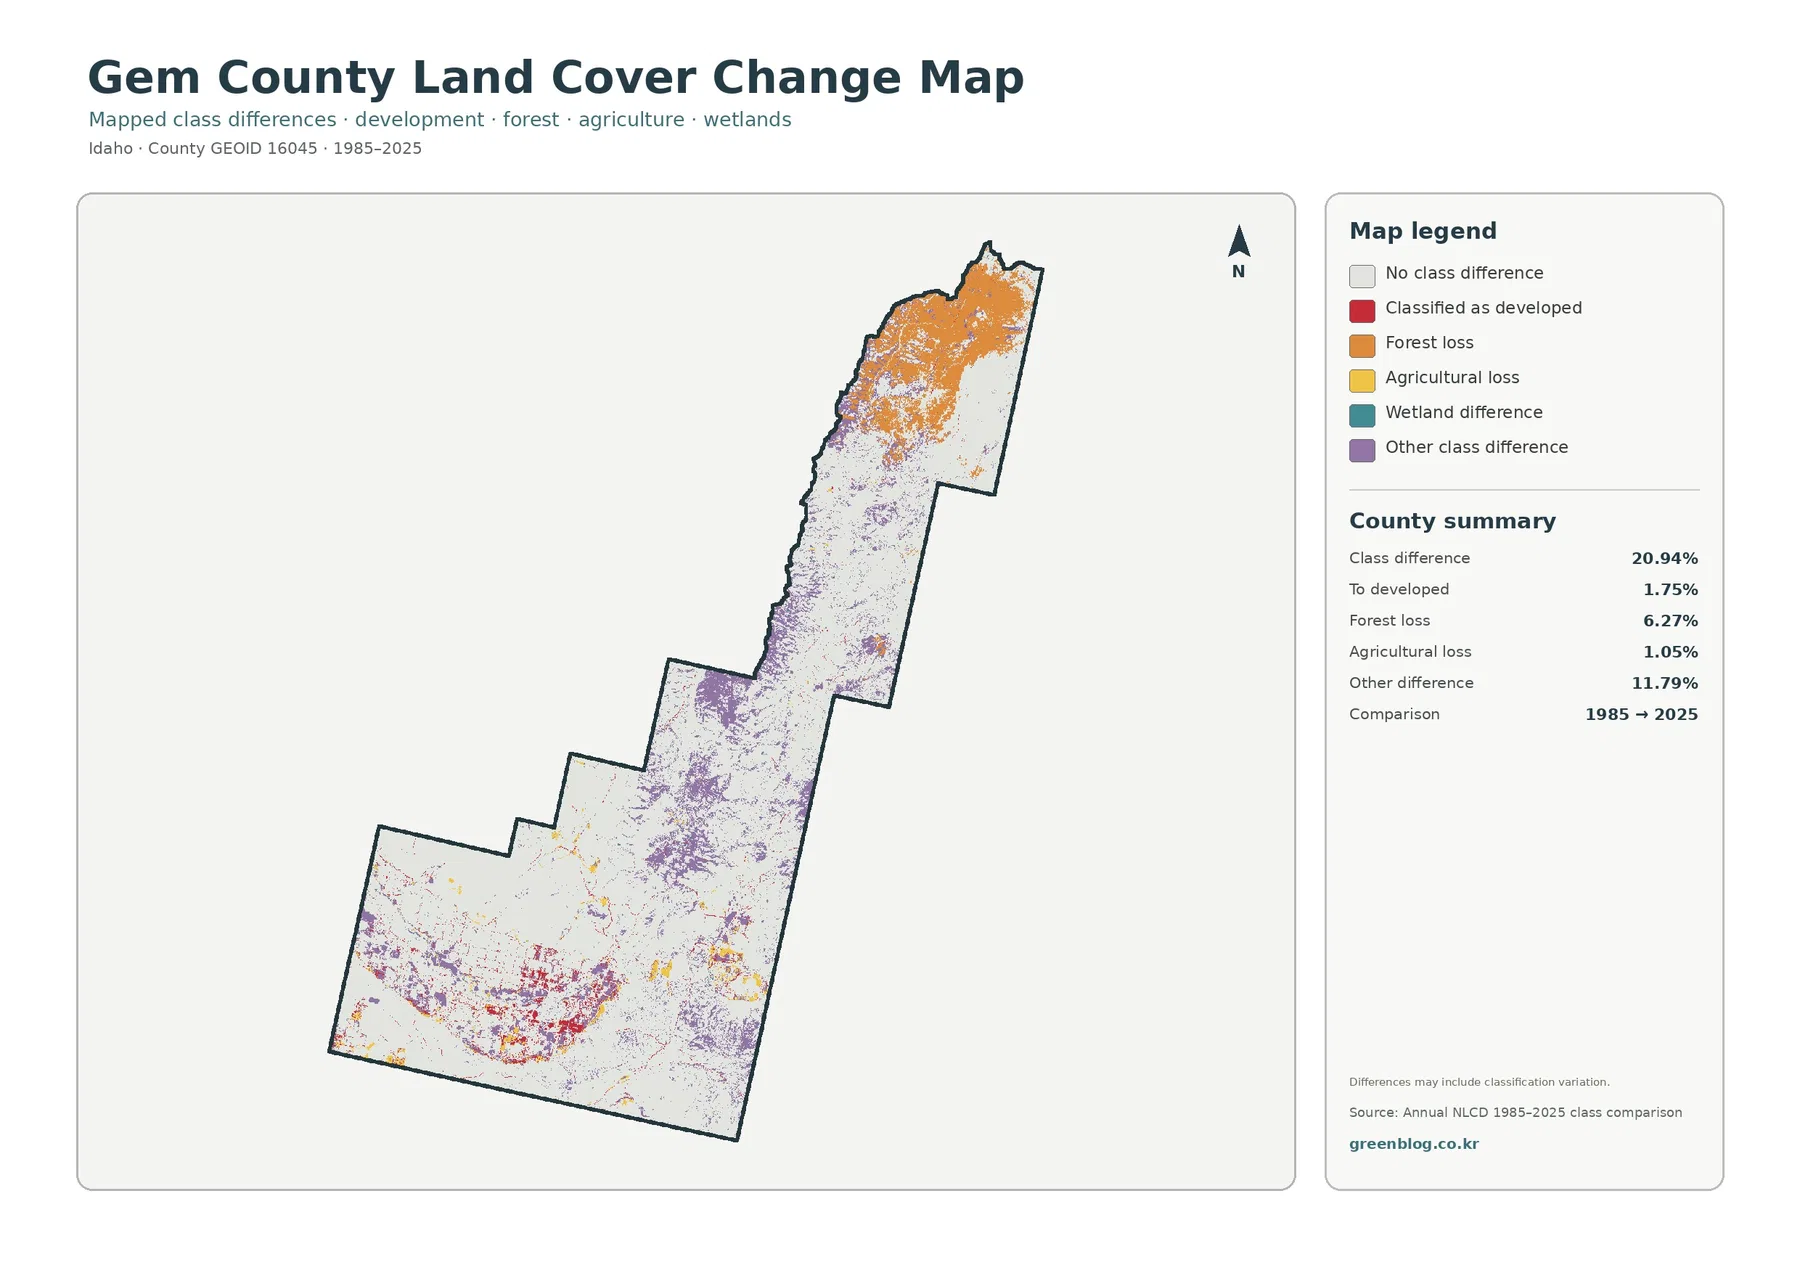
The change map reports that 20.94% of mapped cells fall into a different comparison category between 1985 and 2025. White areas show no broad class difference, while red, orange, yellow, teal, and purple identify different comparison outcomes. The north contains a large concentration of orange forest-loss-category cells, while purple other-difference cells are widespread through the center and parts of the south.
The summary separates 1.75% classified to developed, 6.27% in the forest-loss category, 1.05% agricultural loss, and 11.79% other class difference. These are mapped class-comparison categories, not verified permanent conversion rates. The figure itself warns that differences may include classification variation.
Several factors can affect a long comparison: sensor and method changes, mixed pixels, vegetation condition, disturbance and recovery, or a shift in how a boundary cell is assigned. A forest cell can move to another class after disturbance and later recover, while open vegetation classes can also switch classification without a permanent land-use change.
Red developed-category differences are most visible around the southwest developed area, but the map cannot identify the project, year, or cause behind an individual red patch. The best use is to identify places for closer review with intermediate Annual NLCD years, aerial photography, county planning records, or other appropriate local sources.
Use each map for a different question instead of treating the set as four versions of the same picture
The general land-cover map is the strongest first choice for a county overview. It shows the 59.24% grassland majority, the agricultural and developed southwest, the forested northeast, and the smaller water and wetland classes in one frame. It also works well for same-year comparisons with another county.
The forest-and-farmland map is more useful when the subject is agriculture, pasture, ranching context, or the boundary between open vegetation and forest. The impervious map answers a different question by isolating the built surface pattern. A road or settlement that barely registers on the general map can become much easier to see there.
The change map is best saved for a time-comparison question. It does not replace the 2025 map because it shows differences between two classifications rather than the current cover itself. Using the four views in that order keeps an explanation clear: current pattern first, focused land-cover relationships second, built intensity third, and long-term class comparison last.
The maps generalize 30-meter cells and do not replace parcels, zoning, or ownership data
Annual NLCD is a raster product, meaning the landscape is divided into grid cells and each cell receives a representative land-cover class. The land-cover product uses 30-meter resolution. A field edge, narrow road, stream bank, tree line, and nearby building can therefore occupy the same cell even though the final map displays one class.
Mixed pixels are especially relevant in the southwest, where farms, roads, homes, water features, and small open spaces occur close together. A simplified cell boundary may look crisp on the map even when the real ground changes gradually. That is useful for county-scale comparison but not for surveying an individual property.
Land cover is also different from legal land use. A yellow agricultural cell does not prove that a parcel is zoned or permanently protected for agriculture, and a green forest cell does not identify ownership. Gem County’s planning, zoning, parcel, and property records are the appropriate sources for those administrative questions.
The 2025 map reflects the classification year shown in the package. Development, fire, vegetation recovery, farming changes, or water conditions after that observation are not part of the map. Recent site-specific work should therefore be checked against newer imagery or records rather than relying on the county map alone.
A practical way to use the set for printing, planning context, or environmental education
For a printed county profile, begin with the general land-cover map and its main percentages. Readers can quickly see that grassland dominates while farm and developed classes are concentrated in the southwest and forest is concentrated in the northeast. A second page can then use the forest-and-farmland view to focus on the agricultural landscape without repeating every class.
For planning context, the impervious map can be placed beside the county comprehensive plan. The map shows where built surfaces are concentrated, while the plan explains county goals related to agriculture, water, natural resources, and development. Keeping those roles separate prevents a descriptive land-cover product from being mistaken for a regulatory map.
For environmental education, compare water and wetlands with nearby agriculture, then move north to the grassland-shrubland landscape and the northeast forest. The county’s unusual long shape makes that progression easy to follow visually. A class-difference map can be added last to introduce the idea that landscape classifications can change over decades without every difference representing the same cause.
County-to-county comparison works best when both maps use the same year and product. Comparing Gem County’s 2025 general map with another 2025 general map gives a meaningful contrast in percentages and distribution. Comparing it directly with another county’s change map would mix current land cover with a time-difference product and can produce misleading conclusions.
Frequently Asked Questions
What is the largest land-cover class in Gem County?
Grassland is the largest class in the supplied 2025 summary at 59.24%. Shrubland follows at 14.06%, agriculture at 12.55%, forest at 7.99%, and developed land at 5.08%. The distribution is not uniform: agriculture and development are strongest in the southwest, while the largest forest blocks are in the northeast.
Why does the southwest look much more developed and agricultural than the rest of the county?
The maps support the observation that farm, developed, and impervious classes are concentrated there, but they do not establish a single cause. Gem County’s comprehensive plan provides useful context by discussing the Payette River, Black Canyon Reservoir, irrigation canals, agricultural lands, and development considerations. Site-specific history or causation requires additional local records.
Does the 20.94% class difference equal the amount of land permanently converted since 1985?
No. The comparison identifies cells that fall into different mapped categories between 1985 and 2025, and the figure warns that classification variation may be included. Determining whether a change was permanent and what caused it requires intermediate annual data and relevant local, fire, forest, or development records.
Map File Information
The four original JPG maps for Gem County are provided together in one ZIP file.
- Intended Use: printing, county comparison, classroom and presentation reference
Related Maps
Sources and references
- MRLC Annual NLCD Data – annual land-cover and impervious products used for the map set
- USGS Annual NLCD Land Cover Classification – land-cover classes and 30-meter raster interpretation
- Gem County 2023 Comprehensive Plan – Payette River, Black Canyon Reservoir, agriculture, water, and natural-resource planning context
- University of Idaho Extension – Agriculture in Gem and Boise Counties – small-acreage farming, livestock, soil, water, pasture, and grazing programs
- U.S. Census Bureau TIGER/Line Shapefiles – county boundary reference
Green Map creates custom-edited map images using open geographic data sources such as geoBoundaries, Natural Earth, OpenStreetMap, and government open data.
These maps are edited visual materials, not raw data files, and are provided for education, documents, presentations, and graphic reference.