The supplied 2025 data makes Canyon County unusual among the Idaho counties in this series: agriculture remains the largest land-cover class at 61.53%, yet developed land already accounts for 24.91%. A broad farm grid covers most of the county while the Nampa–Caldwell area forms a large built concentration in the center and east. Lake Lowell creates a prominent blue break south of that urban core, and the Snake River and Boise River corridors add narrower water and wetland features. The Canyon County Idaho Land Cover Map is therefore best understood as a farm-and-city landscape rather than a predominantly wild one.
The page includes four views: 2025 land cover, forest and farmland, impervious surface with developed land, and a 1985–2025 class-difference layer. The four original 2480 × 1754-pixel JPGs are available together in one ZIP below. Comparing the same location across the set is especially helpful around Nampa, Caldwell, Lake Lowell, and the western farm belt, where present cover, hard surfaces, and long-term change tell different parts of the story.
Table of Contents
Agriculture still covers most of the county, even with a large urban footprint
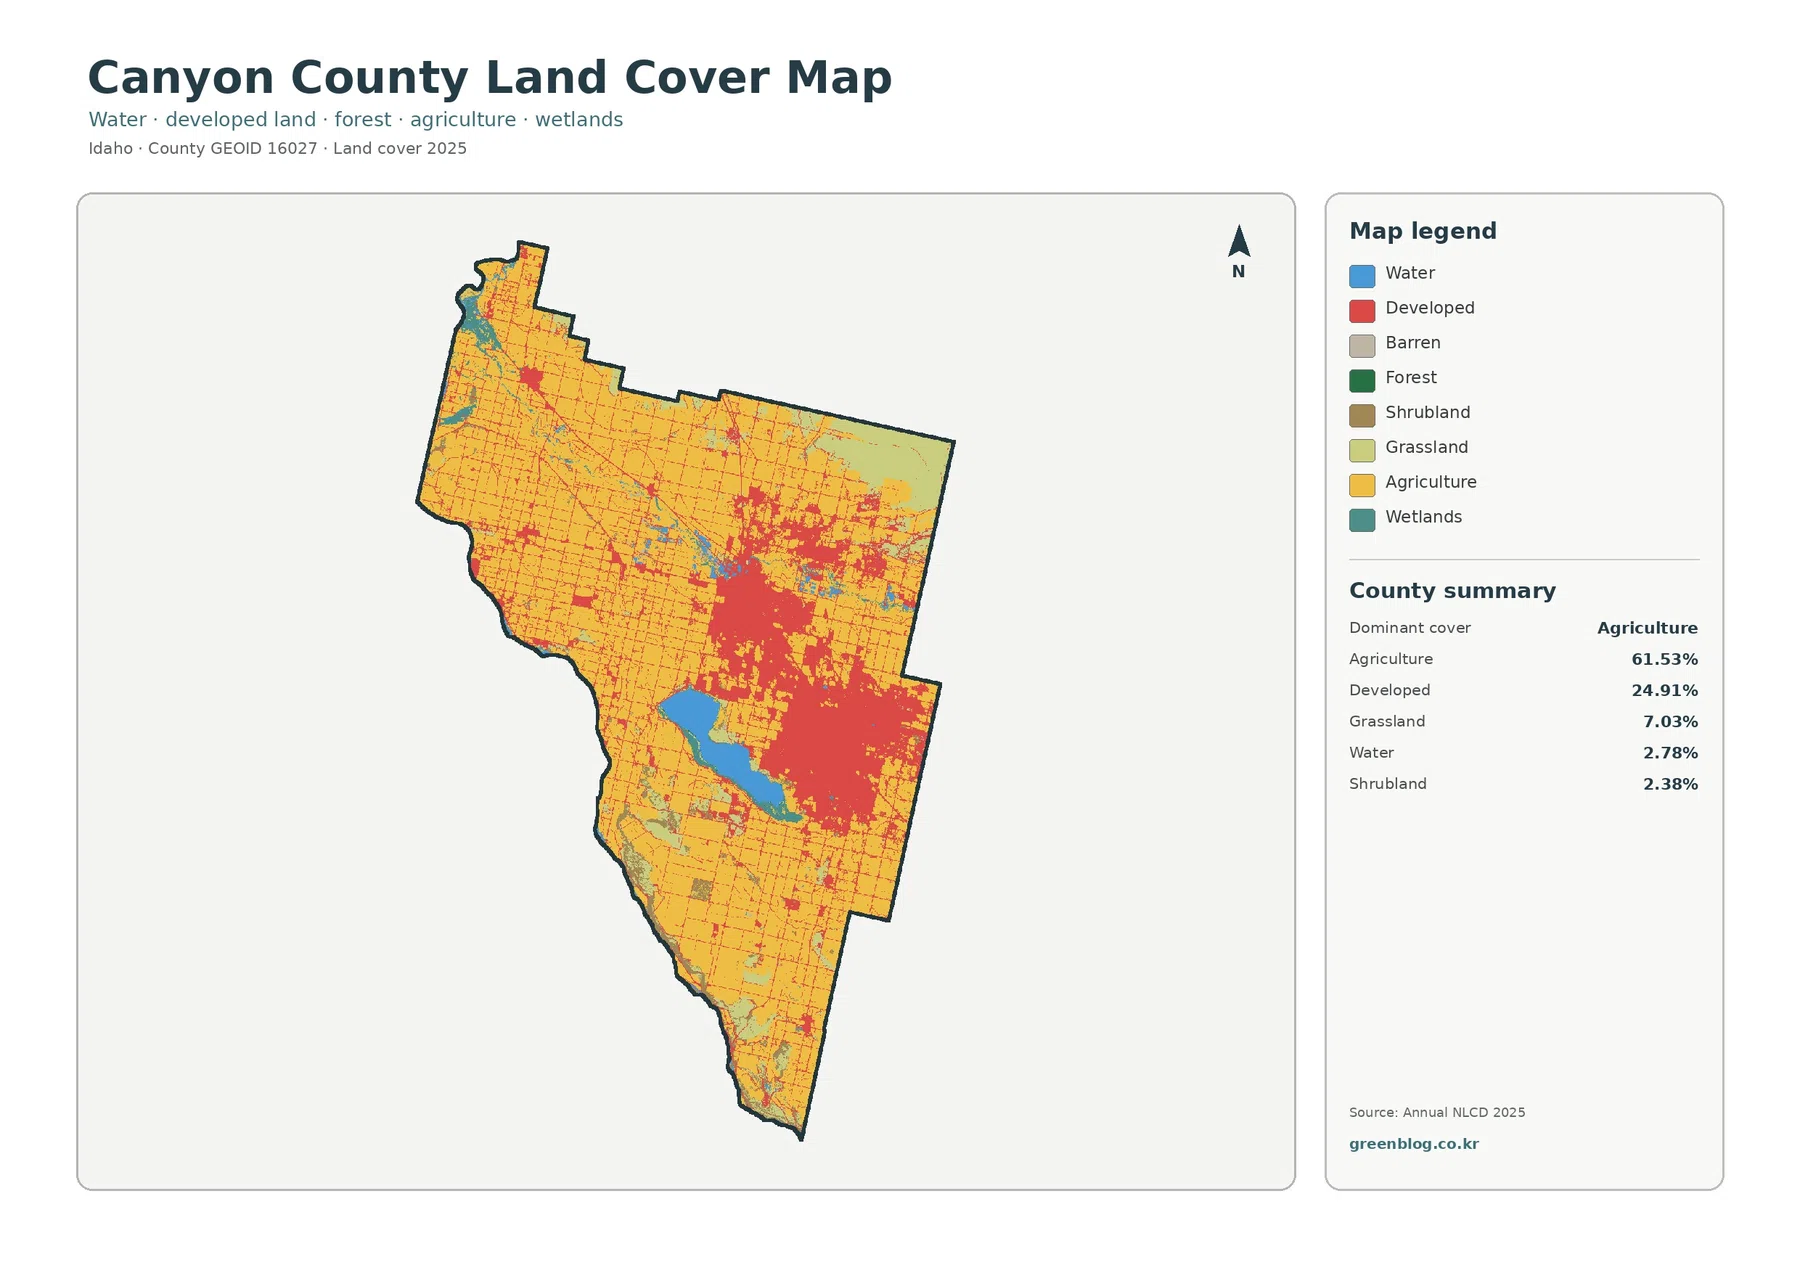
Yellow agricultural cover fills much of western, northern, and southern Canyon County. Its rectangular pattern is visible even at county scale, reflecting broad areas where cropland and related agricultural classes dominate the 30-meter cells. The farm grid continues between towns and around the outer edge of the main urban area. Agriculture is not merely the largest category by a small margin; at 61.53%, it forms the basic background against which nearly every other class appears.
Developed land is the clear second-place class at 24.91%. The largest red mass sits in the central and eastern part of the county, corresponding broadly to the Nampa and Caldwell urban area. Smaller red centers appear farther north and west, and thin red lines spread through the agricultural matrix. Those lines and clusters show how roads, housing, commercial surfaces, and other developed cover are woven into a county that still retains a strong agricultural majority.
Lake Lowell separates dense development from a broad agricultural south and west
Lake Lowell is the most conspicuous water body in the land-cover image. It sits just south of the main urban concentration and is surrounded by a mix of farmland, wetlands, and developed surfaces. The lake makes a useful reference point when comparing layers because its shape remains easy to recognize even after the vegetation colors disappear on the impervious-surface view. North and east of the lake, developed cover becomes much denser; west and south, the agricultural grid takes over again.
Canyon County’s official Parks, Pathways & Cultural Resources Plan identifies the Snake River corridor, the Boise River corridor, and the Lake Lowell Unit of Deer Flat National Wildlife Refuge as major natural and recreational assets. That county guidance helps explain why relatively small water and wetland percentages deserve attention. Their importance comes from where they sit inside a heavily farmed and increasingly developed county, not from occupying a large share of the total area.
The forest-and-farmland view turns the county into a study of working land and settlement
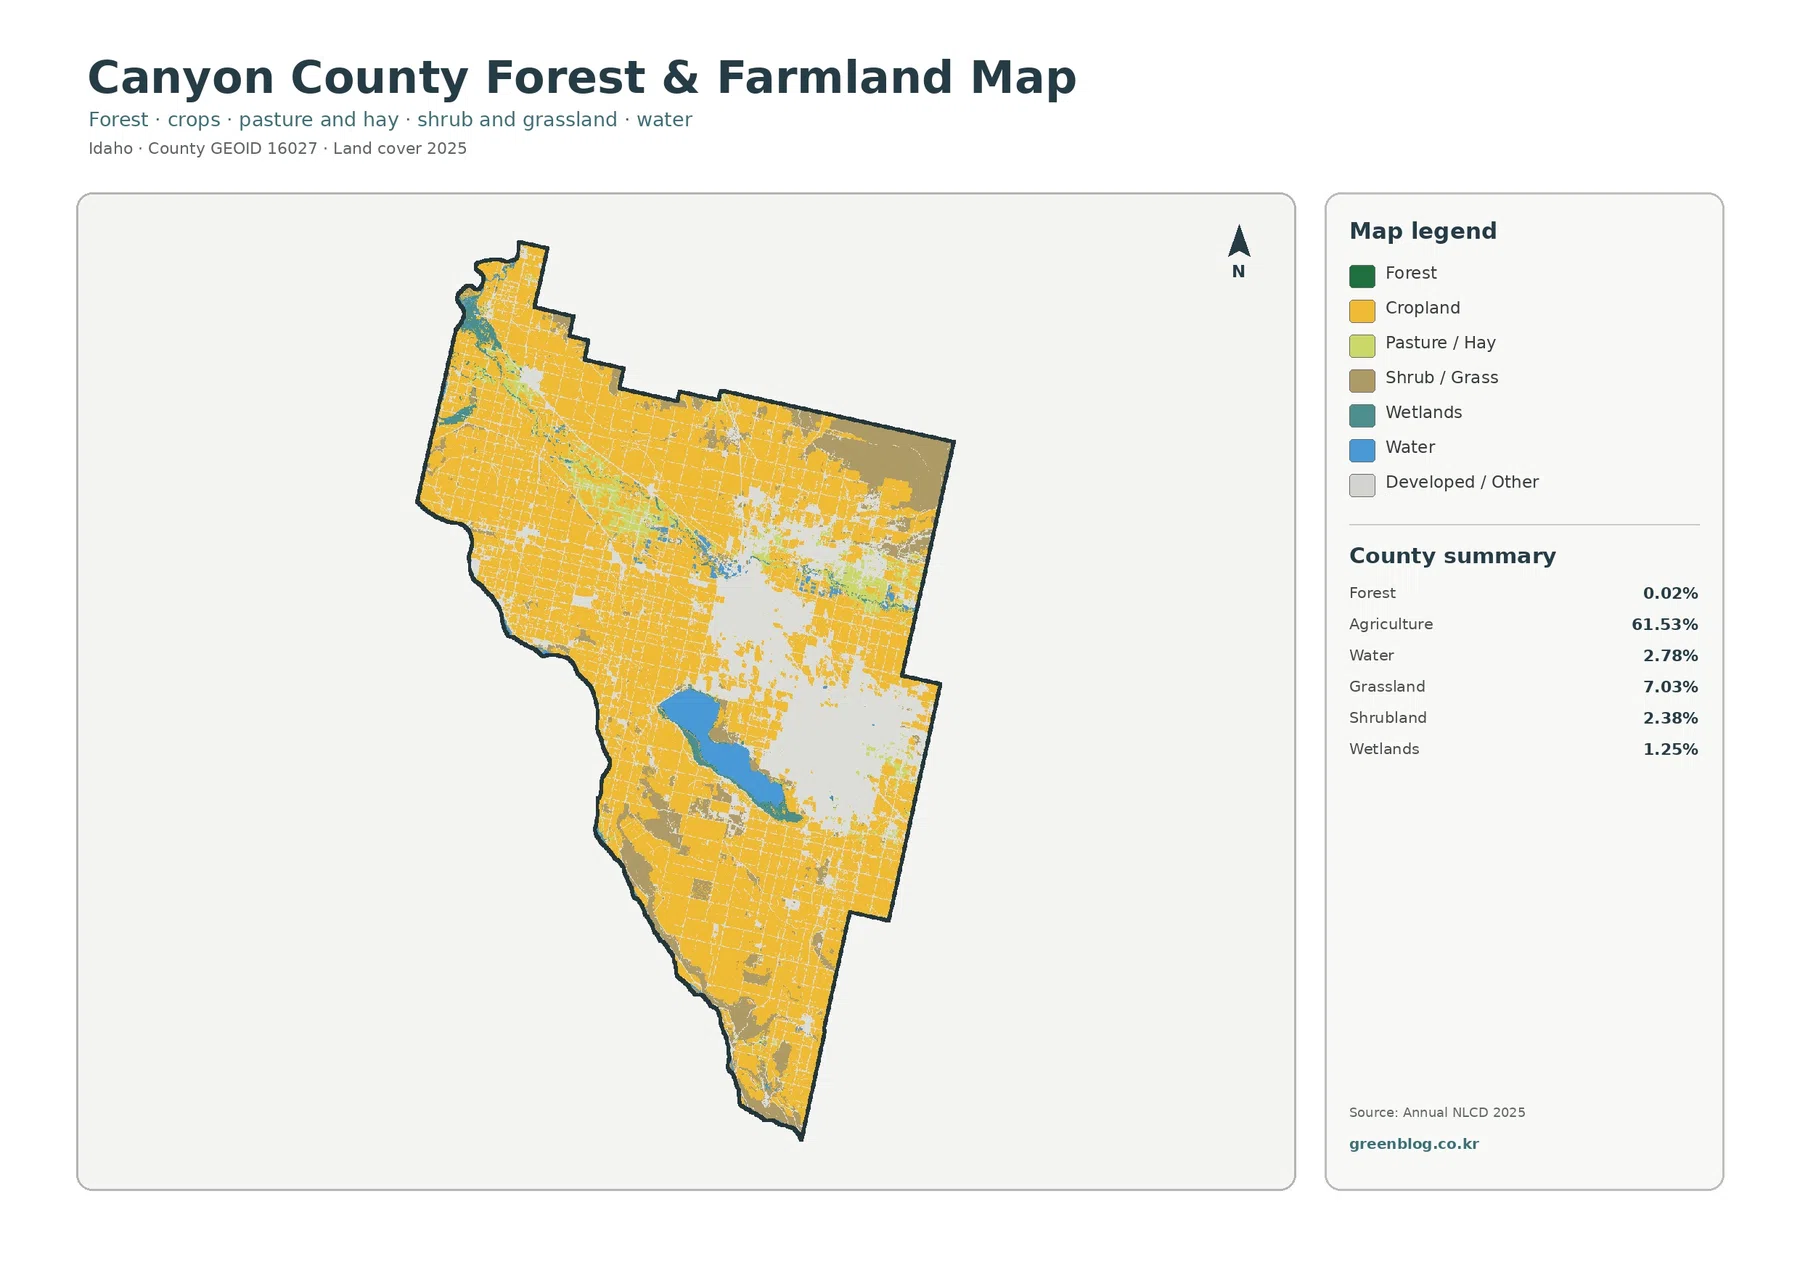
On the simplified vegetation layer, forest barely registers at 0.02%. Yellow cropland instead dominates almost every direction outside the main urban centers. The white developed/other category opens a large gap around Nampa and Caldwell, while smaller pale areas identify other towns and developed sites. Light green pasture and hay, tan shrub/grass, blue water, and teal wetlands remain visible around the edges of the farm system and along drainage features.
An 8.81% mean impervious value reveals how concentrated the built environment has become
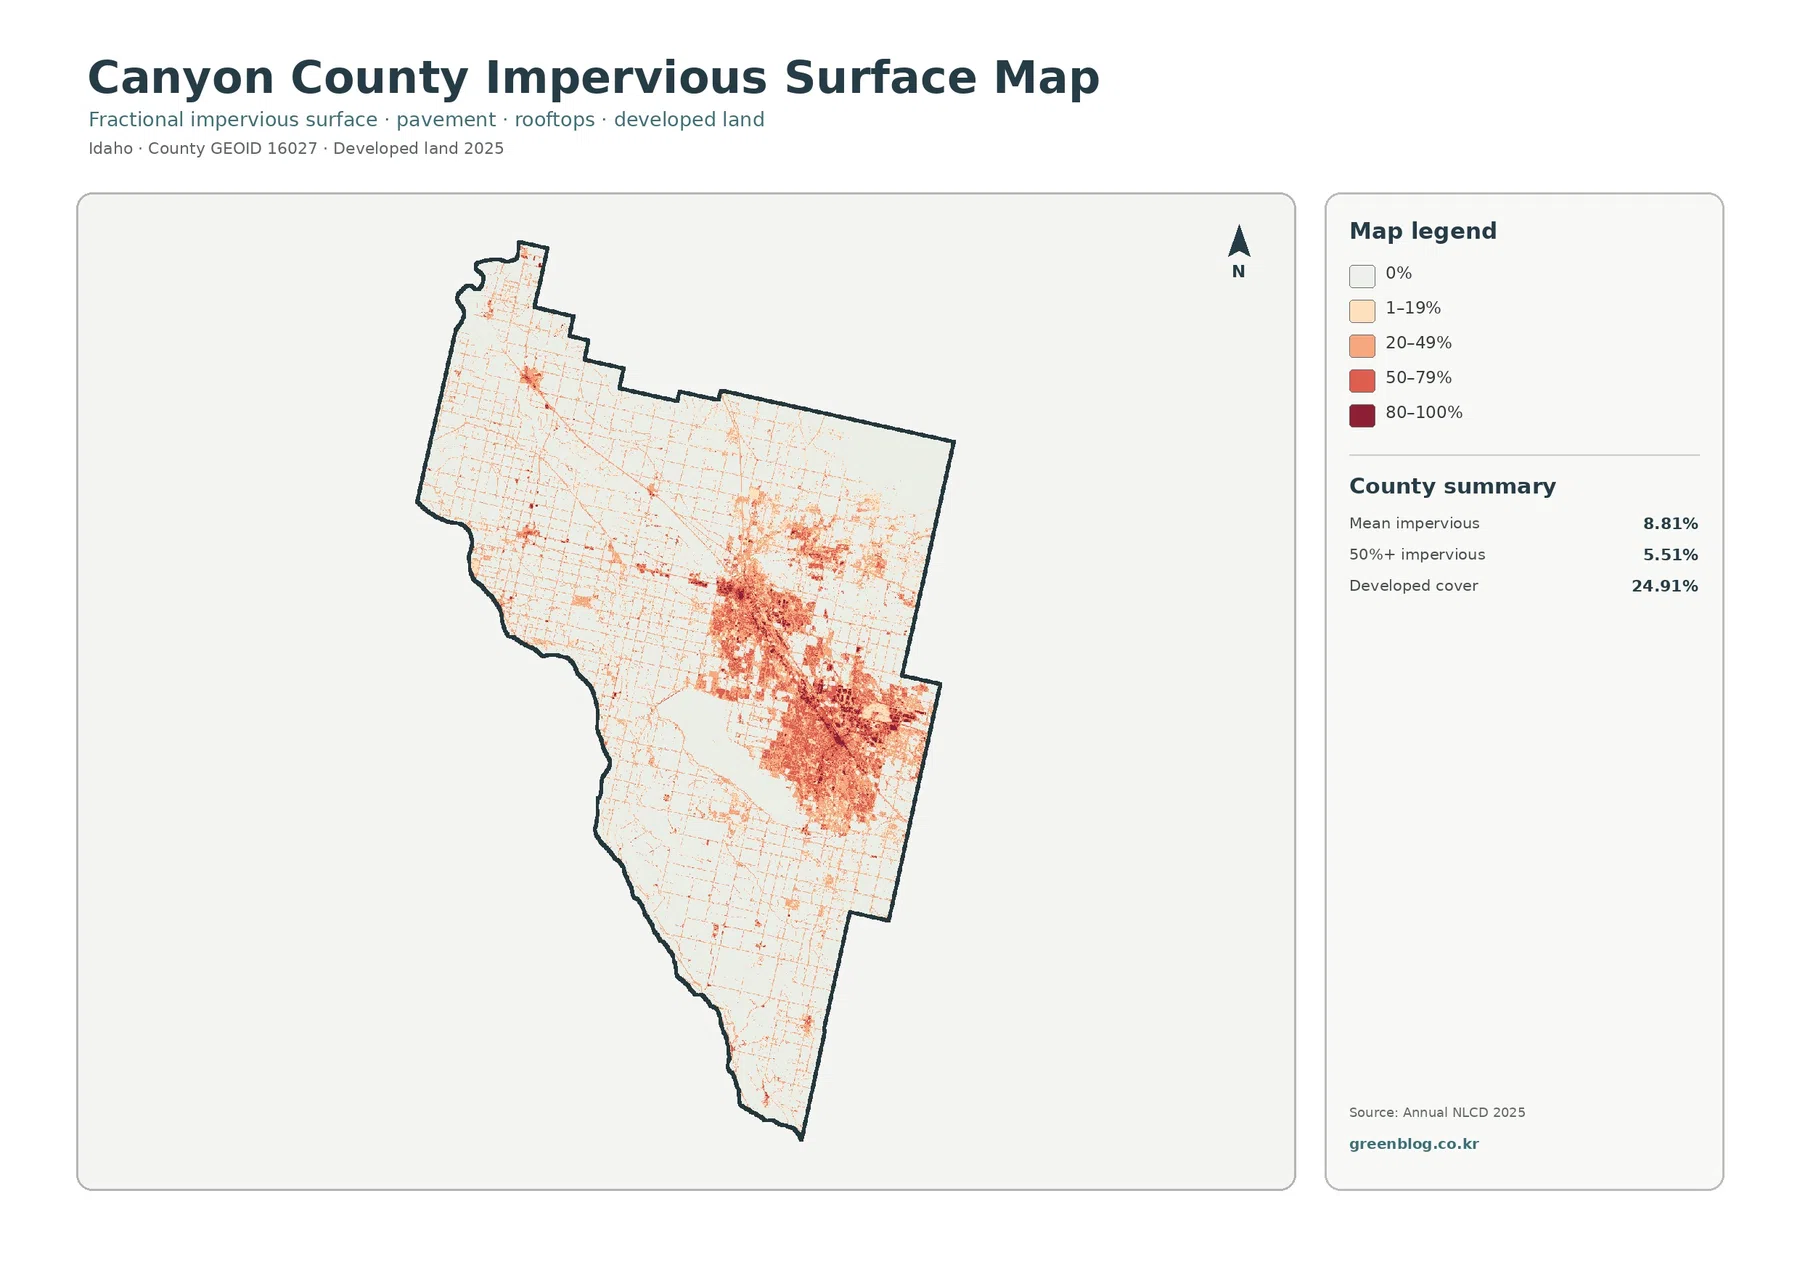
Impervious surface measures hard cover such as rooftops, pavement, and parking areas where water does not readily soak into the ground. Canyon County’s mean impervious value is 8.81%, and 5.51% of the county falls in cells with at least 50% impervious cover. Those numbers are high compared with the mostly rural Idaho counties that have appeared earlier in this project. The map explains why: the Nampa–Caldwell area forms a broad, dark concentration rather than a small isolated town center.
Development accounts for the largest share of the 1985–2025 class difference
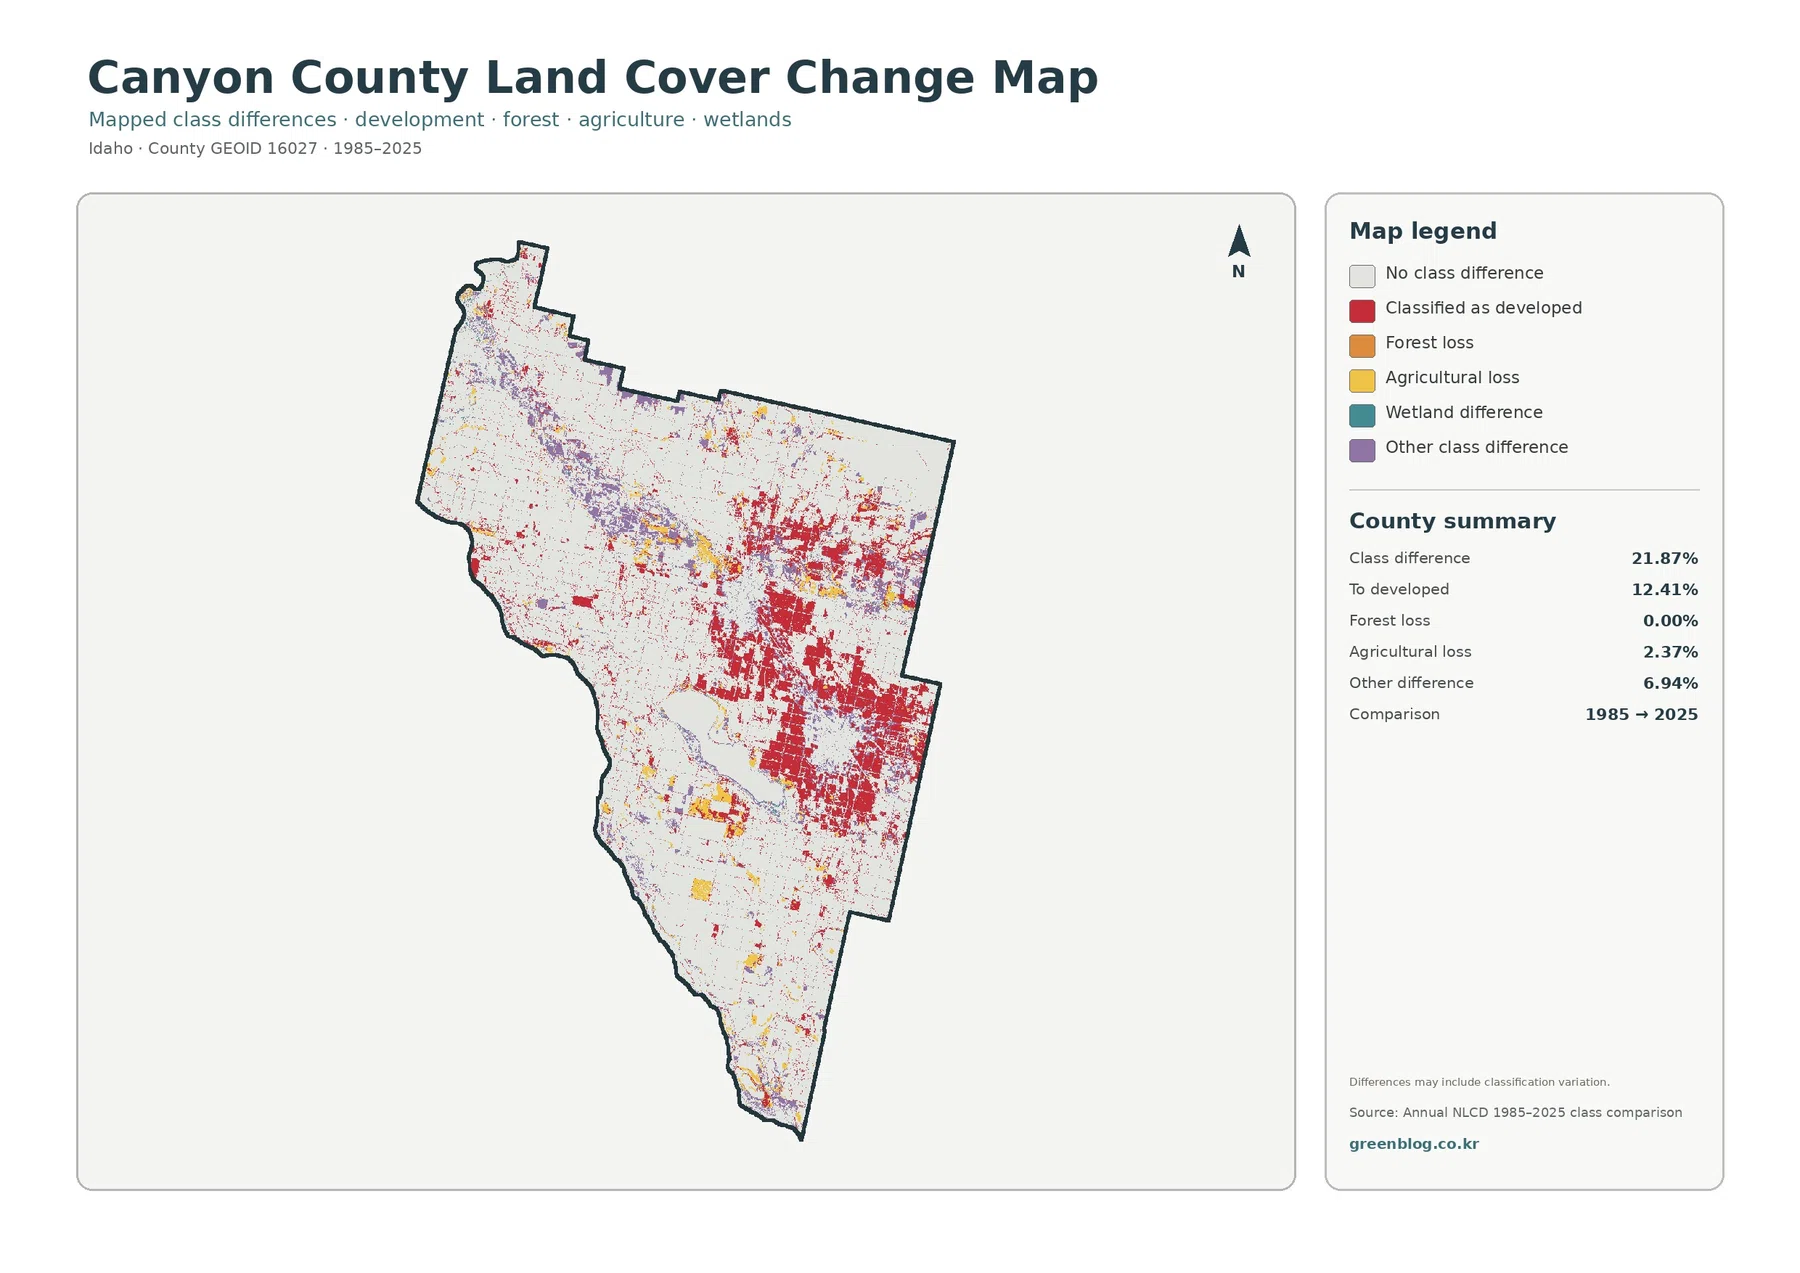
The 1985–2025 endpoint comparison marks 21.87% of Canyon County as having a different class. The largest component is classified to developed at 12.41%. Agricultural loss is 2.37%, other class difference 6.94%, and forest loss is 0.00%; the remaining roughly 0.15% is associated with wetland difference. This distribution makes Canyon County very different from places where long-term change is dominated by forest or shrub transitions.
Red developed-difference cells are heavily concentrated around the same central and eastern area that is developed today. They spread outward from the Nampa–Caldwell core and appear along several road-oriented corridors. Smaller red pockets also occur around northern and western communities. By contrast, much of the western and southern agricultural landscape remains pale, showing that the endpoint difference was not evenly distributed across the county.
Canyon County makes the farm-versus-city contrast visible without reducing either side
Describing Canyon County only as agricultural misses nearly a quarter of the 2025 land cover that is developed. Describing it only as urban ignores the 61.53% agricultural majority that still surrounds the cities and fills most of the county. The maps work best when both conditions are kept in view: a broad working-land base and a large, expanding built corridor centered on Nampa and Caldwell.
Choose pairs of layers based on the question instead of shrinking all four together
For urban growth, the impervious layer and the 1985–2025 comparison belong together. One shows the present concentration of rooftops and pavement, while the other identifies cells that changed to developed classification between the two endpoints. Their strongest patterns overlap broadly around the main population centers, but they are not interchangeable: current impervious intensity is not the same measurement as long-term class change.
Thirty-meter cells are appropriate for county patterns, not parcel decisions
Annual NLCD is a raster product that commonly uses 30-meter cells. Each cell simplifies the surface into a dominant class or an impervious fraction. In Canyon County, that scale is large enough to show the agricultural field grid, urban core, Lake Lowell, and major corridors, but it cannot reliably separate every driveway, irrigation ditch, narrow stream, backyard, or parcel boundary.
Four original JPG files are included in the download
The ZIP contains the original JPG versions of the 2025 land-cover view, forest and farmland view, impervious surface and developed-land view, and 1985–2025 land-cover change view. Keeping the files together makes it straightforward to compare the same farm block, urban edge, river corridor, or Lake Lowell shoreline across several layers.
Frequently Asked Questions
What is the dominant land-cover class in Canyon County?
Agriculture is the largest 2025 class at 61.53%, followed by developed land at 24.91%. Farming dominates the west, north, and south, while the largest developed concentration is centered on the Nampa–Caldwell area.
Why is mean impervious cover 8.81% when developed land is 24.91%?
Developed land-cover classes can include lawns, trees, soil, and other permeable surfaces around buildings and streets. The impervious layer measures the hard fraction such as rooftops and pavement, so the two percentages describe different characteristics of the same developed landscape.
Does the 21.87% class difference mean that one fifth of the county became urban?
No. The total includes 12.41% classified to developed, 2.37% agricultural loss, 6.94% other class difference, and a small wetland-difference share. The 21.87% figure combines several endpoint changes and should not be treated as urban growth alone.
Sources and Reference Data
- MRLC Annual NLCD Data – official access point for the 2025 land-cover and comparison products
- USGS Annual NLCD Land Cover Classification – definitions for agriculture, developed land, grassland, water, wetlands, and other classes
- Canyon County 2030 Comprehensive Plan – official county context for cities, agriculture, Lake Lowell, the Boise River, and the Snake River
- Canyon County Parks Plan – official discussion of the Snake River, Boise River, and Lake Lowell as major natural and recreation assets
Map File Information
The ZIP contains four original JPG maps for comparing Canyon County's 61.53% agricultural base, 24.91% developed cover, Lake Lowell, hard-surface concentration, and 1985–2025 class differences.
- Included Files: Use only the versions confirmed in the article and supplied images
- File Type: Use the confirmed download contents
- Intended Use: Printing, education, presentations, and map-based projects
Related Maps
Green Map creates custom-edited map images using open geographic data sources such as geoBoundaries, Natural Earth, OpenStreetMap, and government open data.
These maps are edited visual materials, not raw data files, and are provided for education, documents, presentations, and graphic reference.