Shrubland dominates the supplied 2025 Bingham County land-cover summary at 53.07%, while agriculture accounts for another 26.85%. Grassland is 8.09%, forest 4.36%, developed land 4.15%, wetlands 2.59%, and water 0.76%. The countywide pattern is not uniform: broad agricultural blocks occupy much of the center and west, while shrubland and scattered forest become more prominent toward the east and across the northern extensions.
This page separates that pattern into four views: 2025 land cover, forest and farmland, impervious surface with developed land, and a 1985–2025 class-difference map. The WebP versions appear with the discussion, and the four original JPG maps are available together in one ZIP below. The set lets a reader compare current surface cover, the agricultural footprint, concentrations of hard surfaces, and where the two endpoint classifications differ.
Table of Contents
Shrubland covers more than half the county, but agriculture forms a broad central belt
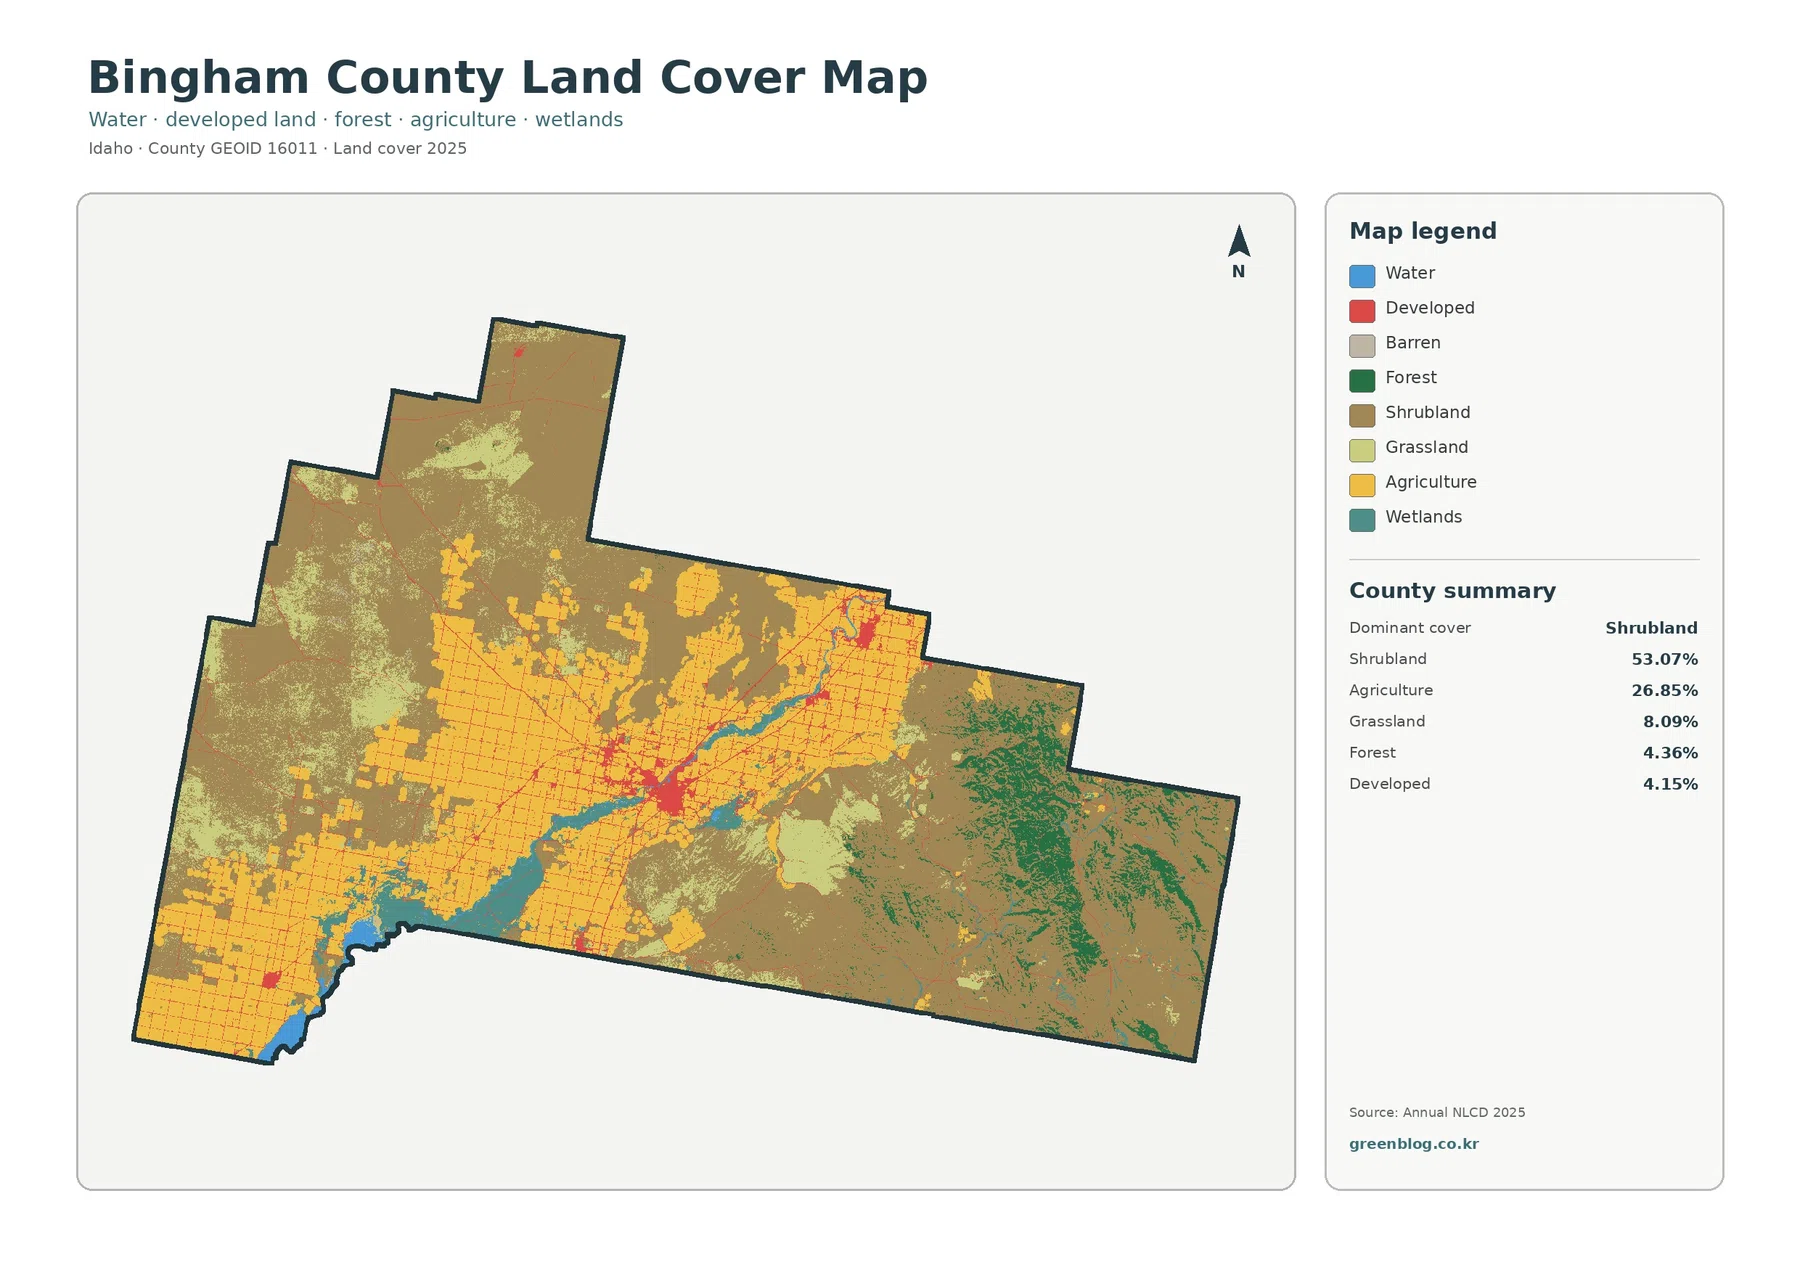
The strongest first impression is the large amount of shrubland. It occupies broad northern and eastern areas and remains common across parts of the west. Agriculture, however, creates a second major pattern rather than a minor interruption. Large yellow blocks spread through the center and continue toward the southwest, with additional concentrations farther north. The boundary between those two covers is irregular, so Bingham County changes noticeably from open shrub-dominated ground to intensively mapped agricultural areas over relatively short distances.
Agriculture is the second-largest class at 26.85%. Many of the agricultural blocks have straight or rectangular edges, and narrow developed traces cross or border them in several places. Those shapes should not be treated as parcel or zoning boundaries. Land cover describes the physical surface seen by the classification system, such as crops, shrubland, forest, water, or developed cover. It does not establish ownership, legal land use, or what can be built on a property.
Grassland contributes 8.09%. It appears in broad pale areas in the northwest, north-central portion, and parts of the east, often beside shrubland. At a small display size, grassland and shrubland can be easy to confuse, so the legend matters when comparing open natural cover with the yellow agricultural blocks. Forest is only 4.36% countywide, yet the dark green pattern is concentrated enough to be visually important, especially in the eastern part of the county.
Wetlands account for 2.59% and water for 0.76%. Those percentages are modest, but blue water and teal wetland features form recognizable corridors through the central and southwestern parts of the map. In several places, they lie directly beside agricultural cover, and smaller wetland patches also appear away from the largest water bodies. Their position is informative for landscape comparison, but the map does not define flood zones, wetland jurisdiction, water rights, or legal stream boundaries.
The vegetation view separates the central farmland from eastern forest more clearly
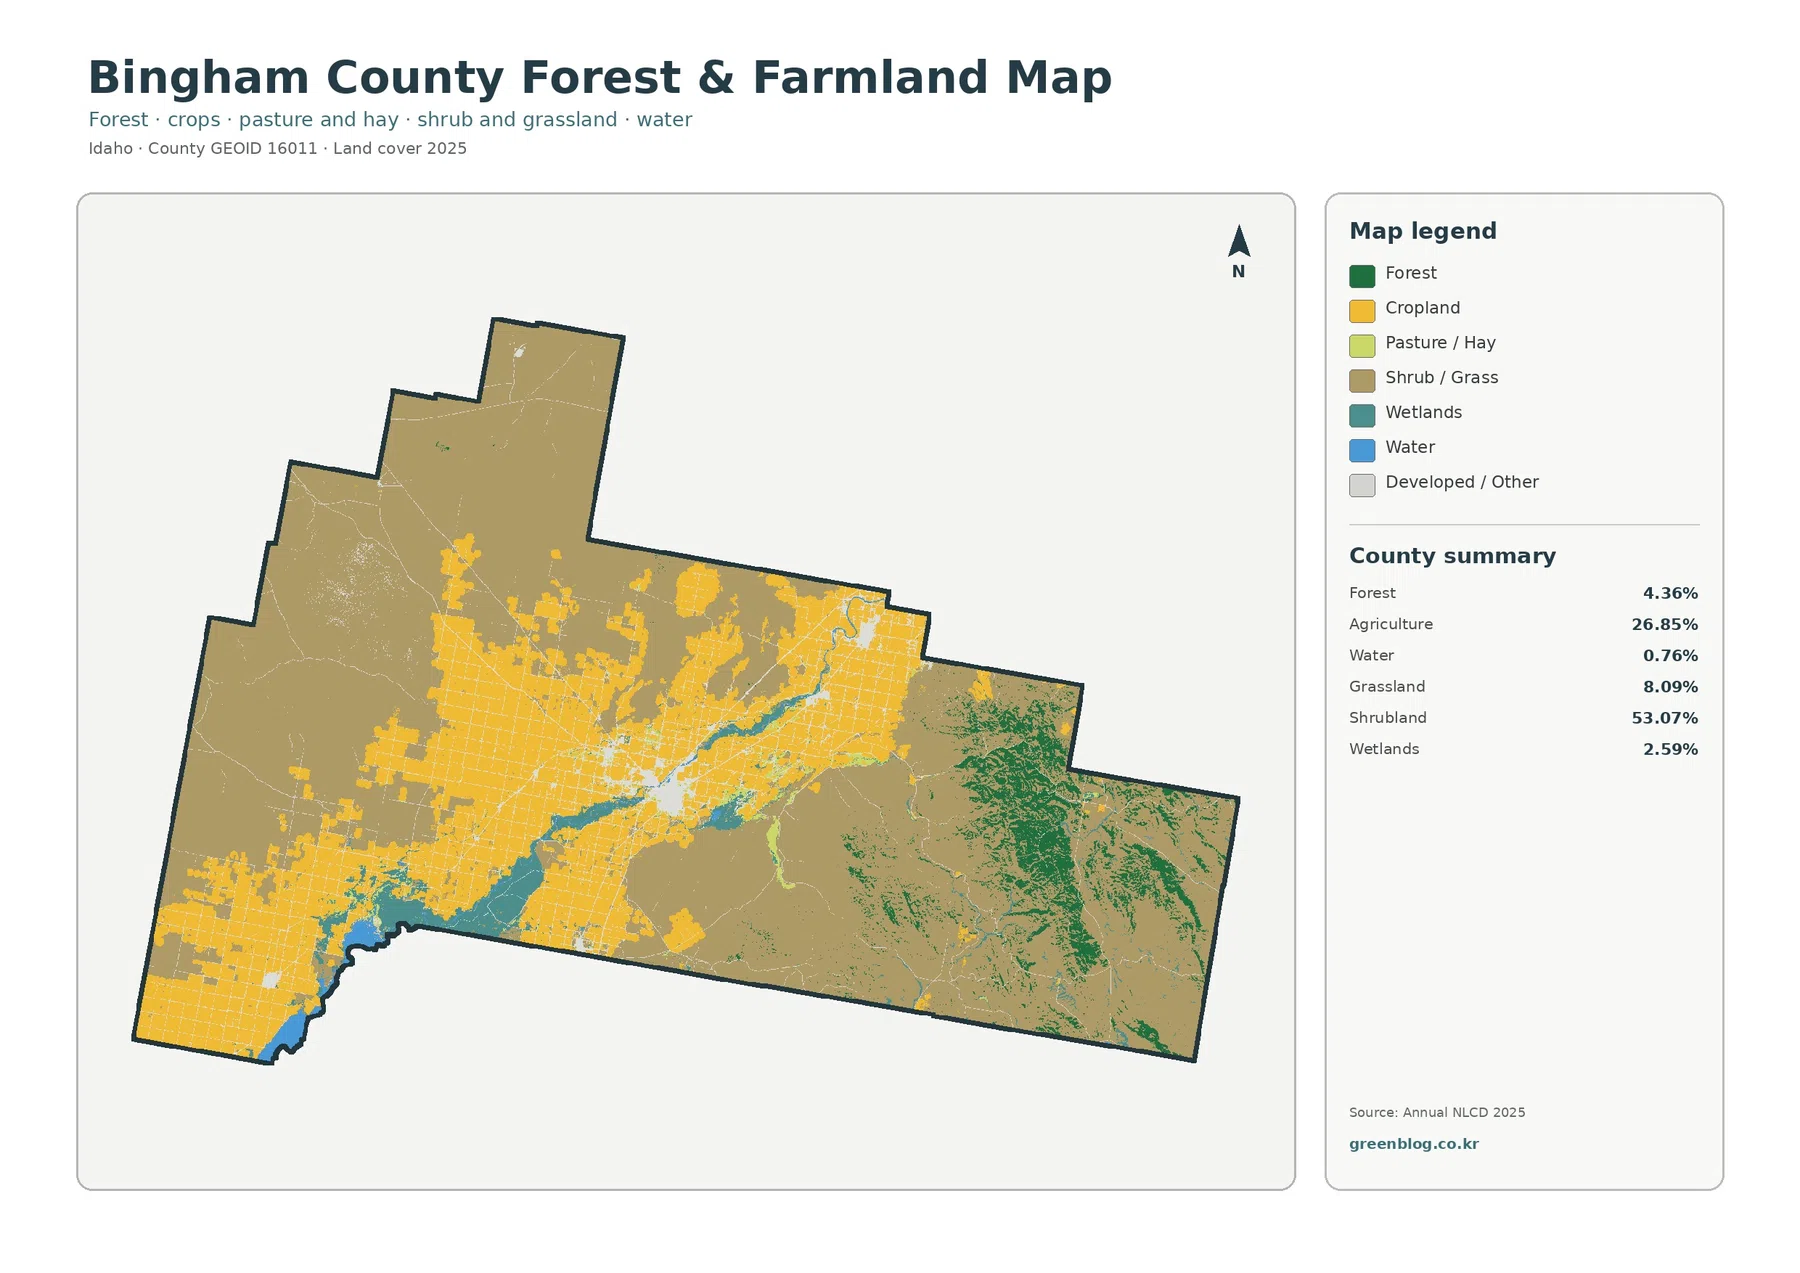
Removing several minor classes makes the county’s agricultural structure easier to see. Yellow cropland and farm-related cover occupy a broad middle zone and expand toward the southwest. North of that zone, agriculture breaks into separate blocks surrounded by shrub and grass cover. Eastward, the amount of yellow decreases while green forest and extensive shrub-and-grass surfaces become more common. The simplified palette makes that west-to-east change much clearer than the full land-cover map.
Hard surfaces are sparse countywide and concentrated in a few developed nodes
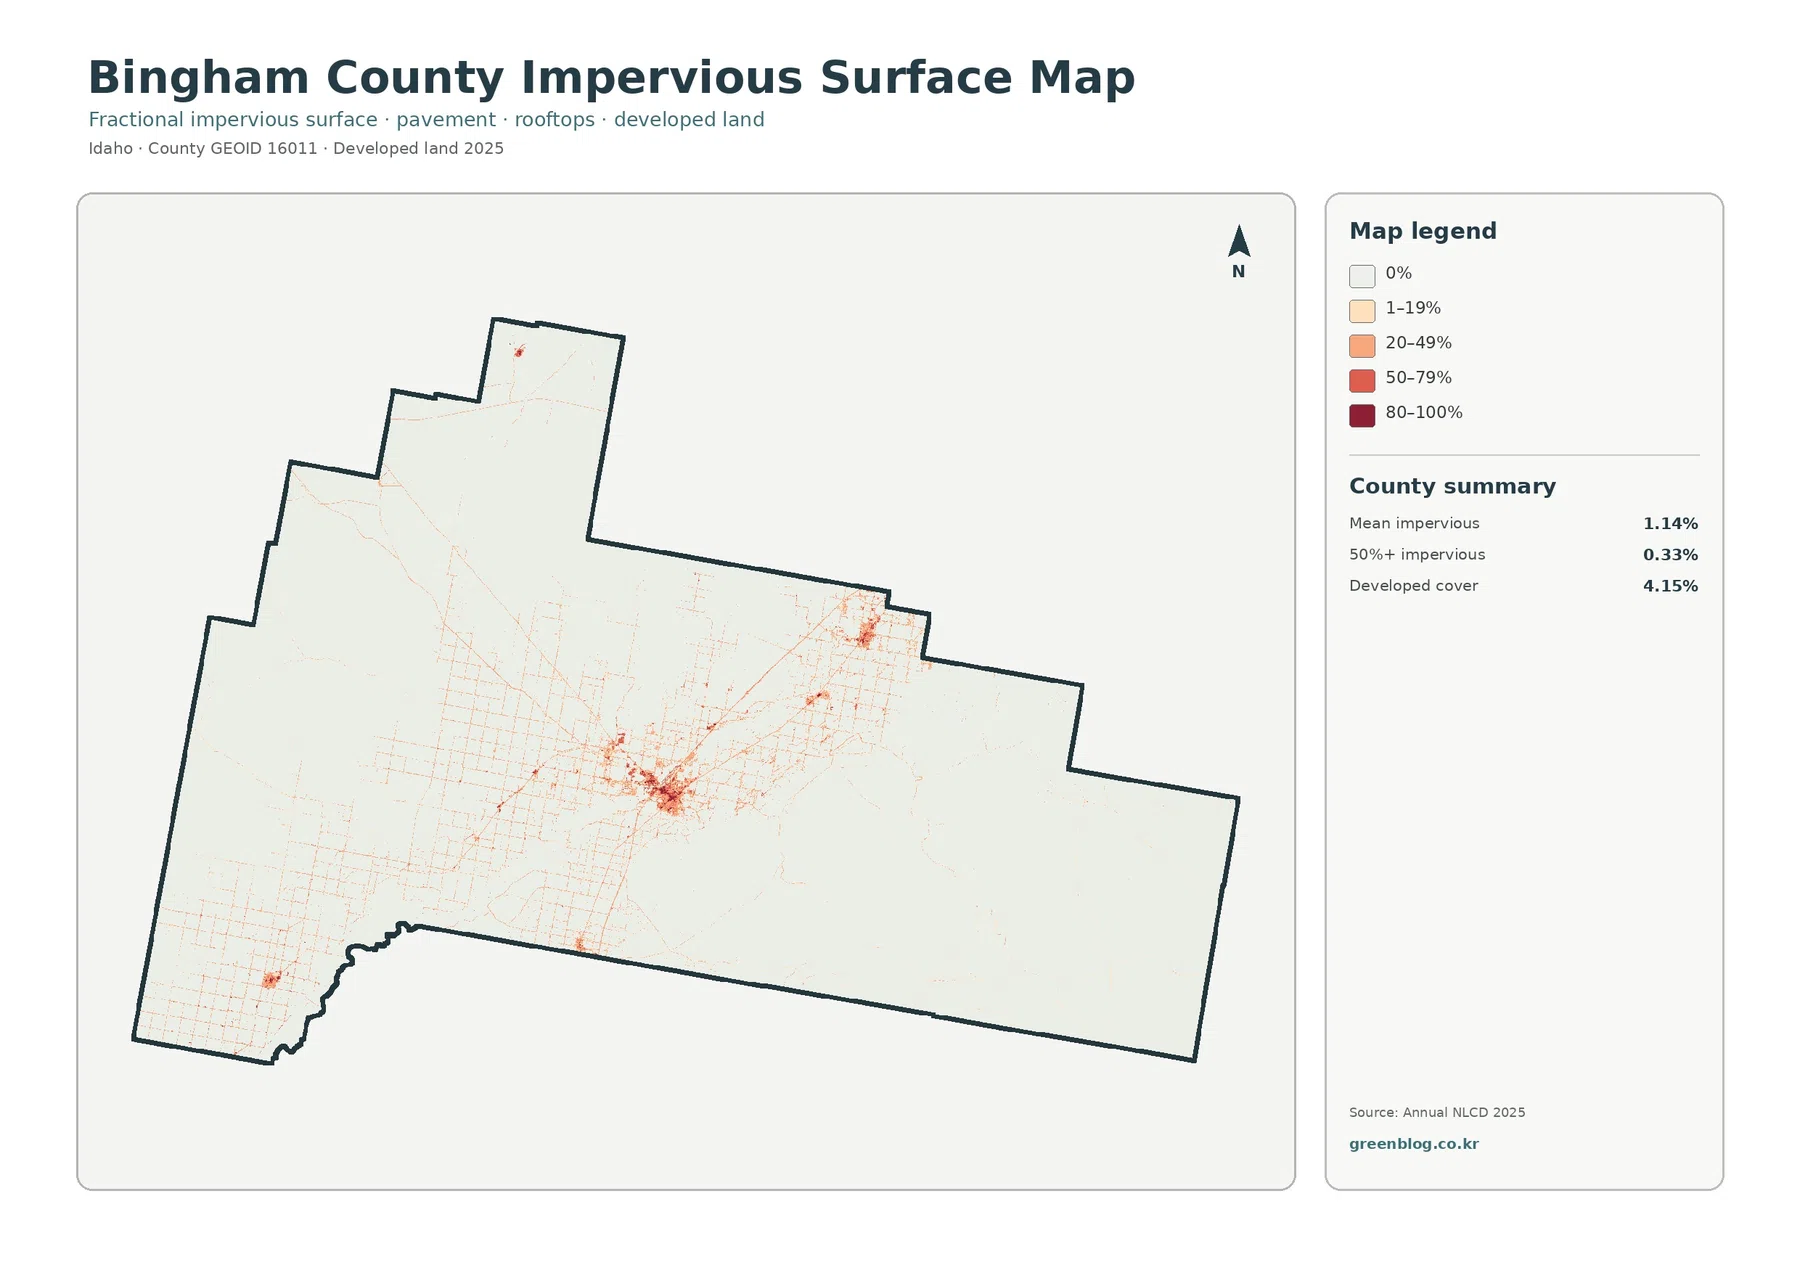
Impervious surface means ground covered by materials such as rooftops and pavement that do not readily absorb water. Bingham County’s mean impervious value is 1.14%, and only 0.33% of the county is mapped at 50% impervious or higher. Developed cover is 4.15%. Those numbers differ because a developed land-cover class may contain lawns, trees, bare soil, or other permeable surfaces around buildings and roads.
The map shows one strong hard-surface concentration near the center of the county. Thin lines and small points spread outward from that cluster, while another compact concentration appears toward the northeast. A smaller high-intensity node is visible in the southwest. Outside those locations, most of the county remains very pale on the impervious scale, which is consistent with the large shrubland and agricultural areas seen in the other maps.
The 1985–2025 layer records a 21.51% endpoint class difference
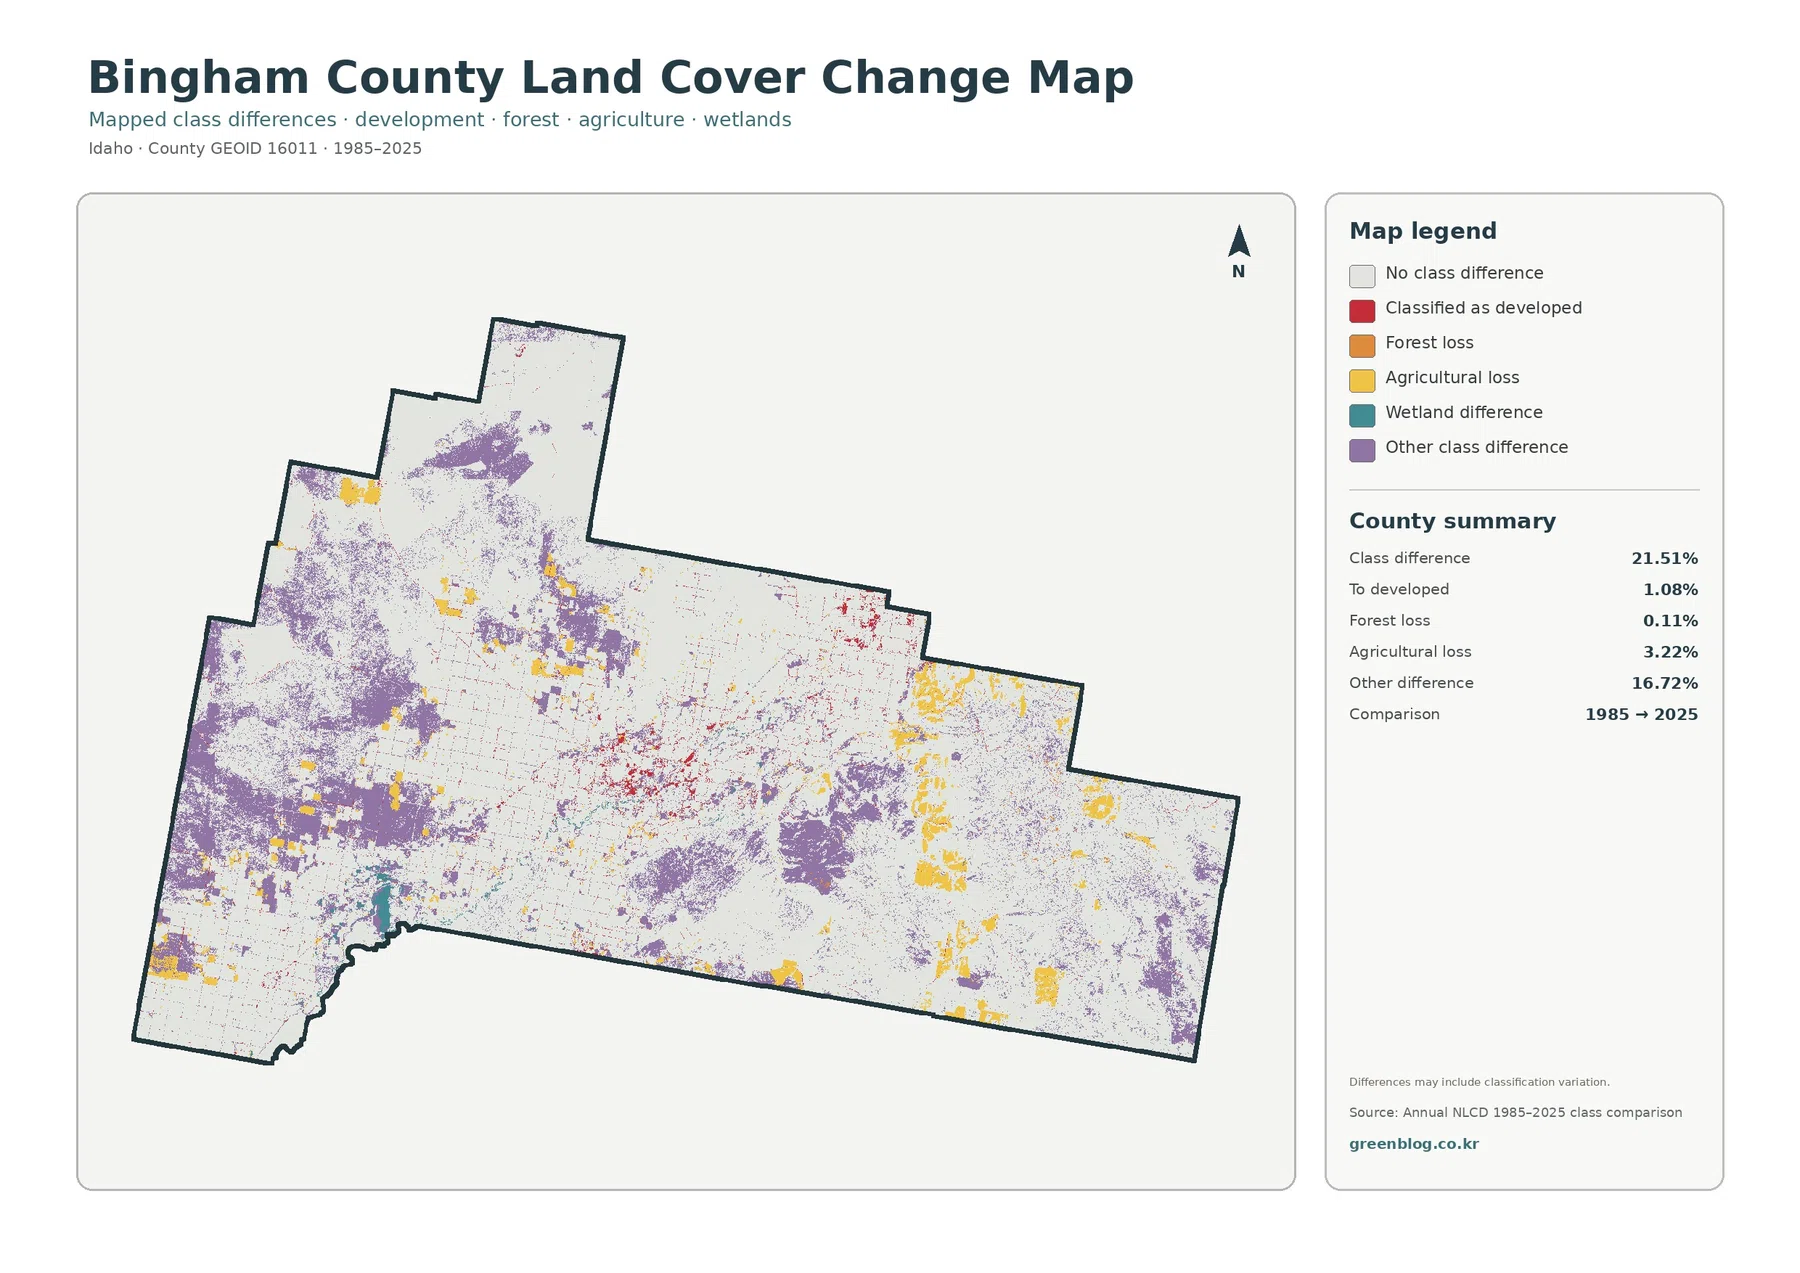
The supplied comparison marks 21.51% of Bingham County as having a different class in 2025 than in 1985. Most of that total is the broad “other difference” category at 16.72%. Agricultural loss is 3.22%, land classified to developed is 1.08%, and forest loss is 0.11%. These values compare two endpoints; they do not describe a continuous year-by-year path between them.
Purple other-difference areas are widespread in the west and northwest and also appear through parts of the south-central and eastern sections. That category can include shifts among shrubland, grassland, agriculture, barren ground, and other classes. The map itself warns that class differences may include classification variation, so a purple area should not automatically be described as physical land disturbance.
Yellow agricultural-loss patches occur in several separate parts of the county, including the northwest, north-central area, and portions of the east and southeast. Red classified-to-developed cells are more concentrated around the same broad central and northeastern areas where current developed and impervious features are visible. Their proximity is worth noting, but the map alone cannot establish that one specific agricultural cell directly became a specific developed use. Intermediate imagery would be needed to reconstruct that sequence.
A practical reading order keeps current cover separate from endpoint change
Begin with the 2025 overview to establish the county’s basic composition. The dominance of shrubland, the broad agricultural middle, the limited eastern forest, and the central water features provide a reference for everything that follows. The forest-and-farmland image can then simplify that composition and make the agricultural blocks easier to compare with open shrub-and-grass cover and eastern forest.
Next, the impervious layer isolates the small fraction of the county occupied by harder built surfaces. The central node, northeastern cluster, and small southwestern concentration are much easier to judge after the countywide natural and agricultural cover is already familiar. The change map belongs last because its purple, yellow, red, and orange colors represent endpoint differences rather than current land-cover classes.
Resolution, observation year, and map purpose limit site-level conclusions
Annual NLCD is a raster land-cover product built from 30-meter cells. Each cell represents a predominant class even when multiple surface types occur within the same area. A farm edge, ditch, narrow road, building, and strip of vegetation can therefore be generalized into a single class. Zooming the image enlarges the pixels but does not turn the map into parcel-scale information.
Download the four original Bingham County JPG maps
The ZIP contains the four original JPG files discussed above: 2025 land cover, forest and farmland, impervious surface and developed land, and the 1985–2025 land-cover class-difference map. Each image measures 2480 × 1754 pixels. The package keeps the broad shrubland-agriculture contrast, eastern forest, small hard-surface footprint, and endpoint-difference layer together for direct comparison.
Frequently Asked Questions
What is the largest land-cover class in Bingham County?
Shrubland is the largest class in the supplied 2025 summary at 53.07%. Agriculture follows at 26.85%, then grassland at 8.09%, forest at 4.36%, developed land at 4.15%, wetlands at 2.59%, and water at 0.76%.
Why is developed cover 4.15% when mean impervious cover is only 1.14%?
A developed class can contain lawns, trees, soil, and other permeable surfaces around buildings and roads. Impervious cover measures the hard-surface fraction more directly, so the countywide mean can be much lower than the total share classified as developed.
Does the 21.51% class difference mean that one-fifth of the county was developed?
No. Only 1.08% is listed as classified to developed in the supplied comparison. The 21.51% total also includes 16.72% other difference, 3.22% agricultural loss, 0.11% forest loss, and possible classification variation between the two endpoints.
Sources and Reference Data
- MRLC Annual NLCD Data – official access point for the Annual NLCD land-cover and comparison products used for the supplied map set
- USGS Annual NLCD Land Cover Classification – definitions for shrubland, grassland, forest, agriculture, wetlands, developed land, and other classes
- U.S. Census Bureau TIGER/Line Shapefiles – official geographic boundary files used for county-level mapping
Map File Information
The ZIP contains four original JPG maps for comparing Bingham County's shrubland, agricultural blocks, eastern forest, water and wetlands, concentrated hard surfaces, and 1985–2025 endpoint class differences.
- Included Files: Use only the versions confirmed in the article and supplied images
- File Type: Use the confirmed download contents
- Intended Use: Printing, education, presentations, and map-based projects
Related Maps
Green Map creates custom-edited map images using open geographic data sources such as geoBoundaries, Natural Earth, OpenStreetMap, and government open data.
These maps are edited visual materials, not raw data files, and are provided for education, documents, presentations, and graphic reference.