The 2025 Treutlen County maps show a county divided among several major cover types rather than dominated by a single surface. Forest is the largest class at 29.96%, but wetlands are close behind at 24.33%. Grassland accounts for 14.65%, agriculture 11.57%, shrubland 10.34%, and developed cover 8.22%. The largest built cluster appears in the south-central part of the county, while forest, wetlands, grass, shrub, and farm cover form a broad patchwork around it.
This page compares four views of the same county: current land cover, forest and farmland, impervious/developed land, and mapped class differences from 1985 to 2025. The page uses 1800×1273 WebP previews, and the four original JPG maps are available together in one download. Each view answers a different question, so the set is useful when a document, lesson, or presentation needs more than a single countywide image.
Table of Contents
A county shared by forest, wetlands, and open cover
The general land-cover map is visually busy because no one class fills most of Treutlen County. Dark green forest blocks appear across the north, east, west, and interior, while teal wetlands weave through many of the same areas. Grassland and shrubland fill large gaps between those two classes, and yellow agricultural patches occur in many parts of the county instead of forming one continuous farming zone. The red developed class is much more concentrated than the natural and agricultural colors.
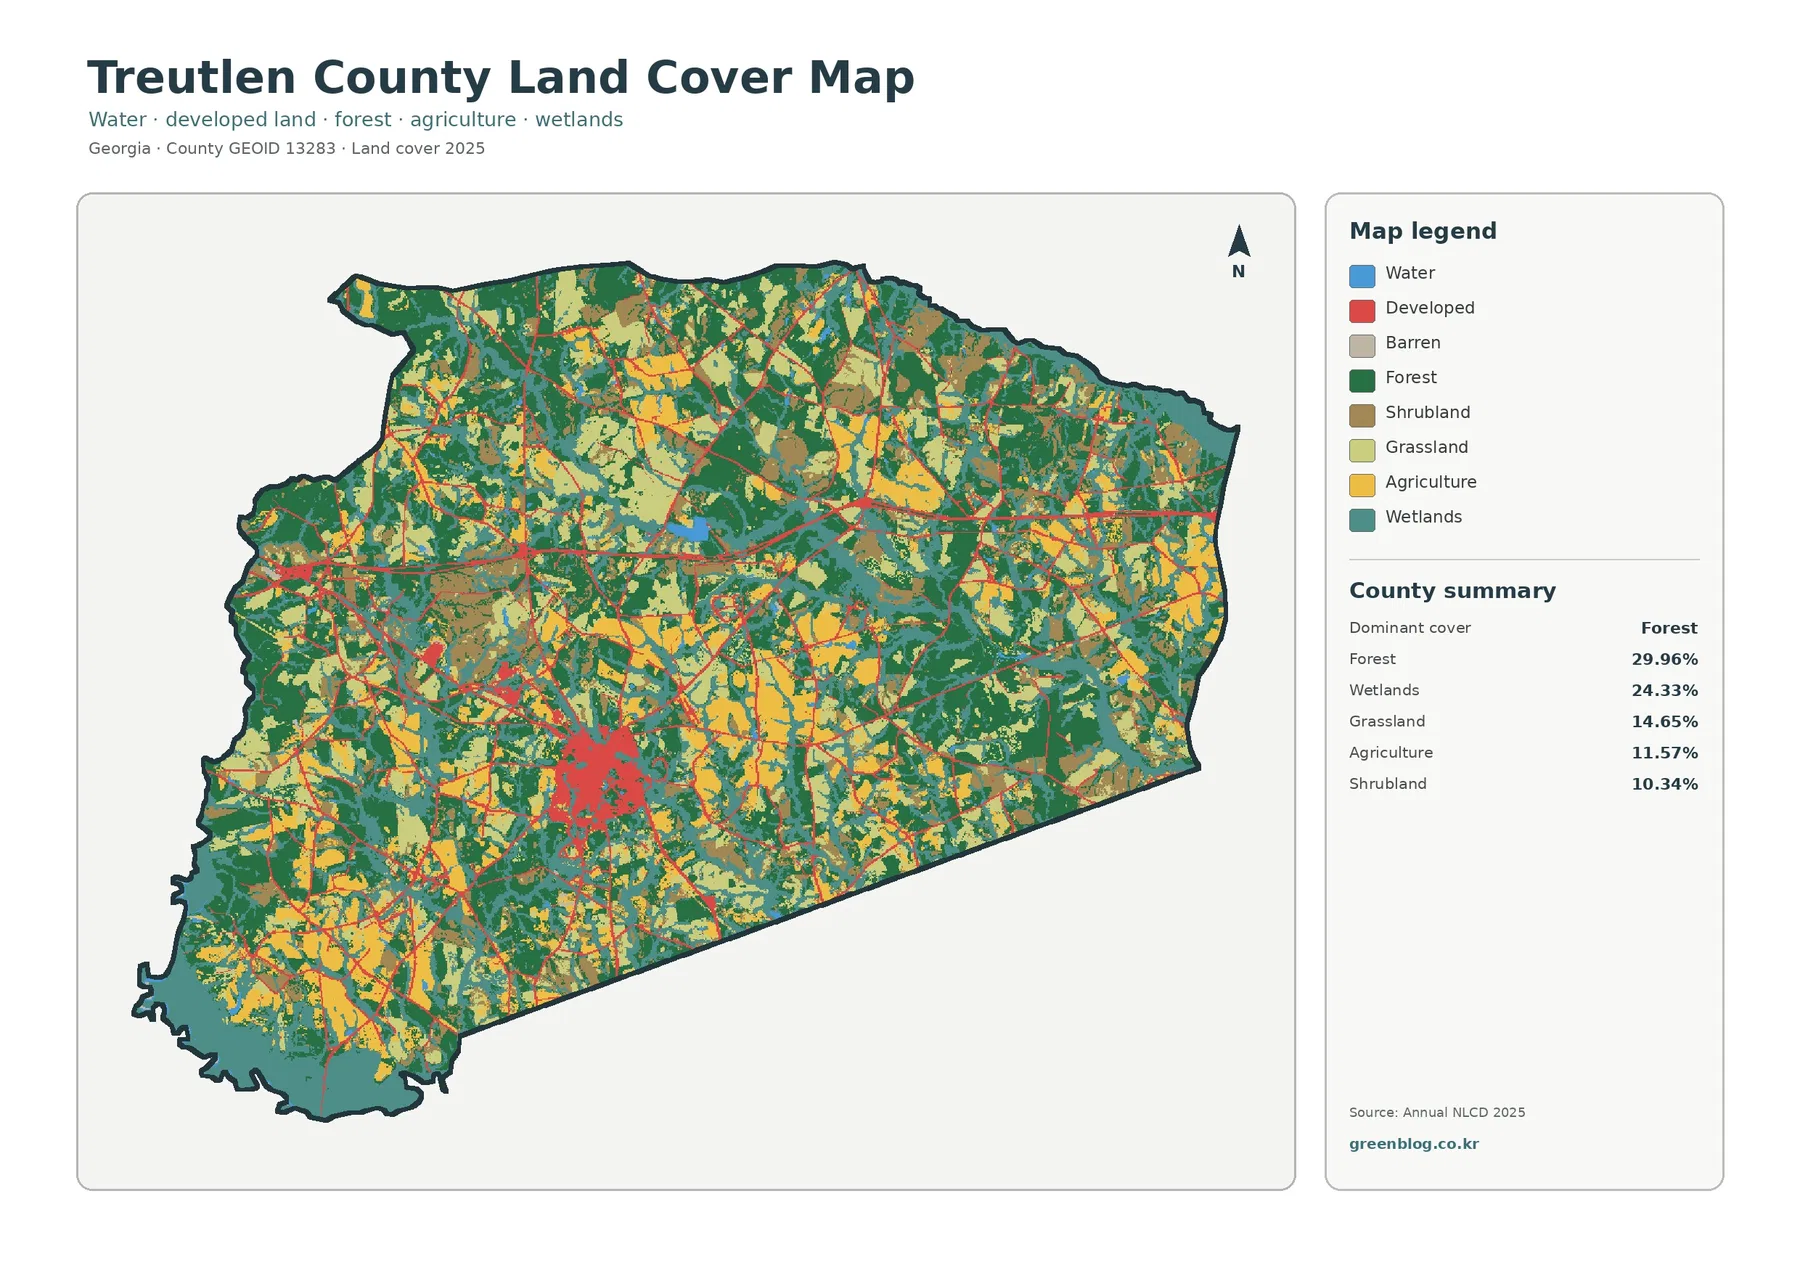
Countywide percentages help explain why the map does not look like a simple forest-versus-farm pattern. Forest and wetlands together account for more than half of the mapped area, yet grassland, shrubland, and agriculture are large enough to break those classes into many separate patches. A close crop of one corner can therefore give a misleading impression of the county as a whole. Keeping the complete boundary and the summary table visible makes the proportions easier to judge.
UGA Extension’s Treutlen County material adds useful local context. It describes the county as well known for timber production and also notes cattle, forage, pecans, turfgrass, cotton, peanuts, and small grains. Those activities help explain why forestry and open agricultural cover both matter locally, but the NLCD map does not identify individual commodities. A yellow cell cannot be labeled as cotton or peanuts from this map alone, and green forest pixels do not identify ownership or a timber-management unit.
| 2025 land-cover summary | Share |
|---|---|
| Forest | 29.96% |
| Wetlands | 24.33% |
| Grassland | 14.65% |
| Agriculture | 11.57% |
| Shrubland | 10.34% |
| Developed | 8.22% |
| Water | 0.77% |
Land cover should not be confused with zoning, legal land use, or parcel ownership. The forest class means tree cover is dominant at the raster-cell scale. Wetland, agricultural, and developed classes are also surface classifications rather than regulatory boundaries. A property can contain more than one surface even when a 30 m cell receives a single class. Parcel decisions need survey, zoning, tax, or environmental records designed for that purpose.
Why the main hard-surface cluster matters more than the county average
The impervious-surface map changes the visual story. Most of Treutlen County is nearly white or very lightly shaded, while a dense cluster of darker pixels appears south of the center. Smaller hard-surface groups occur farther west, and thin linear bands cross the county in several directions. The pattern is much more concentrated than the 8.22% developed-cover class on the general map, which includes vegetation and other permeable surfaces inside developed cells.
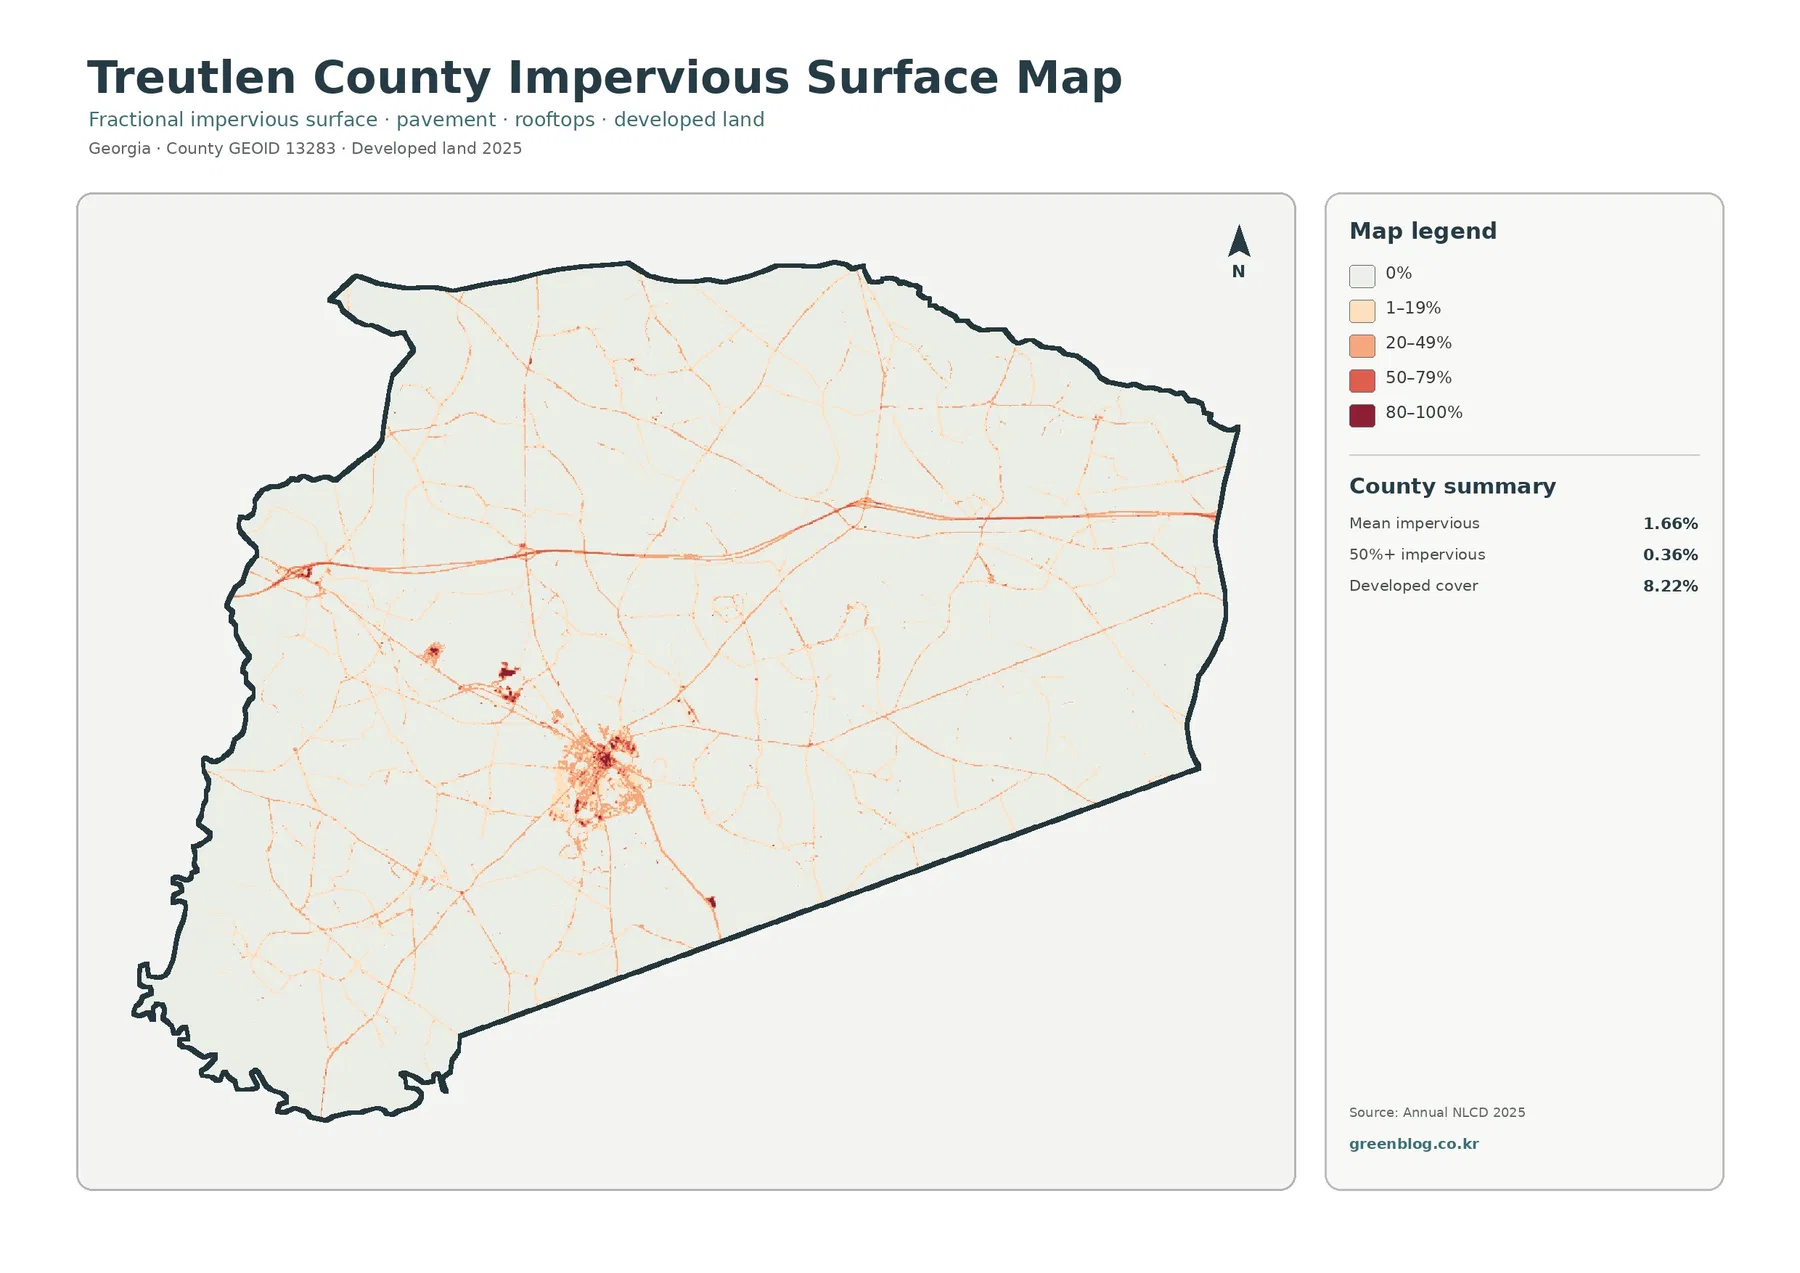
Georgia Department of Community Affairs planning material identifies Soperton as Treutlen County’s only municipality and county seat. It also places the county along Interstate 16. Those facts provide a reasonable geographic frame for discussing settlement and transportation, but the supplied map does not label municipal boundaries or road names. The largest south-central cluster can be discussed as the county’s principal built area, yet its red or dark pixels should not be drawn as an exact Soperton city limit.
The countywide mean impervious value is only 1.66%, while land with at least 50% impervious cover is 0.36%. Those low averages hide strong local contrast. Hard surface is scarce across large wetland, forest, grass, and shrub areas but rises sharply within a few settlement and road-related clusters. Pairing the map with the mean prevents an opposite error as well: a viewer should not assume that the dense central patch represents typical conditions across the entire county.
Impervious surface refers to rooftops, pavement, parking areas, and similar surfaces that do not readily absorb rain. It is useful for showing where hard surface is concentrated, but it is not a flood-hazard or drainage map. Runoff also depends on rainfall, soils, elevation, drainage systems, vegetation, and nearby channels. A dark pixel may be relevant to a watershed discussion, but it does not by itself establish flood risk at a specific property.
| Impervious/developed summary | Share |
|---|---|
| Mean impervious surface | 1.66% |
| 50%+ impervious surface | 0.36% |
| 2025 developed cover | 8.22% |
Forest and farm cover look different when development is simplified
The forest-and-farmland version removes much of the visual competition from developed land and makes the rural cover mix easier to follow. Forest remains 29.96%, agriculture 11.57%, wetlands 24.33%, grassland 14.65%, shrubland 10.34%, and water 0.77%. Forest blocks are interrupted by broad wetland areas and many grass, shrub, and agricultural patches, so the county reads as a working landscape with several large cover types rather than one continuous woodland.
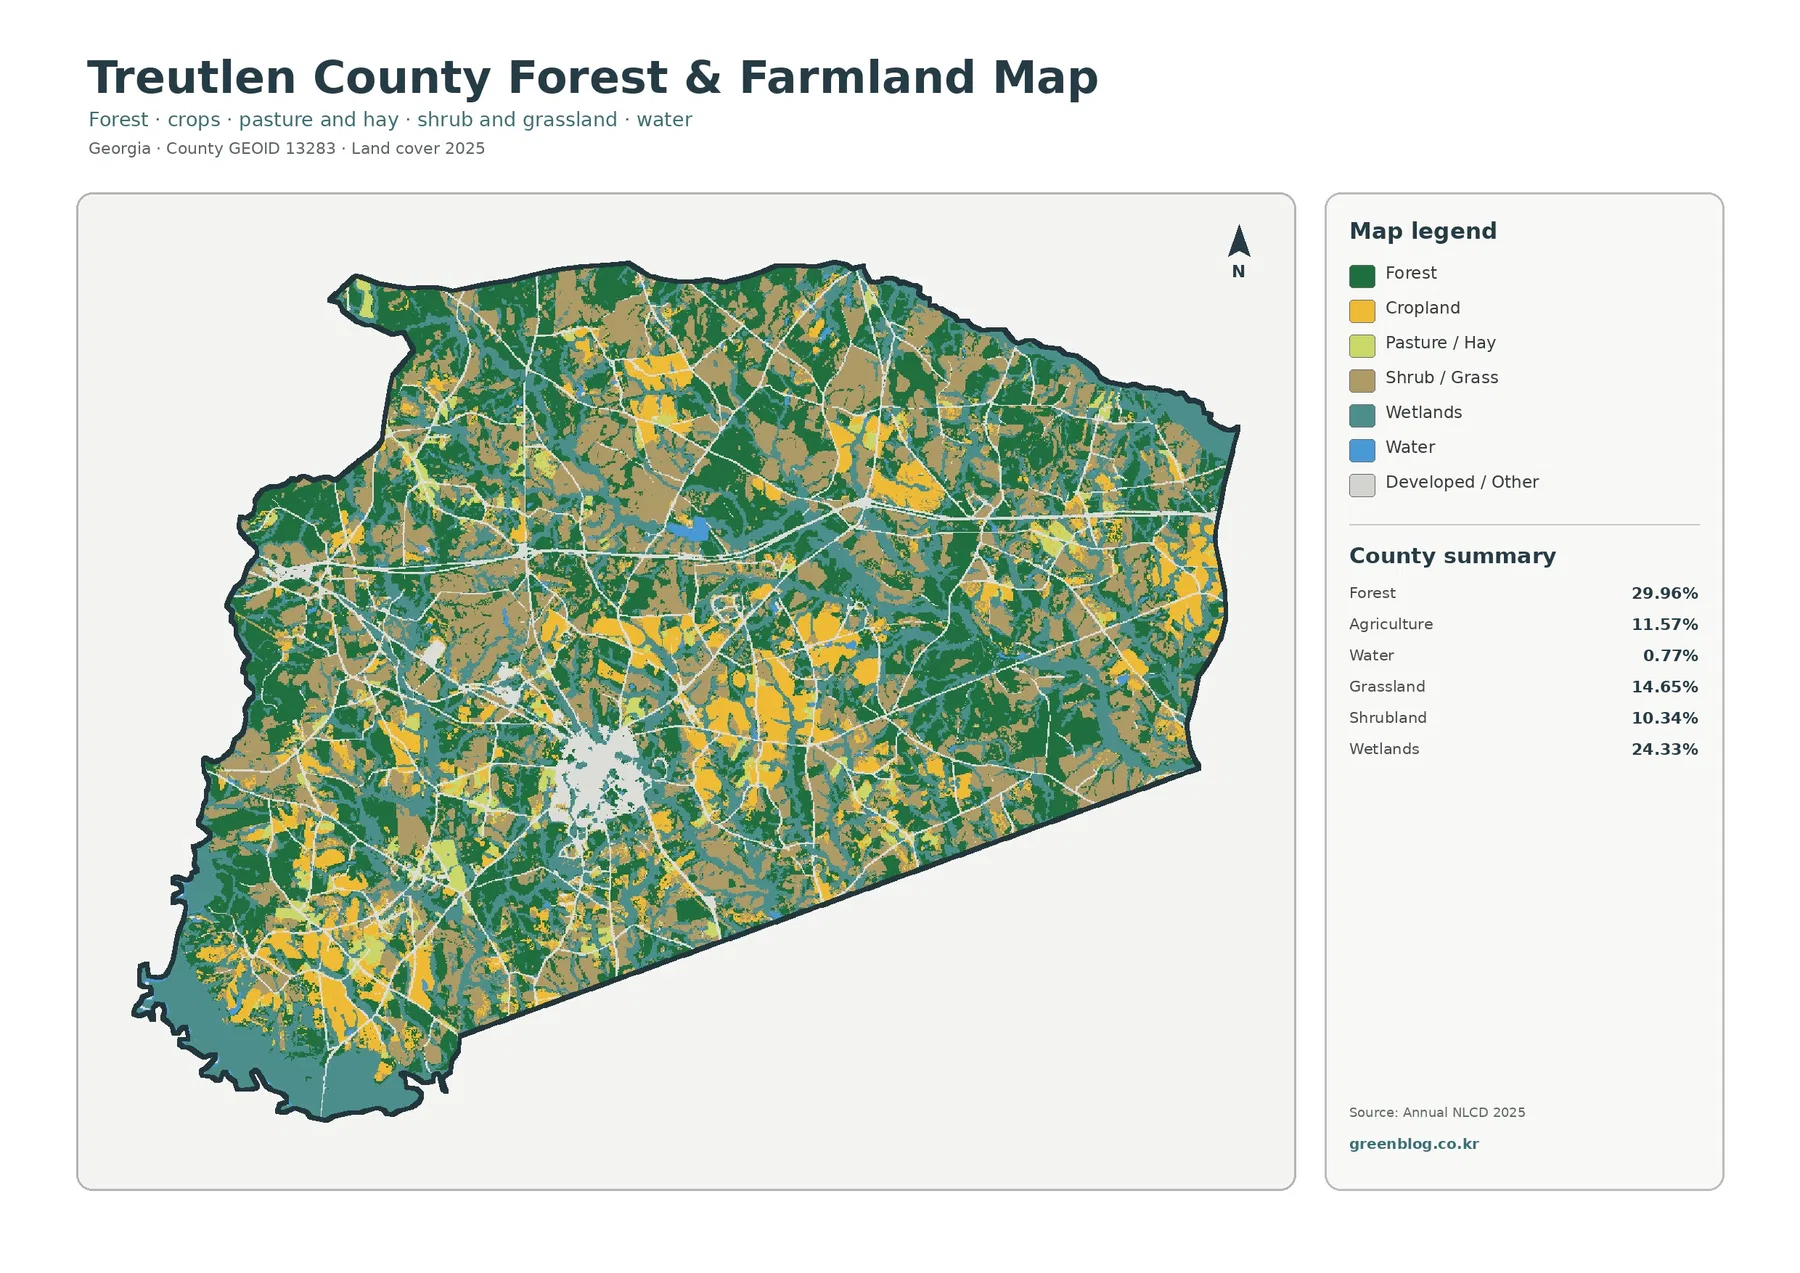
Wetlands are especially important to the visual pattern because they occupy nearly one quarter of the county. Teal areas appear along the southwest edge and in broad interior, eastern, and northeastern zones. Small blue water patches are much less extensive at 0.77%, yet they can help a reader see how some wet areas relate to mapped water. The wetland class is still a land-cover classification, not a regulatory wetland determination or a floodplain boundary.
Grassland and shrubland also deserve attention. Together they represent a substantial share and appear between forest and agricultural patches in many places. Those classes may reflect a variety of real surfaces and management conditions, but this one map cannot identify the cause of each open area. Recent clearing, pasture, early forest regrowth, utility corridors, or other conditions may require separate imagery or field information before a specific explanation is made.
Local agricultural information from UGA Extension should be kept separate from raster interpretation. Treutlen County producers work with timber, cattle, forage, pecans, turfgrass, cotton, peanuts, and small grains, according to the county Extension material. That is useful context for a classroom or planning discussion, but it does not permit a viewer to assign a crop or enterprise to individual yellow, light-green, or brown patches. The map and the local source answer different questions.
The 39.43% two-date difference is much broader than development change
The 1985-2025 change map contains far more colored area than the current impervious map. Total class difference is 39.43%. Forest loss is the largest labeled component at 18.90%, followed by agricultural loss at 9.45% and other class difference at 7.38%. Changed-to-developed cells account for 1.69%. Wetland difference appears in the legend, but the summary does not provide a separate percentage, so no residual value should be invented for it.
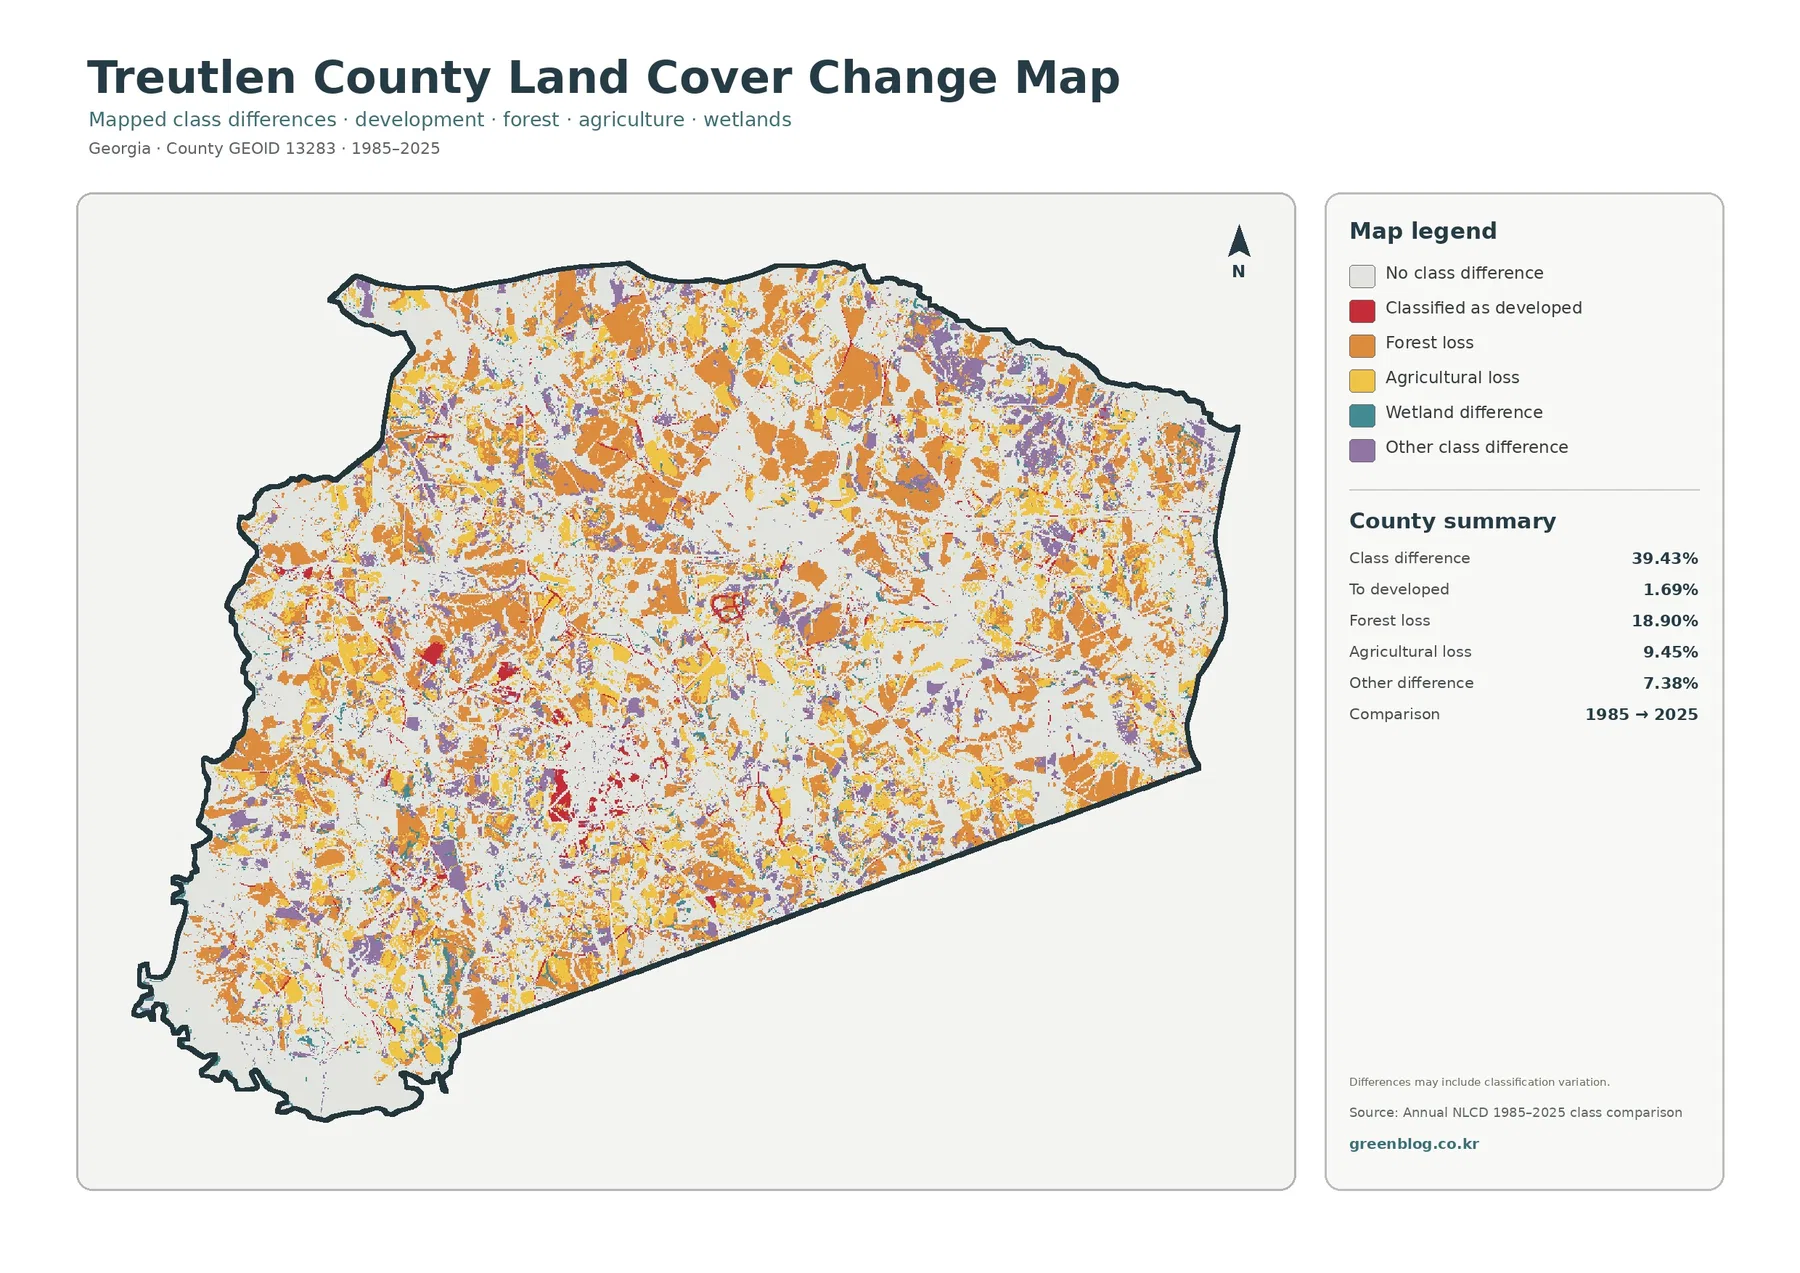
Orange forest-loss patches are widespread across northern, eastern, western, and interior parts of the county. Yellow agricultural-loss areas are scattered among them, while red changed-to-developed cells form a much smaller part of the colored map. Some red appears near the principal built cluster and along linear features, but development change is not the visual or numerical majority. This contrast is one reason the change map should be read beside the current land-cover and impervious views.
The 39.43% figure is not an urbanization rate. Only 1.69% is specifically labeled as changed to developed, and the total also includes forest loss, agricultural loss, other class differences, and wetland-related differences. The map itself cautions that mapped differences may include classification variation. Individual cells can change category because of real surface change, mixed-pixel effects, classification thresholds, or differences in source observations.
Forest loss at 18.90% should also be interpreted as a mapped class difference rather than a claim that 18.90% of the county’s forest was permanently destroyed. A forest cell from one comparison year can be counted in that category when it is shrub, grass, agriculture, or another class in the other year. The two-date map does not show whether vegetation later regrew or what happened in the years between 1985 and 2025. Detailed historical imagery is needed when timing and cause matter.
| 1985-2025 class difference | Share |
|---|---|
| Total class difference | 39.43% |
| Forest loss | 18.90% |
| Agricultural loss | 9.45% |
| Other difference | 7.38% |
| Changed to developed | 1.69% |
Using Soperton and I-16 as context without turning the map into a road map
Official planning information can make the countywide patterns easier to discuss. DCA material describes Treutlen County as a small rural county in central Southeast Georgia, identifies Soperton as the only municipality and county seat, and notes the county’s location along I-16. Those details are appropriate background when the maps are used in a planning or geography lesson. They do not change the fact that the supplied raster maps contain no labeled city polygon or named highway layer.
A careful presentation can therefore say that the strongest hard-surface cluster is consistent with the county’s principal settlement area and that a major linear developed pattern crosses the county. It should avoid drawing an exact Soperton boundary from the pixels or labeling a line as I-16 without a road overlay. Census TIGER/Line data are a better source when municipal limits, roads, and other vector features need to be shown precisely.
UGA Extension provides a second kind of local context by documenting timber and agricultural activity. That information helps explain why forest, agriculture, grassland, and shrubland all deserve space in the article. It should not be used as proof that a specific class-change patch was logging or that a specific agricultural patch contains a named crop. Keeping the mapped observation separate from the source-backed background prevents a plausible story from becoming an unsupported causal claim.
Choosing a map, downloading the JPG set, and keeping the legend attached
Use the general land-cover map when a reader needs the whole 2025 picture in one frame. It is the best view for showing that forest and wetlands are both large while grass, agriculture, shrubland, and developed cover remain important. The forest-and-farmland map is clearer for a forestry or agricultural discussion because it simplifies development. The impervious map is the strongest choice for settlement intensity, and the change map is best for a two-date comparison.
For a presentation, two large maps are often easier to read than four small panels. Pair the general map with the impervious map when the topic is the contrast between broad developed cover and concentrated hard surface. Pair the general map with the forest-and-farmland map for a rural resource discussion. Place the general map beside the change map when the question is how current cover differs from the 1985-2025 class-change footprint.
The WebP previews in the article are 1800×1273 pixels. The download archive contains four original JPG maps at 2480×1754 pixels each. All four use the same Treutlen County outline, which makes side-by-side comparison straightforward. The asset manifest does not mark the JPGs as meeting an A3 high-resolution reference, so a test print is advisable before a large poster is produced.
Keep the map title, year, and legend with the image whenever possible. Red represents current developed cover on one map but changed-to-developed cells on the two-date map. Impervious colors describe a percentage of hard surface rather than a land-cover class. Without the legend, 8.22% developed cover, 1.66% mean impervious surface, and 1.69% changed to developed can look like comparable values even though they measure different things.
Scale, mixed pixels, and the limits of a 30 m classification
Annual NLCD land cover is a raster product with cells of about 30 meters. One raster cell can contain trees, a narrow road, a house, grass, and the edge of a wet area at the same time, yet the classification simplifies it to one class. Narrow streams, small driveways, field edges, and parcel boundaries can therefore look coarser than they do in aerial imagery. The maps are well suited to county-scale comparison, not property surveying.
Mixed pixels are especially important where forest, wetlands, grassland, and agriculture meet. A small shift in classification threshold or imagery between two dates can move a cell from one broad class to another. That does not make the change map useless; it means the map should be treated as a screening and comparison tool. A cluster of changes can identify an area worth investigating, while a site-specific conclusion still requires more detailed evidence.
The current maps represent 2025, so later construction, harvest, regrowth, or agricultural change is not included. The change map compares 1985 with 2025 but does not provide the year-by-year path between those dates. It also cannot identify the cause of forest loss or agricultural loss from color alone. Historical aerial photography, management records, permits, and more detailed time-series data are better sources when the sequence of events matters.
Every exact percentage in this article comes directly from a supplied map summary. Values that were not listed, such as a separate wetland-change percentage or a derived barren-land share, were not created by subtracting the other classes from 100. UGA Extension and DCA sources are used only for local context about forestry, agriculture, Soperton, and regional location. That separation makes the mapped statistics easier to verify.
Frequently Asked Questions
What are the two largest 2025 land-cover classes in Treutlen County?
Forest is the largest at 29.96%, followed closely by wetlands at 24.33%. Grassland, agriculture, and shrubland also have double-digit shares, so the county is better described as a mixed cover pattern than as a single-class landscape.
Does the large south-central developed cluster show the exact boundary of Soperton?
No. DCA identifies Soperton as the county’s only municipality and county seat, but the land-cover map does not include city boundaries. The cluster is a surface classification, and exact municipal limits require a Census or official boundary layer.
Is the 39.43% 1985-2025 class difference an urbanization rate?
No. Changed-to-developed cells account for 1.69%. The 39.43% total also includes 18.90% forest loss, 9.45% agricultural loss, 7.38% other difference, wetland-related differences, and possible classification variation.
Map File Information
The ZIP contains four original JPG maps for Treutlen County: 2025 land cover, forest and farmland, impervious/developed land, and 1985-2025 land-cover change.
- Printable Size: 2480×1754 pixels each
- Intended Use: documents, lessons, presentations, screen comparison, and county-level reference
Related Maps
- Appling County Georgia Land Cover Map
- Atkinson County Georgia Land Cover Map
- Bacon County Georgia Land Cover Map
Sources and references
- MRLC Annual NLCD Data – official access to current land-cover and impervious-surface data.
- USGS Annual NLCD Land Cover Classification – official documentation for land-cover classes and interpretation.
- U.S. Census Bureau TIGER/Line Shapefiles – official boundary and road data for maps that need vector geography.
- UGA Extension Treutlen County – Our Impact – county-specific forestry, agriculture, and natural-resource context.
- Georgia DCA – Treutlen County with Soperton Comprehensive Plan – official planning resources for Treutlen County and Soperton.
Green Map creates custom-edited map images using open geographic data sources such as geoBoundaries, Natural Earth, OpenStreetMap, and government open data.
These maps are edited visual materials, not raw data files, and are provided for education, documents, presentations, and graphic reference.