Spalding County combines a concentrated developed center around Griffin with a broad outer landscape of woods, fields, wetlands, and smaller water features. This page uses four complementary maps to separate those patterns: 2025 land cover, forest and farmland, fractional impervious surface, and land-cover class differences between 1985 and 2025.
All four maps can be viewed below, and the original JPG set is packaged in one ZIP for printing, classroom use, presentations, or side-by-side comparison. Looking at more than one layer matters here because “developed land,” the percentage of hard surface, and long-term class change describe different things even when they appear in some of the same parts of the county.
Table of Contents
A developed center stands out inside a county that is still 40.92% forest
The 2025 summary identifies forest as the largest land-cover group at 40.92%. Agriculture accounts for 23.51% and developed land for 22.00%, while wetlands make up 7.14% and grassland 3.14%. Those figures explain why the map does not read as either purely urban or purely rural. Griffin and the surrounding central area form a large developed patch, but forest and agricultural colors occupy much of the county outside that center.
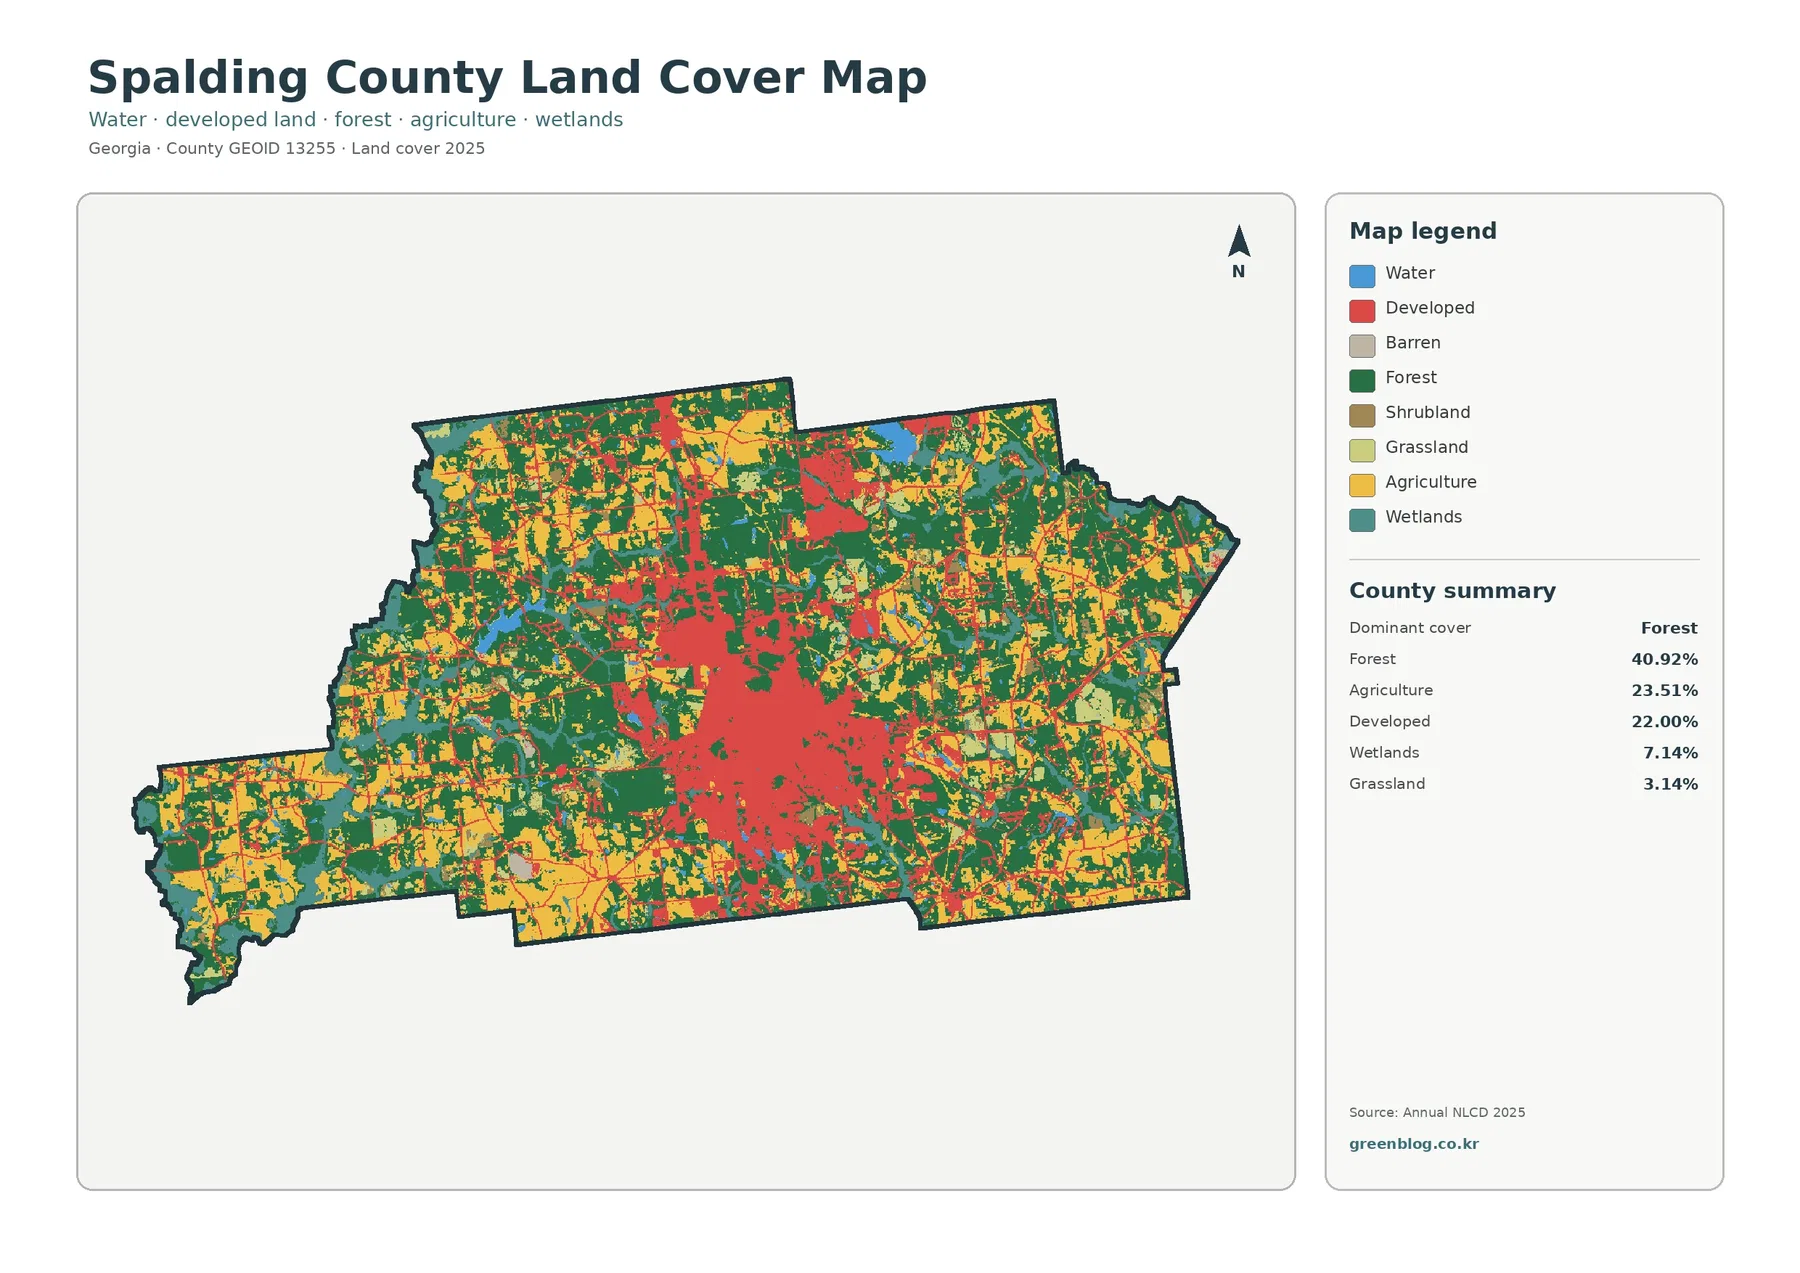
The central developed area is the most visually continuous red feature. Narrower developed lines extend away from it, including a strong northward connection and smaller road-like branches across the county. By contrast, the western projection, the eastern side, and much of the southern edge show more green and yellow. The result is a clear core-and-outer-area contrast without a single clean boundary between “urban” and “rural.” Smaller developed features continue through otherwise forested or agricultural surroundings.
| 2025 mapped cover | County summary |
|---|---|
| Forest | 40.92% |
| Agriculture | 23.51% |
| Developed | 22.00% |
| Wetlands | 7.14% |
| Grassland | 3.14% |
Impervious surface reveals the strongest urban footprint around Griffin
The impervious-surface map answers a narrower question than the general land-cover layer. An impervious surface is a constructed surface such as pavement or a rooftop that does not readily absorb water. Annual NLCD estimates the fraction of each 30-meter cell covered by such material. On this map, the classes run from 0% through 1–19%, 20–49%, 50–79%, and 80–100%, allowing a reader to see not only where development exists but where hard surfaces are most concentrated.
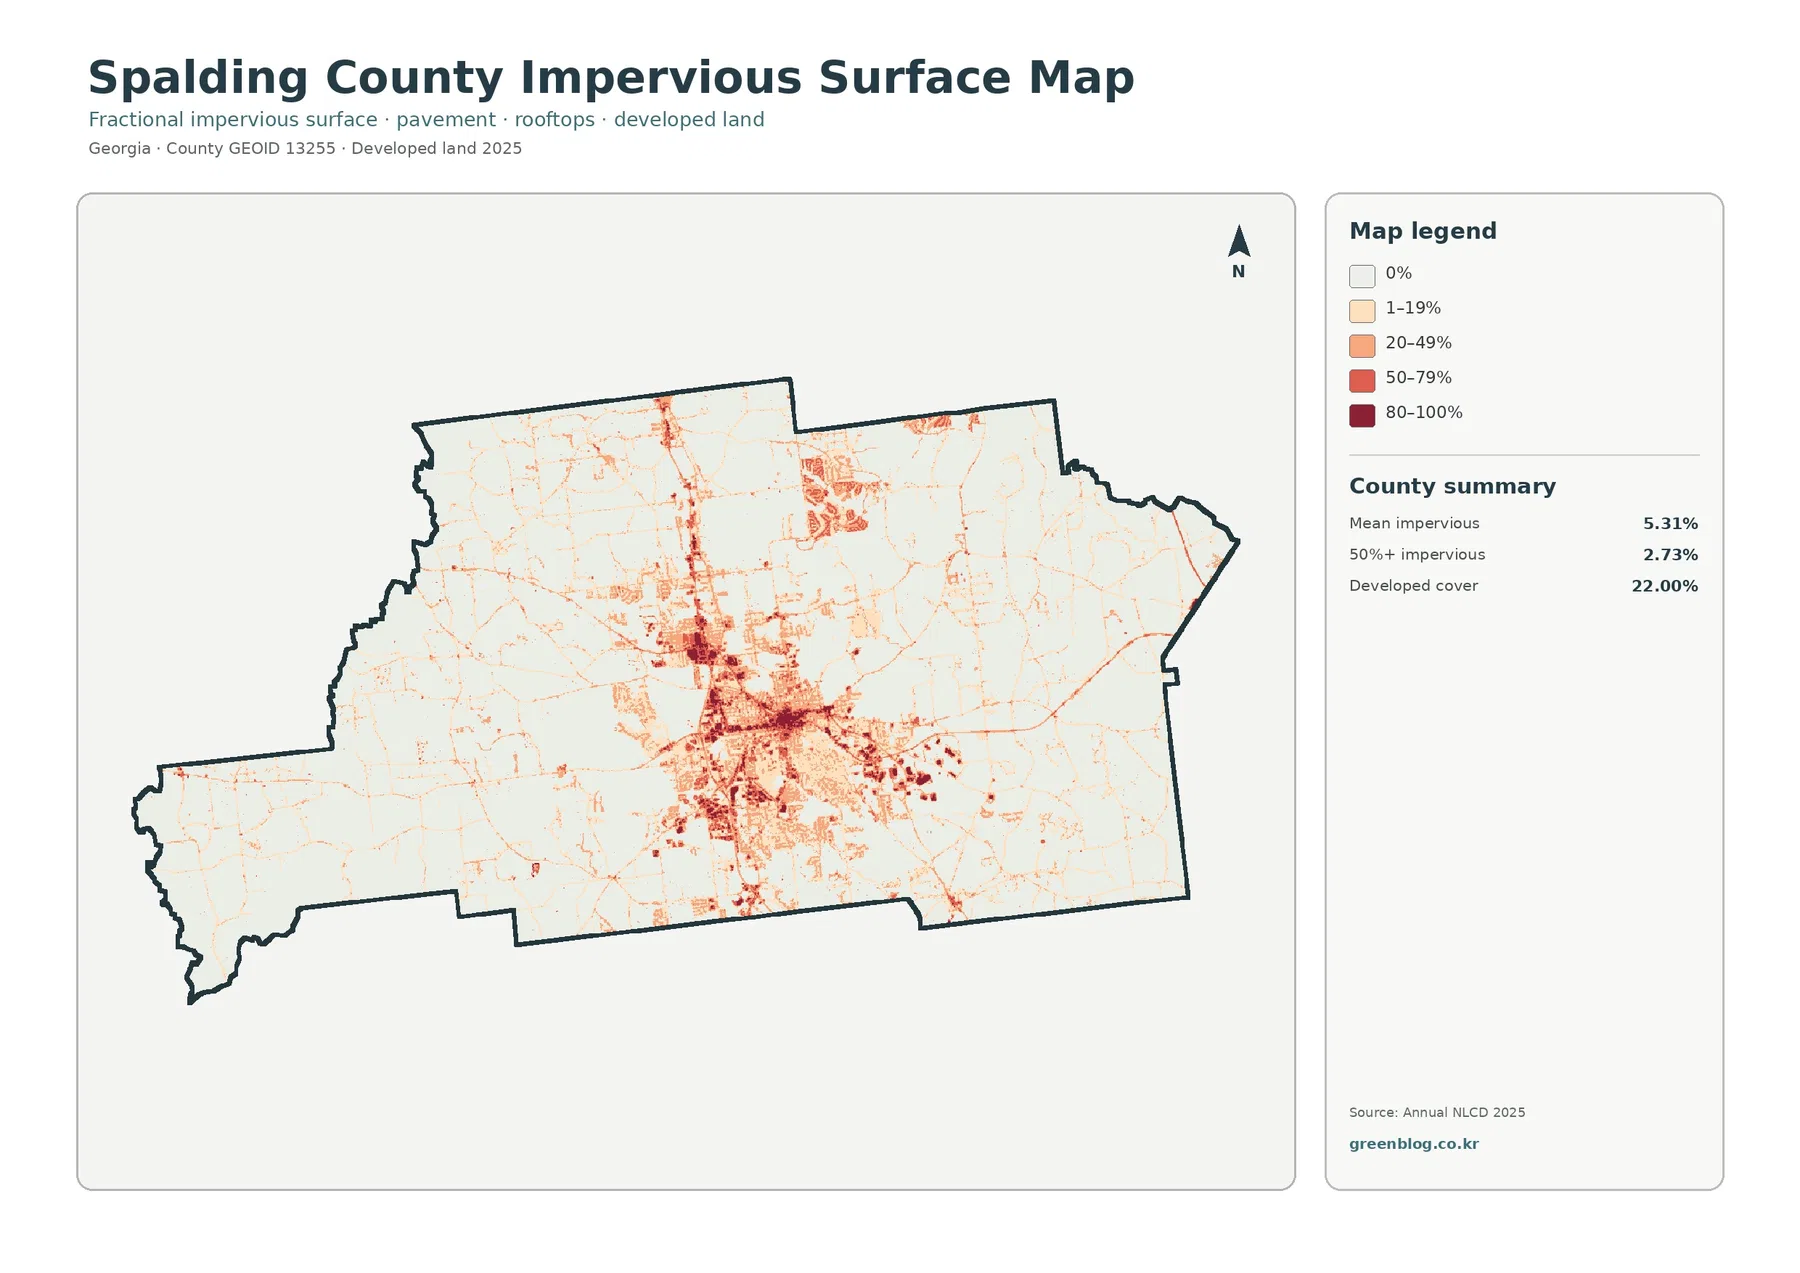
The darkest cells form a dense cluster in the central part of the county. A narrow concentration continues northward, and thinner lines spread outward along road-shaped routes. Several smaller high-intensity patches also appear beyond the main center, but they are separated by broad areas with low impervious percentages. This makes the difference between the Griffin-centered built landscape and the county’s outer forest-and-field mosaic especially easy to see.
The countywide mean impervious value is 5.31%, and areas above 50% impervious account for 2.73% of the mapped area. Neither number conflicts with the 22.00% developed-cover figure because the measurements are different. A cell can be classified as developed even when it contains substantial vegetation or open space, while fractional impervious data estimate how much of that cell is actually occupied by constructed, runoff-producing surfaces.
The 1985–2025 comparison highlights more than one kind of change
The change layer compares the mapped class in 1985 with the class in 2025. The supplied summary reports class differences across 28.14% of the county. Within that total, 7.07% is mapped as changing to developed, 7.02% as forest loss, 2.21% as agricultural loss, and 11.50% as other class differences. That last category is the largest single component of the changed area, which is an important reminder that the county’s long-term pattern cannot be reduced to a simple forest-to-development story.
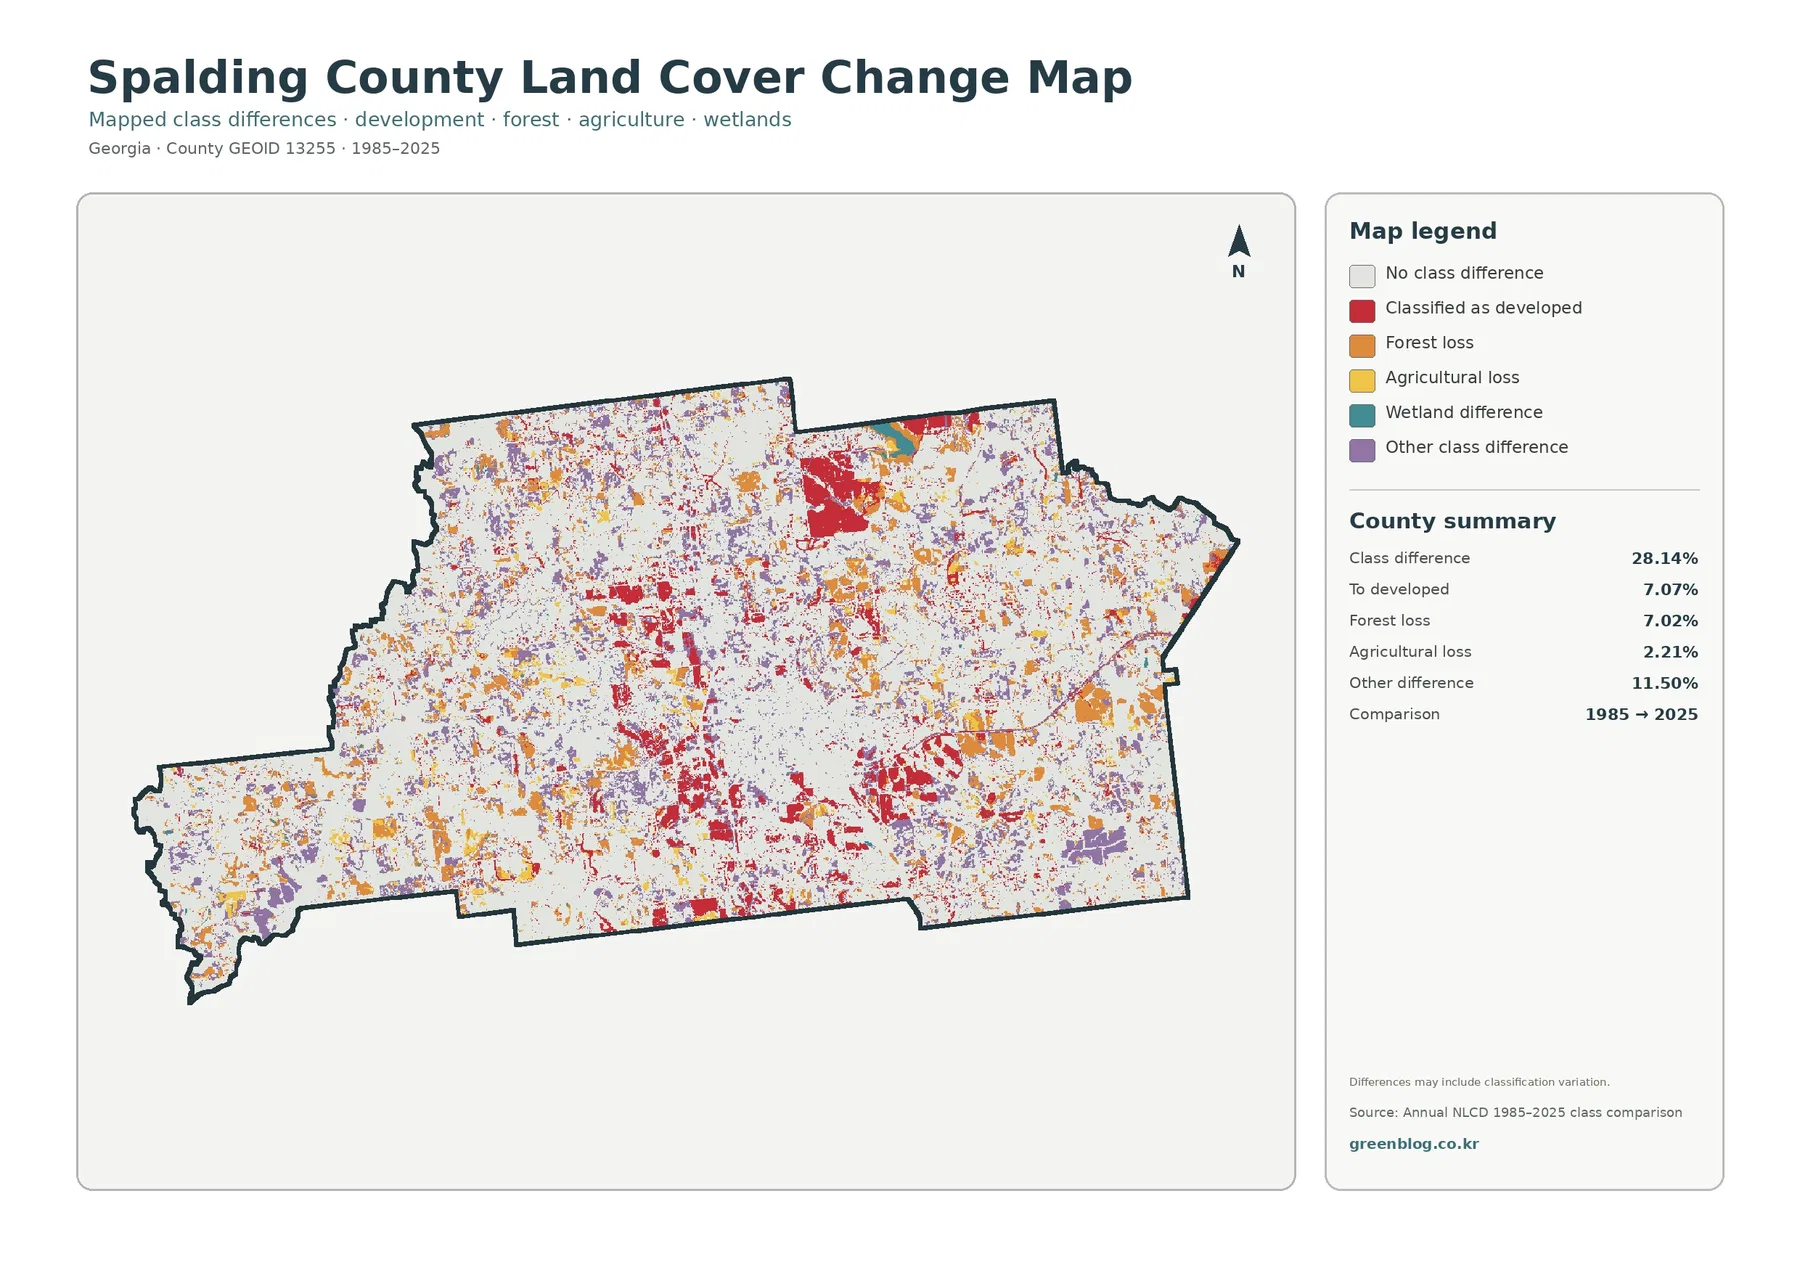
Red areas classified as changing to developed are especially visible around the present central development and in a large north-central patch. Smaller red pieces appear in other parts of the county as well. Orange forest-loss cells are more widely scattered, and purple “other difference” cells occur throughout the map. White remains the dominant background, indicating places where the broad mapped class did not differ between the two comparison years.
The map itself warns that class differences may include classification variation. Annual NLCD is produced from satellite data and models, so cells containing a mixture of forest, grass, buildings, roads, or agricultural cover can be assigned differently between years. A boundary may shift even when the on-the-ground change is subtle. For that reason, the 28.14% value means “different mapped class between 1985 and 2025,” not “28.14% of the county was completely transformed by development.”
Forest and farmland form a patchwork around the built-up middle of the county
The forest-and-farmland map removes much of the visual competition from the general land-cover layer. Developed and other cover is shown as a light background, while forest, cropland, pasture or hay, shrub or grass, wetlands, and water remain emphasized. The central light area immediately identifies where the rural cover becomes less dominant, and the surrounding green and agricultural tones show how quickly the landscape changes outside that core.
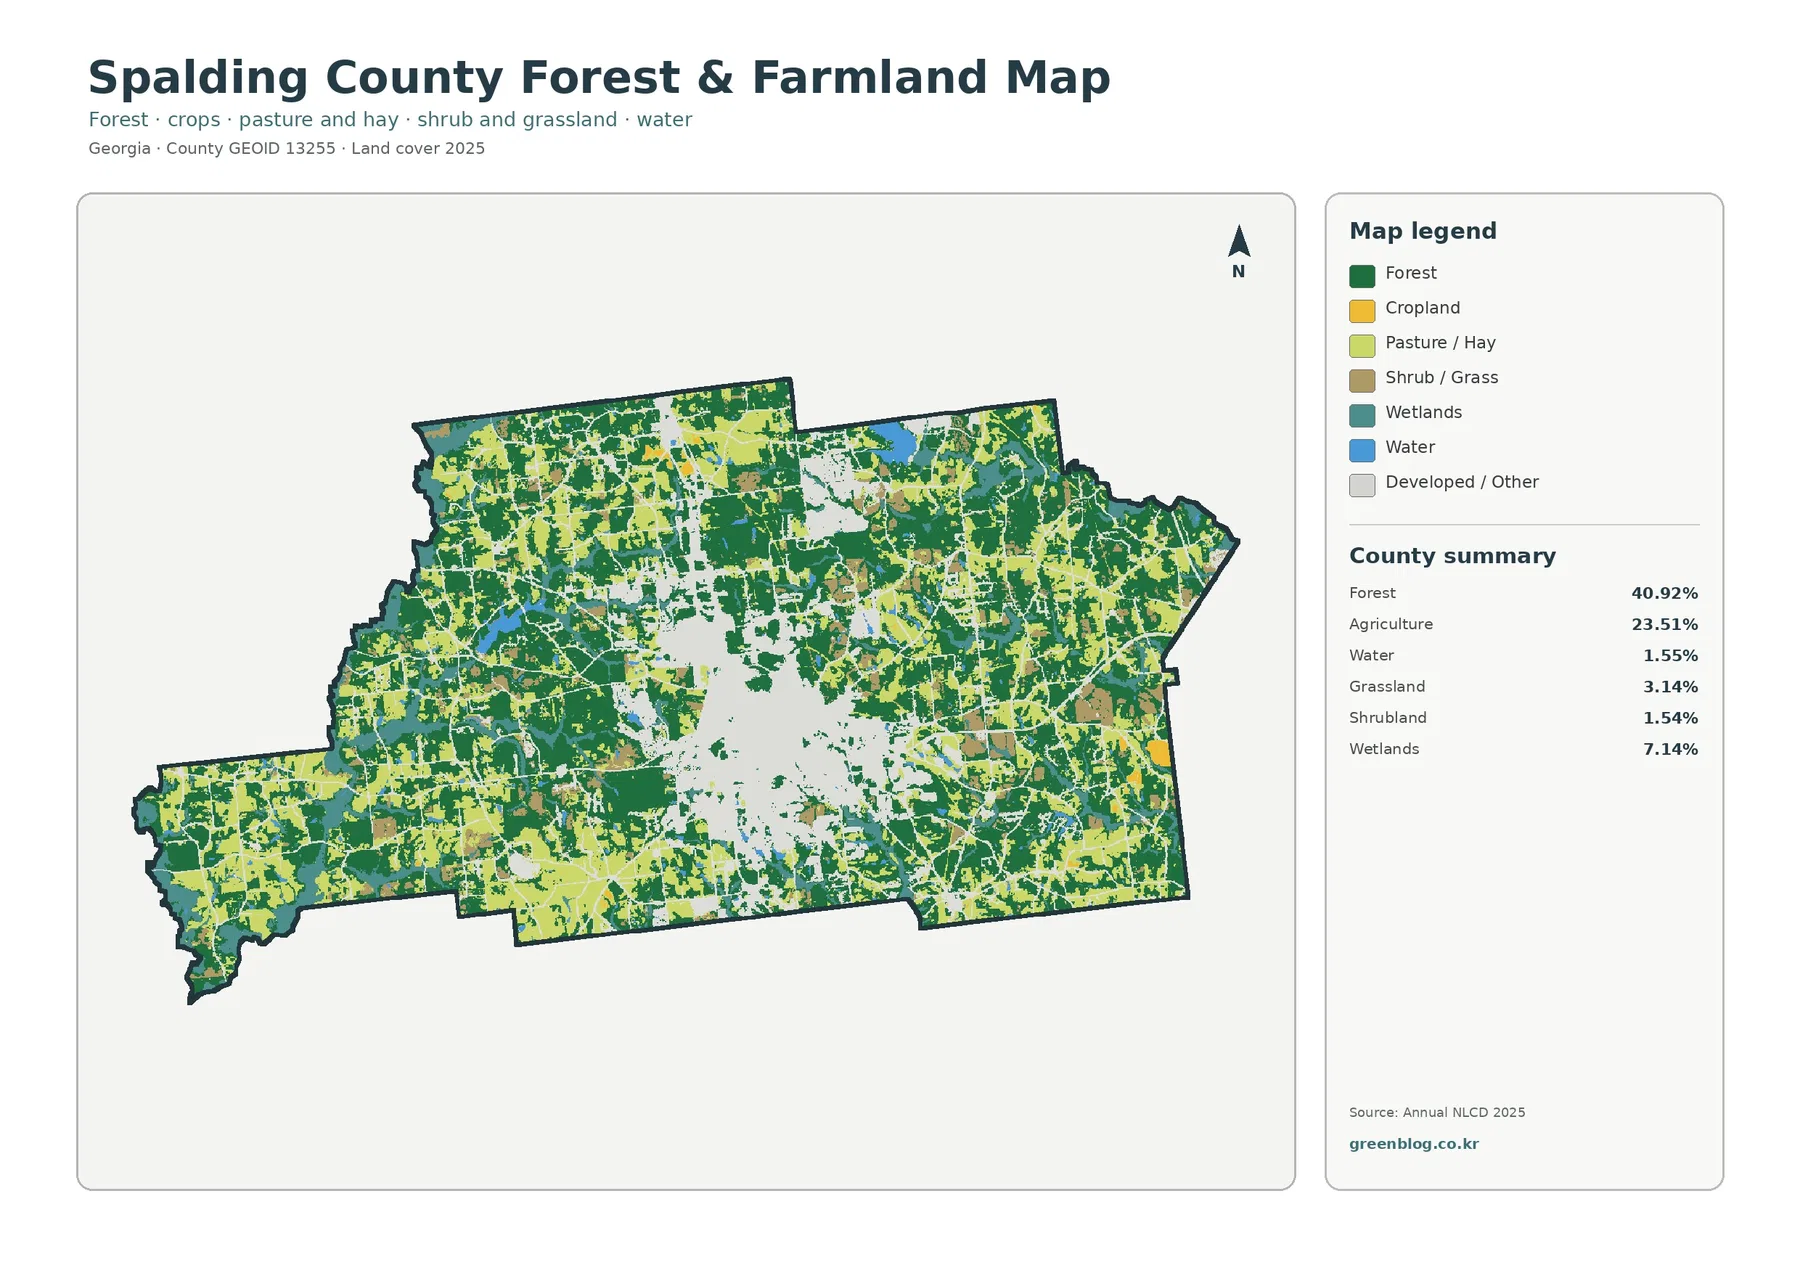
Forest remains the dominant category at 40.92%, but it is not one uninterrupted block. Green sections are broken by fields, open cover, narrow developed lines, and wet areas throughout the county. Some outer portions contain larger continuous wooded pieces, while other areas look like a fine-grained mix of forest and agriculture. That fragmentation is part of the county-specific pattern and is much easier to recognize here than on the full multicolor map.
Agriculture totals 23.51% in the supplied summary. Agricultural colors are visible in the western projection, along portions of the north and east, and near the southern edge, often alternating with forest rather than replacing it completely. The specialized legend also separates cropland from pasture or hay, so a reader can distinguish broad agricultural cover from a single uniform “farm” category. At this map scale, however, those classes should not be treated as individual farm parcels.
Use the four maps as a sequence instead of treating them as duplicates
A practical way to read this set is to begin with the 2025 land-cover map, because it establishes the countywide balance among forest, agriculture, development, wetlands, and other cover. After finding an area of interest, move to the specialized layer that matches the question. The forest-and-farmland map reduces clutter in the outer county, the impervious map separates low- and high-intensity constructed surface, and the change map adds the historical comparison.
Around Griffin, for example, the general layer establishes the broad developed footprint. The impervious layer then identifies the parts of that footprint where pavement and rooftops are most concentrated. The 1985–2025 layer can be used last to find cells that changed to a developed class over the long comparison period. This sequence keeps current land-cover class, current hard-surface intensity, and historical class difference from being confused with one another.
The downloadable JPG set is useful, but choose the map that matches the question
Read the 30-meter data as a regional classification, not a parcel survey
Annual NLCD is raster based and derived from Landsat imagery at 30-meter resolution. Each cell represents a square area on the ground, and the classification summarizes that cell rather than tracing every tree line, driveway, building edge, or narrow stream. Mixed pixels are unavoidable where several surfaces fall inside the same cell. The map is therefore designed for regional pattern recognition, not for measuring a property boundary.
Frequently Asked Questions
What is the largest land-cover category in Spalding County?
Forest is the largest category in the supplied 2025 summary at 40.92%. Agriculture accounts for 23.51% and developed land for 22.00%, creating a strong contrast between the Griffin-centered developed area and the forest-and-field pattern outside it.
Which map is best for examining development around Griffin?
Use the general land-cover map to see the full developed class, then the impervious-surface map to identify where pavement and rooftops are most concentrated. The 1985–2025 change map adds a separate view of cells whose class changed to developed during the long comparison period.
Can these maps be used to determine zoning or whether a parcel can be developed?
No. They are 30-meter raster land-cover products, not parcel, ownership, zoning, or permitting maps. For legal land-use and development rules, use the current information from Spalding County Planning & Zoning.
Map File Information
The ZIP contains four original JPG maps for Spalding County: general land cover, forest and farmland, impervious/developed land, and mapped land-cover change from 1985 to 2025.
- Included Files: Use only the versions confirmed in the article and supplied images
- File Type: Use the confirmed download contents
- Intended Use: Printing, education, presentations, and map-based projects
Related Maps
- Appling County Georgia Land Cover Map
- Atkinson County Georgia Land Cover Map
- Bacon County Georgia Land Cover Map
Sources and references
- MRLC Annual NLCD Data – official access point for Annual NLCD products and related datasets.
- USGS Annual NLCD Collection 1.2 Land Cover – documentation for the 30-meter annual land-cover product, including the 2025 extension.
- USGS Annual NLCD Fractional Impervious Surface – official description of fractional impervious-surface values.
- Spalding County Planning & Zoning – official county planning, zoning, and comprehensive-plan information.
- UGA Extension – Spalding County Agriculture & Natural Resources – local agriculture and natural-resource education and support.
Green Map creates custom-edited map images using open geographic data sources such as geoBoundaries, Natural Earth, OpenStreetMap, and government open data.
These maps are edited visual materials, not raw data files, and are provided for education, documents, presentations, and graphic reference.