Lowndes County combines a large urban center with substantial wetlands, forest, and working farmland. In the supplied 2025 summary, wetlands account for 28.82%, forest 26.09%, developed land 17.66%, and agriculture 17.04%. The strongest built concentration is in the middle of the county around Valdosta, while separate smaller clusters appear to the northwest and northeast. This Lowndes County Georgia Land Cover Map explains those contrasts with four related map views.
Readers can move from the 2025 countywide pattern to a vegetation map, a hard-surface view, and a comparison between the 1985 and 2025 classifications. The WebP previews can be compared with the text, and the four original 2480 × 1754 JPG maps are available together in one ZIP for profiles and presentations.
Table of Contents
Valdosta is the clear hard-surface center, with smaller northern clusters beyond it
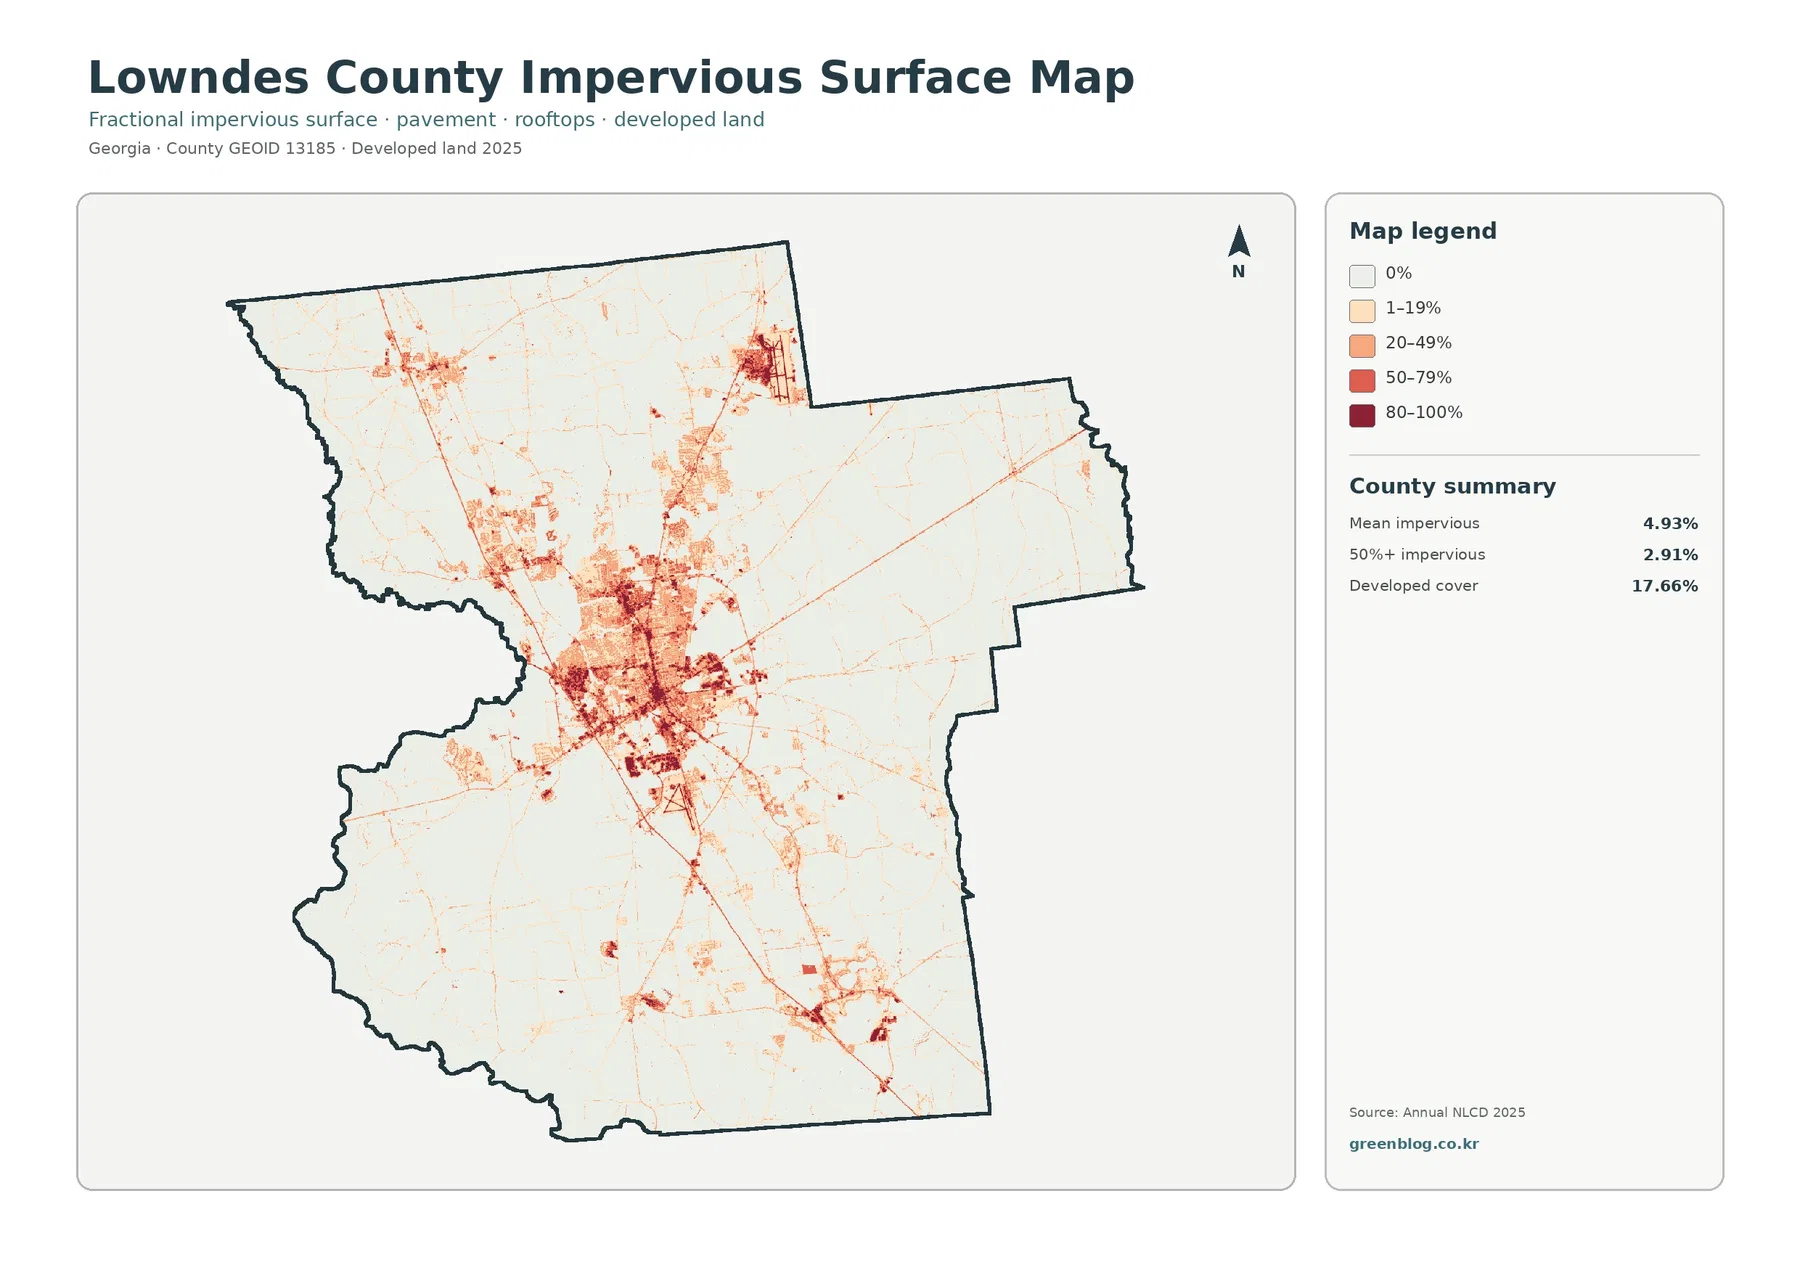
The impervious map immediately separates the central urban area from the rest of the county. A broad zone of dark and medium tones surrounds Valdosta, with hard-surface lines radiating outward along several travel corridors. Smaller but distinct concentrations appear in the northwest and northeast. Farther south and along the outer eastern and western edges, hard-surface values drop sharply and large rural areas remain close to zero.
Mean impervious cover is 4.93%, and 2.91% of the county is mapped at 50% impervious surface or higher. Those values are still well below the 17.66% developed-land share because developed classes can include lawns, trees, yards, and open soil around structures. The impervious layer focuses on the harder portion of the built environment, such as roofs, pavement, and parking areas.
Lowndes County lists Valdosta, Hahira, Lake Park, Remerton, and Dasher as its municipalities. That official place context helps interpret the central and satellite development pattern without turning the raster into a political map. The images do not draw city limits, so an individual high-value patch should be assigned to a municipality only after checking a verified place boundary.
For parcel or planning questions, the county provides a separate regional GIS through its Planning Office. VALOR includes parcels, addresses, flood zones, zoning, and utility service areas. Those layers answer legal and administrative questions that the impervious map cannot answer. Here, the useful information is simply where hard surfaces are most concentrated and where they fade into rural cover.
The countywide map is unusually balanced among wetlands, forest, development, and agriculture
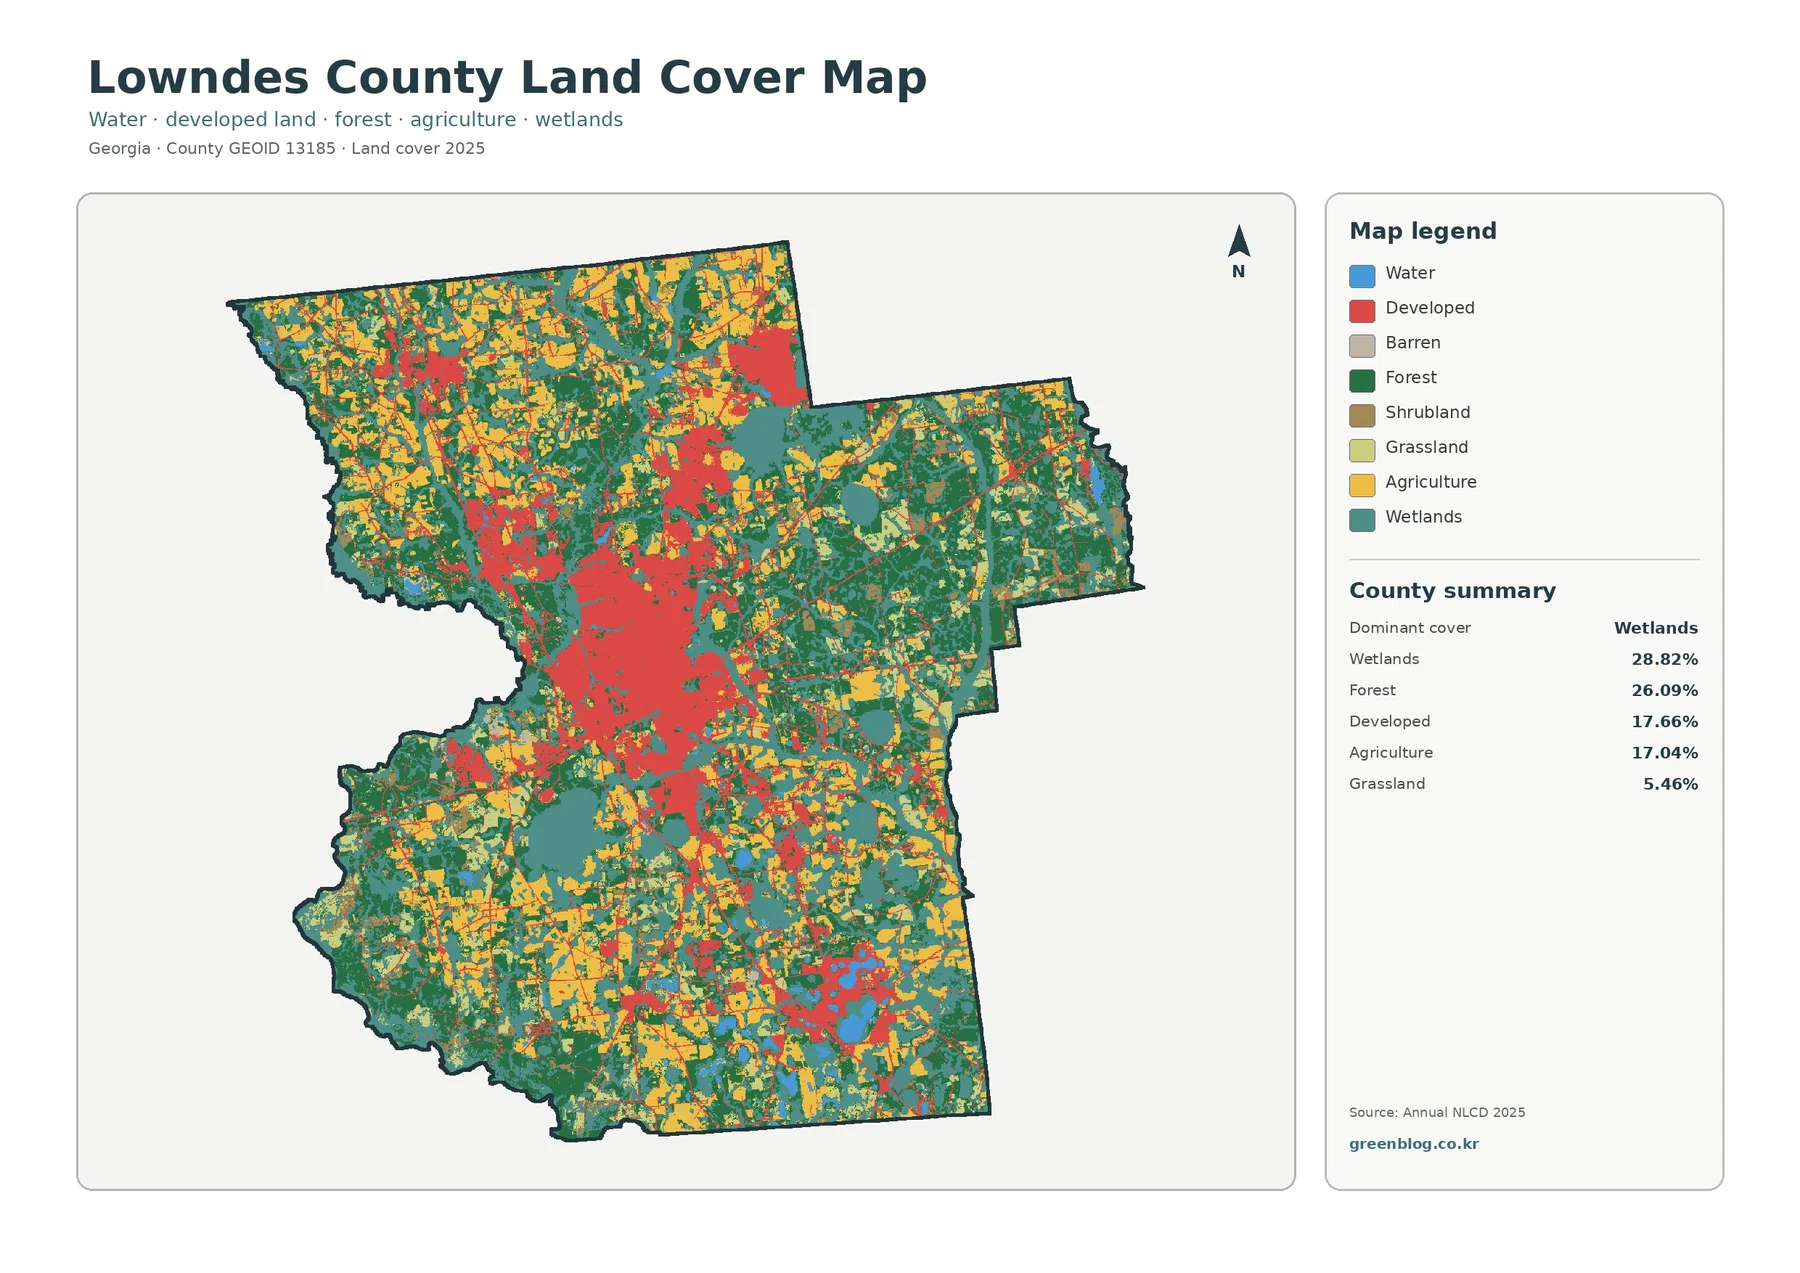
Wetlands lead the 2025 summary at 28.82%, but they do not dominate every part of the county. Teal areas form broad bands along the western edge, through parts of the center, and across eastern sections. Forest follows at 26.09%, with major green blocks in the northeast, southwest, and other rural areas. The two natural classes often meet directly and together cover more than half of the county.
Developed land contributes 17.66%, creating a much larger red footprint than in many rural Georgia counties. The central Valdosta area is the most obvious concentration, but smaller built groups appear elsewhere. Agriculture is almost the same size at 17.04%. Yellow fields are common in the northern and southern portions and continue through rural areas around the urban core.
Grassland adds 5.46%, shrubland 3.37%, and open water 1.34%. In the southeast, several blue water patches sit among developed and agricultural cover, while long wetland features remain more common along the western and eastern edges.
Hahira and Lake Park add different local contexts to the satellite development pattern
The county’s official municipality list confirms Hahira in the north and Lake Park in the south, along with Valdosta, Remerton, and Dasher. The northwest map cluster can therefore be considered in the context of Hahira, while the southeastern developed-and-water pattern can be compared with the Lake Park area. The connection is geographic context rather than a pixel-by-pixel city assignment, because no municipal outlines appear in the supplied images.
Lowndes County’s history page describes Lake Park as being close to I-75 and associated with area lakes and outdoor recreation. That description helps explain why the southeast deserves separate attention when reading the countywide map. Small blue water bodies, developed patches, forest, and agriculture sit close together there instead of following the same pattern as central Valdosta.
The forest-and-farmland view shows a rural landscape that is mixed rather than field-dominated
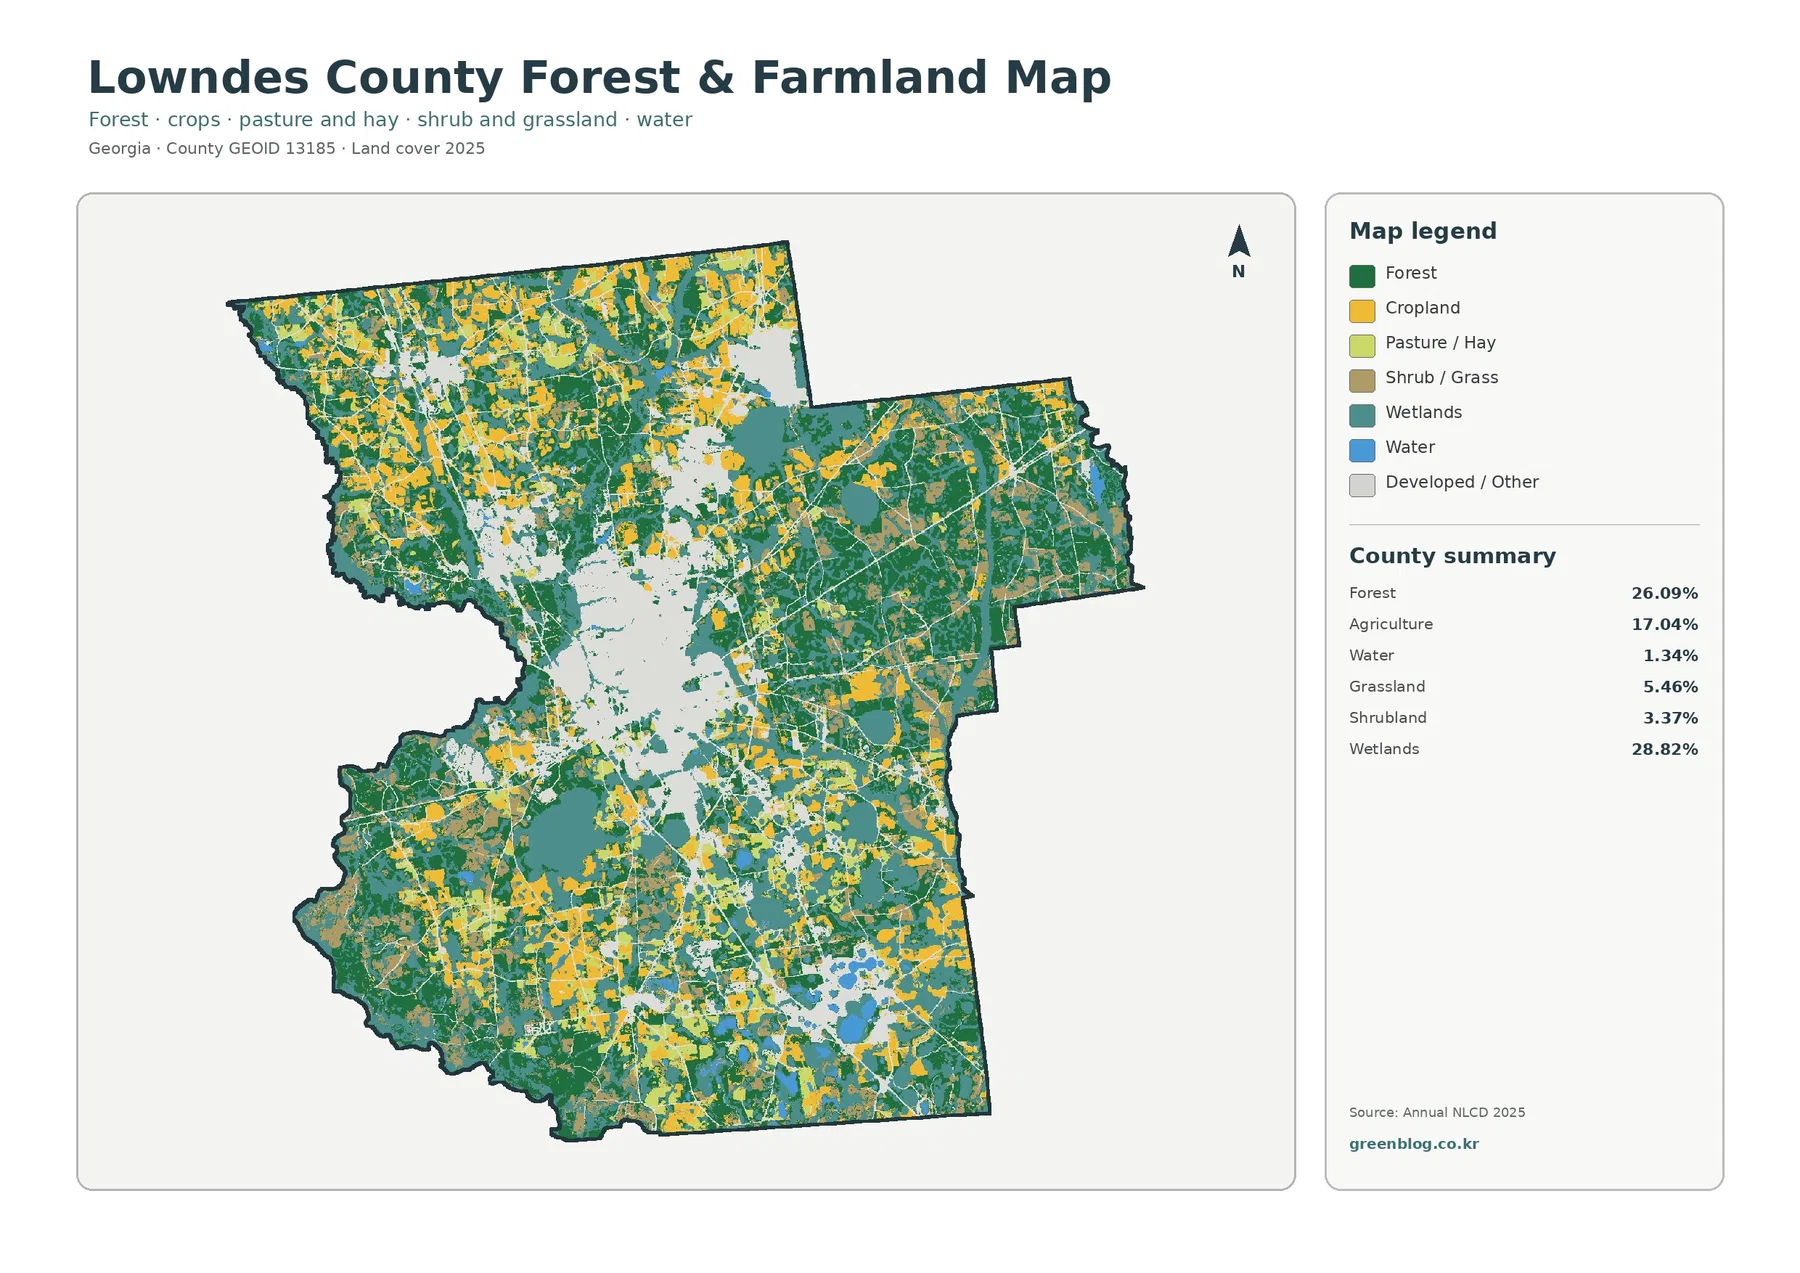
Removing the strong developed colors reveals a complex rural mosaic around the urban core. Yellow agricultural blocks are frequent in the north, south, and outer east, but they rarely continue without interruption. Forest occupies larger green sections in the northeast and southwest, while wetlands cut through both forested and agricultural areas in long teal bands.
Lowndes County’s UGA Extension office provides soil and water testing, farm visits, production-agriculture information, and other natural-resource services. Recent Extension impact material also discusses peanut-production field work in and around the county. That local information confirms the importance of agriculture, but the land-cover map does not identify individual peanut, cotton, hay, or vegetable fields. Yellow cells represent broad agricultural surface classes.
The 1985–2025 comparison places developed change near the same major built centers
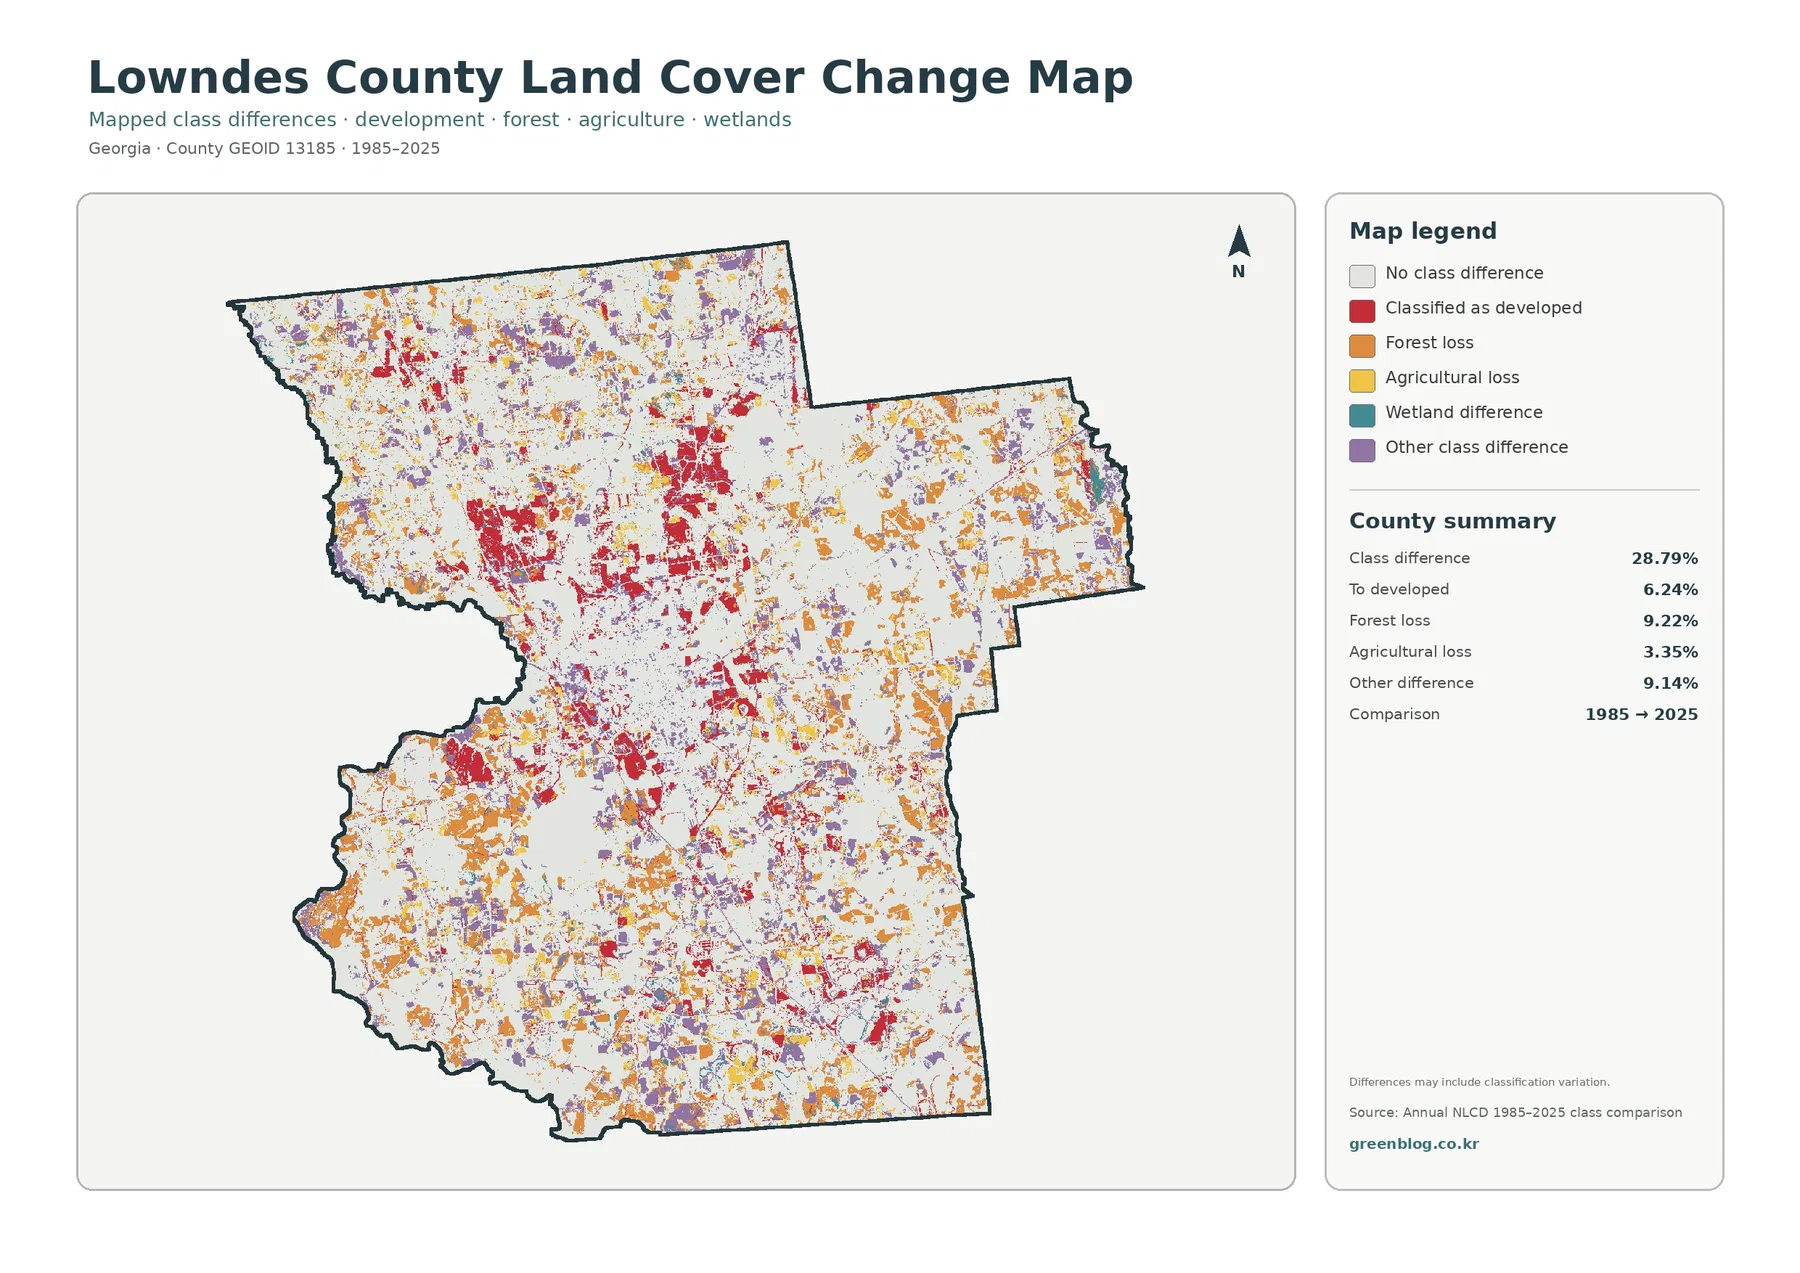
The total class difference between the 1985 and 2025 endpoints is 28.79%. That figure counts cells that received different classifications in the two endpoint years. It is not a damage rate or the share of the county that became urban. The map also notes that classification variation may be present, so imagery date, seasonal conditions, mixed pixels, and model decisions can contribute to some differences.
The printed summary lists 6.24% classified to developed, 9.22% forest loss, 3.35% agricultural loss, and 9.14% other difference. Red developed-change cells are dense around the central Valdosta area and reappear in the northern satellite clusters. Orange forest-loss and purple other-difference cells are spread more broadly across the east, south, and western rural areas.
Wetland difference is shown in the legend but does not have a separately printed percentage. The missing value should not be recreated by subtraction and presented as an official rate. Likewise, a forest-loss or agricultural-loss cell does not reveal the cause. Timber activity, construction, crop rotation, storm effects, vegetation recovery, and classification variation require additional imagery or local records.
The download contains four original JPG map views
The 2025 countywide map works best as a general introduction. The vegetation map gives more attention to forest, farmland, wetlands, grass, and shrub cover; the impervious map is the clearest choice for hard-surface intensity; and the endpoint map is designed for 1985–2025 classification differences. Each original JPG measures 2480 × 1754 pixels and is suitable for screens, reports, classroom material, and presentation graphics.
Frequently Asked Questions
What is the largest land-cover class in Lowndes County?
Wetlands are the largest class in the supplied 2025 summary at 28.82%, followed by forest at 26.09%. Developed land at 17.66% and agriculture at 17.04% are also substantial, so the county has a much more balanced urban-rural surface mix than a single-class landscape.
Why does Lowndes County have a 4.93% mean impervious value?
The central Valdosta area contains a broad concentration of roofs and pavement, and smaller developed clusters occur elsewhere in the county. The countywide mean combines those high-intensity locations with large rural areas that have very little hard surface, so local values vary much more than the single average suggests.
Does the 28.79% endpoint difference mean that much of the county was damaged?
No. Instead, 28.79% measures the portion of raster cells whose class label differs between the two endpoint years. The summary separately lists 6.24% classified to developed, 9.22% forest loss, 3.35% agricultural loss, and 9.14% other difference. Cause and timing require additional evidence.
Sources and Reference Data
- MRLC Annual NLCD Data – official access to annual land-cover and comparison products
- USGS Annual NLCD Land Cover Classification – definitions for wetlands, forest, developed land, agriculture, and related classes
- U.S. Census Bureau TIGER/Line Shapefiles – authoritative county, place, and transportation layers for comparison
- Lowndes County – Municipalities – official listing of Valdosta, Hahira, Lake Park, Remerton, and Dasher
- Lowndes County – Planning – county land-use planning and the VALOR regional GIS with parcels, zoning, flood zones, and other layers
- UGA Extension – Lowndes County Agriculture & Natural Resources – local agriculture, soil, water, and natural-resource services
Map File Information
The ZIP contains four original JPG maps for comparing Lowndes County's wetlands, forest, Valdosta-centered development, agriculture, impervious surfaces, and 1985–2025 class differences.
- Included Files: Use only the versions confirmed in the article and supplied images
- File Type: Use the confirmed download contents
- Intended Use: Printing, education, presentations, and map-based projects
Related Maps
- Appling County Georgia Land Cover Map
- Atkinson County Georgia Land Cover Map
- Bacon County Georgia Land Cover Map
Green Map creates custom-edited map images using open geographic data sources such as geoBoundaries, Natural Earth, OpenStreetMap, and government open data.
These maps are edited visual materials, not raw data files, and are provided for education, documents, presentations, and graphic reference.