Hall County in northeast Georgia has an unusually easy land-cover pattern to recognize at first glance: Lake Lanier cuts deeply into the county, a large built-up area fills much of the central and southern section, and broad forest cover remains strongest toward the north and east. The 2025 summary puts forest at 44.07%, developed land at 29.35%, agriculture at 15.76%, and water at 8.14%. The maps on this page separate those patterns into four views so the lake, vegetation, hard surfaces, and long-term class changes can be compared without treating them as the same thing.
The four original JPG maps used for this article are available together in one ZIP download below. They are useful when a larger image is needed for printing, a presentation, classroom work, or a closer comparison of the Gainesville area, the Lake Lanier shoreline, and the more forested parts of the county.
Table of Contents
Start with Lake Lanier, then follow the developed core east and south
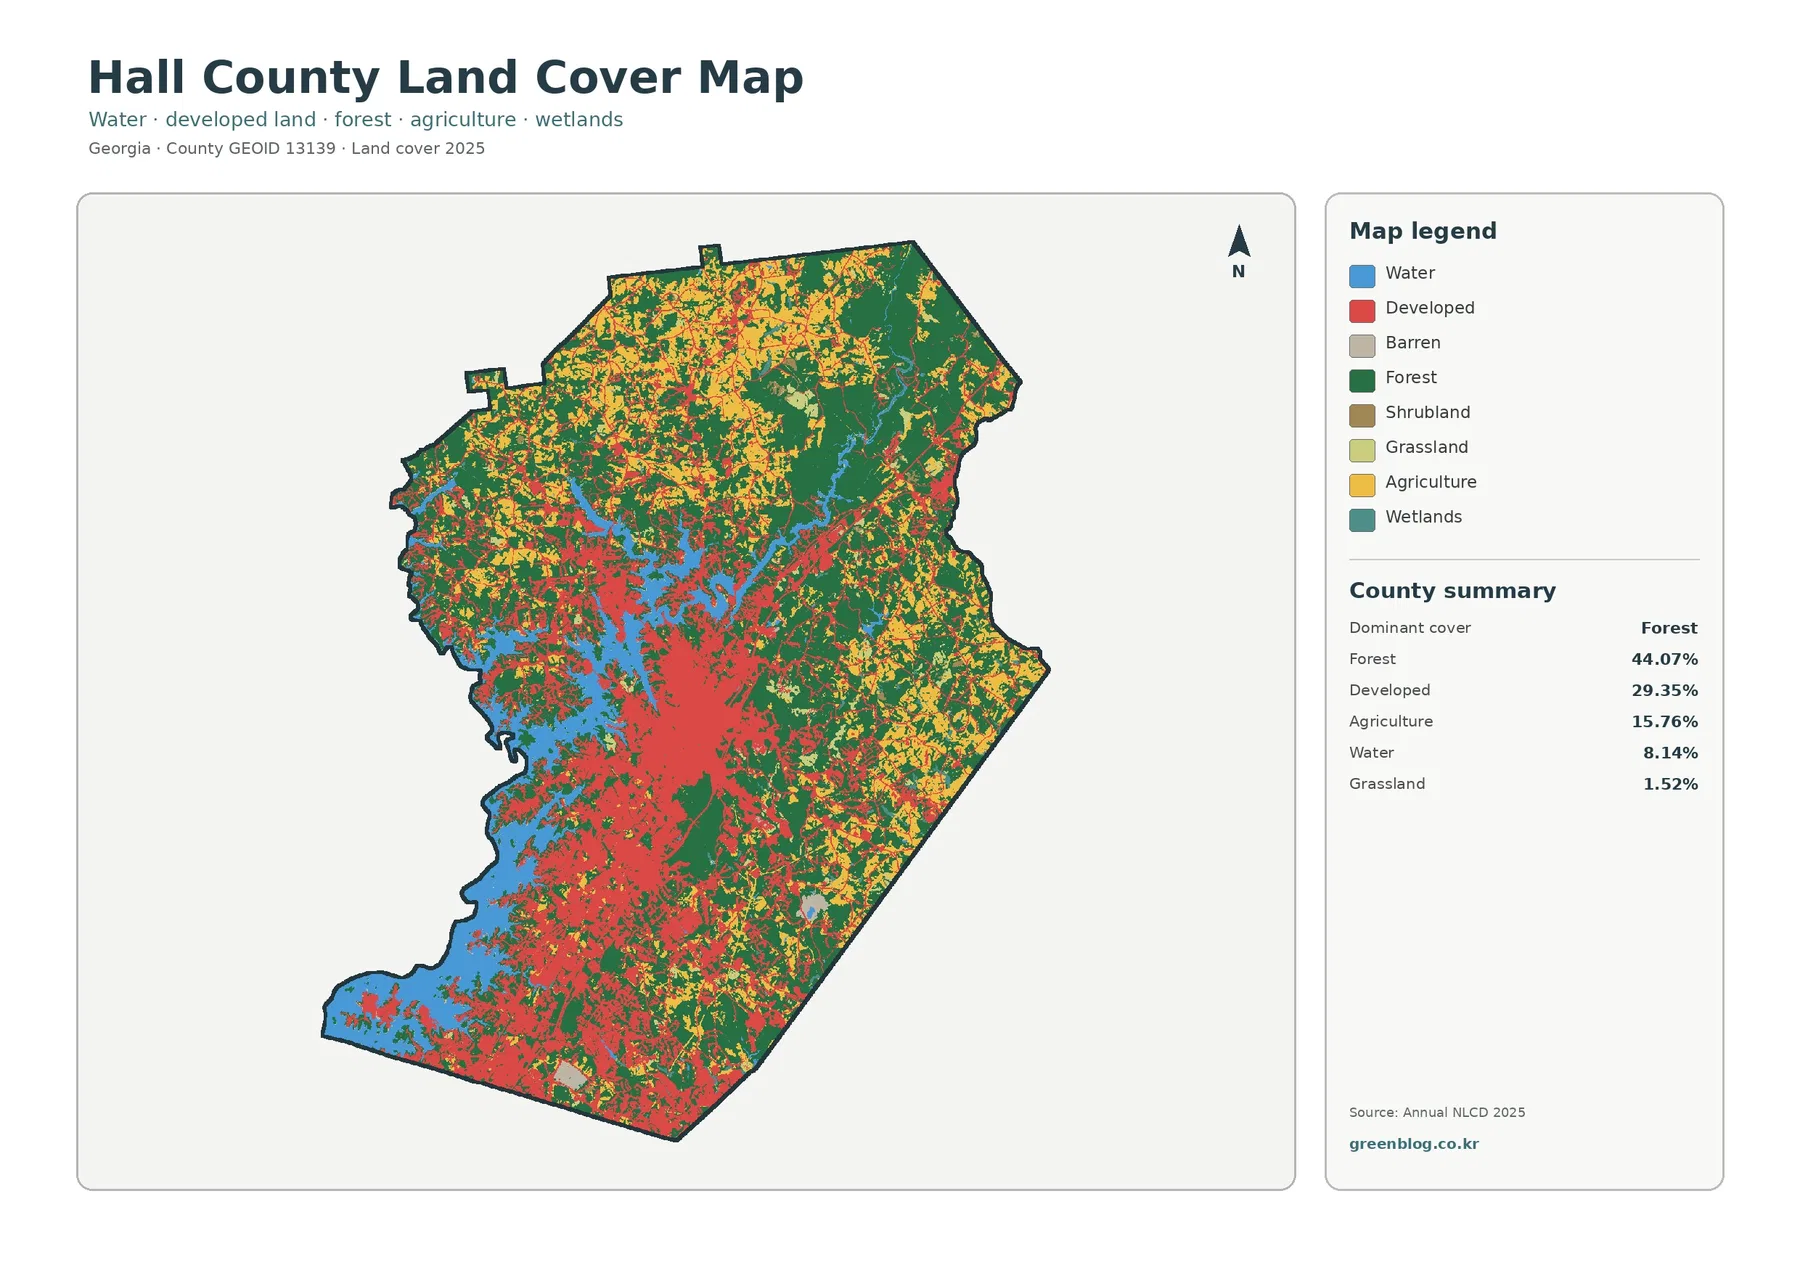
Hall County’s official budget guide places the county in northeast Georgia and identifies Gainesville as the county seat. It also notes that Lake Sidney Lanier extends from the middle of the county along much of the western side. That description matches the most obvious feature in the 2025 land-cover image: a branching blue water body occupies a large central-western area instead of appearing as a narrow river or a few isolated ponds.
East and southeast of the lake, developed land forms the county’s largest continuous red concentration. The strongest cluster sits in the central part of Hall County, with additional developed cover extending southward. Gainesville, Oakwood, and Flowery Branch are all in this general part of the county according to local government mapping. The land-cover image does not draw municipal boundaries, so the red area should be understood as a surface-cover pattern rather than a precise outline of any city.
The north and northeast look different. Large forest blocks remain visible there, while agriculture appears in smaller patches between forested areas. Along the lake, the shoreline breaks the surrounding land into many narrow peninsulas and coves, so forest, development, and other cover types meet along a long, irregular edge. This contrast between lake, built land, and forest is more informative than the countywide percentages by themselves.
Forest and farmland remain broad outside the densest urbanized areas
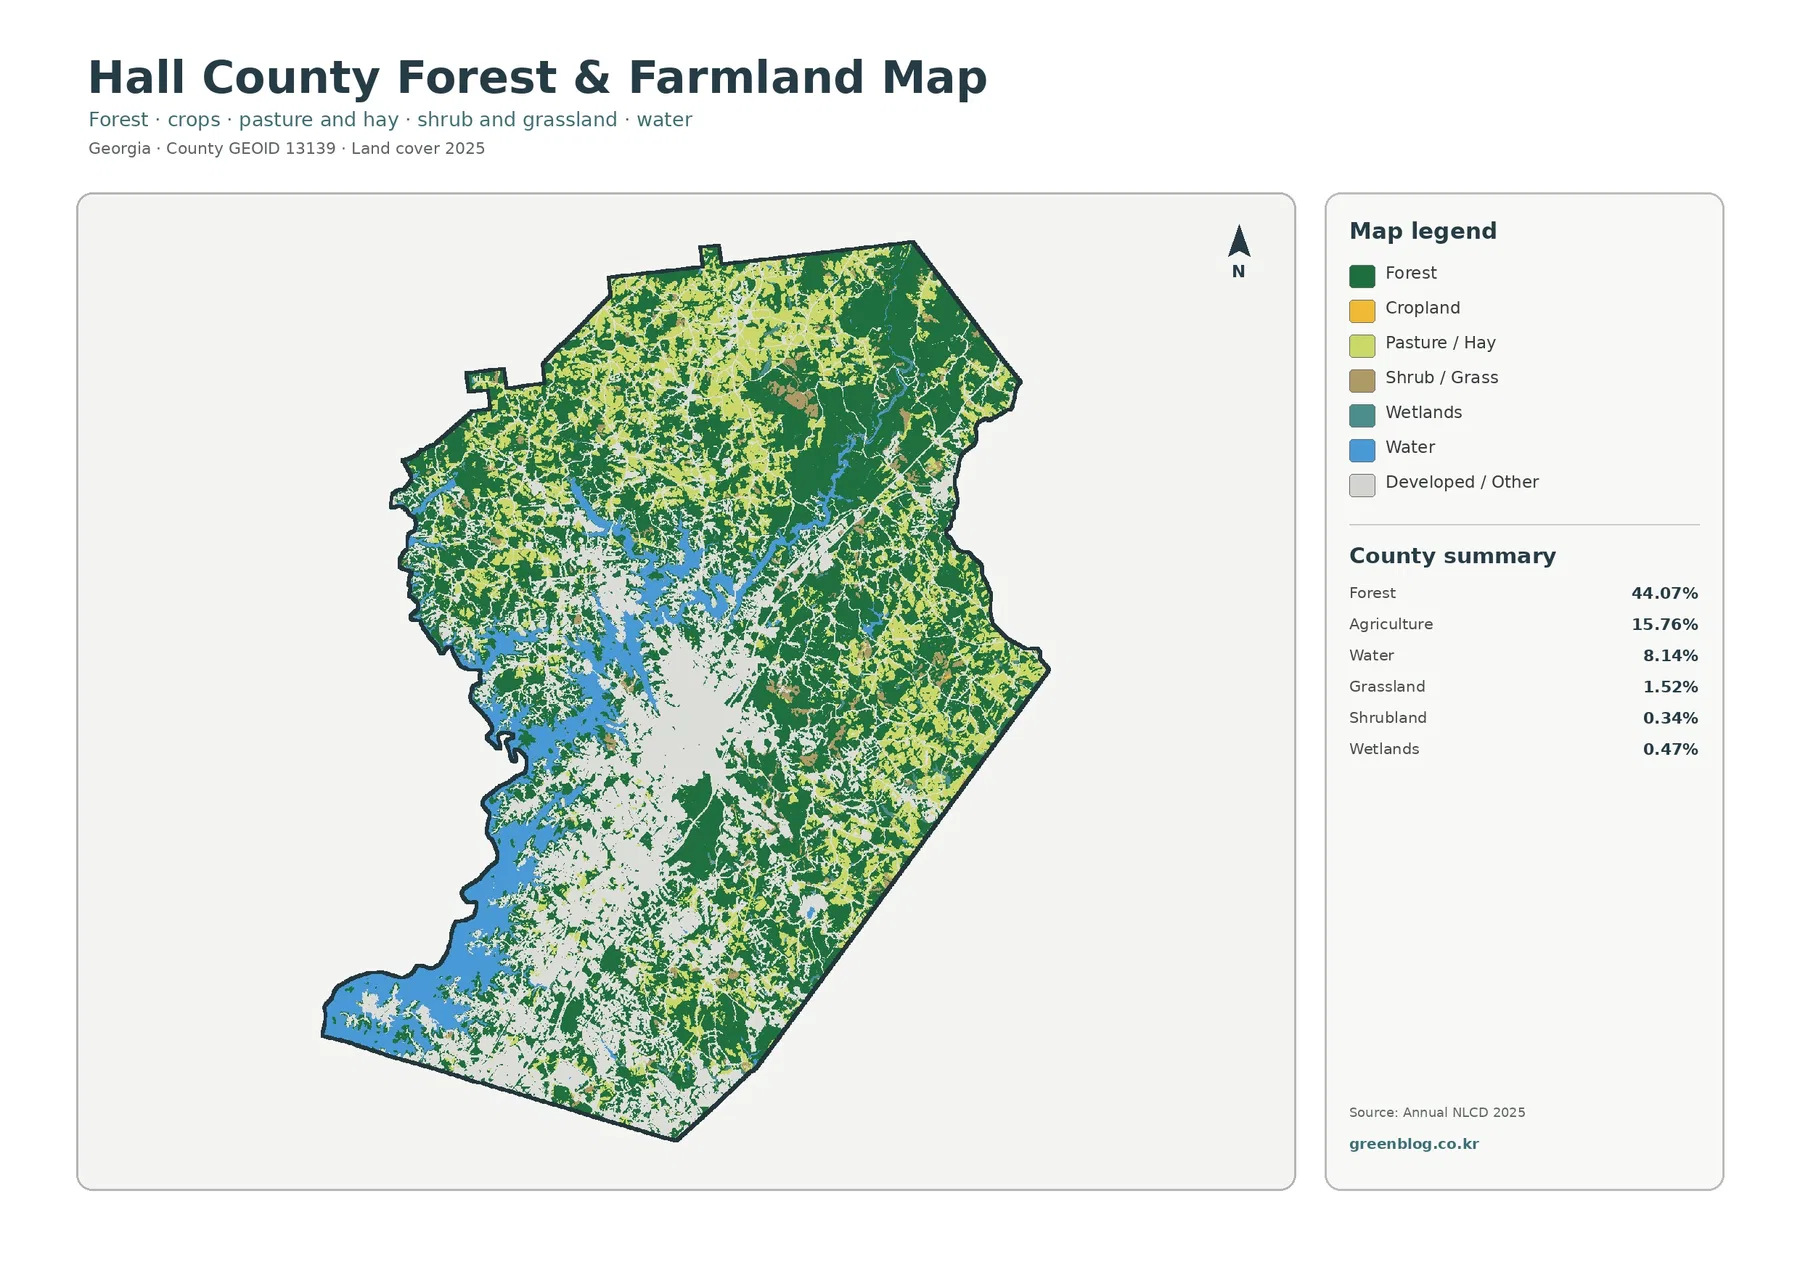
The forest-and-farmland view removes much of the visual competition from the full land-cover map. Forest is still the largest category at 44.07%, but it is not distributed as one uniform block. The northeastern part of the county contains some of the broadest continuous green areas. Farther west and toward the center, forest becomes more fragmented as water, agriculture, and developed or other land break it into smaller pieces.
Agriculture accounts for 15.76% of the 2025 summary. On the map it appears as many separate patches rather than one large farming belt. Agricultural cover is visible across the north, east, and southeast and frequently touches forest. UGA Extension Hall County maintains an Agriculture and Natural Resources program for farms, homes, and businesses, which confirms that agriculture and natural-resource management are active local subjects. The map, however, does not identify individual farms, crops, property lines, or ownership.
Grassland is listed at 1.52%, shrubland at 0.34%, and wetlands at 0.47%. Those smaller classes are easy to miss at county scale because the forest, lake, and developed areas occupy so much visual space. A useful reading method is to first locate the large forest and agricultural patches, then zoom in on the lake edge and smaller drainage areas where narrow wet or open-cover classes may appear.
The irregular Lake Lanier shoreline also changes the shape of the vegetation pattern. Forest near the water is often divided into narrow fingers, while the northeast contains larger inland blocks. That difference matters when the map is used in a presentation: two areas can both be classified as forest but look very different because one is broken by water and development and the other remains more continuous.
Hard surfaces separate the Gainesville core from lower-density development
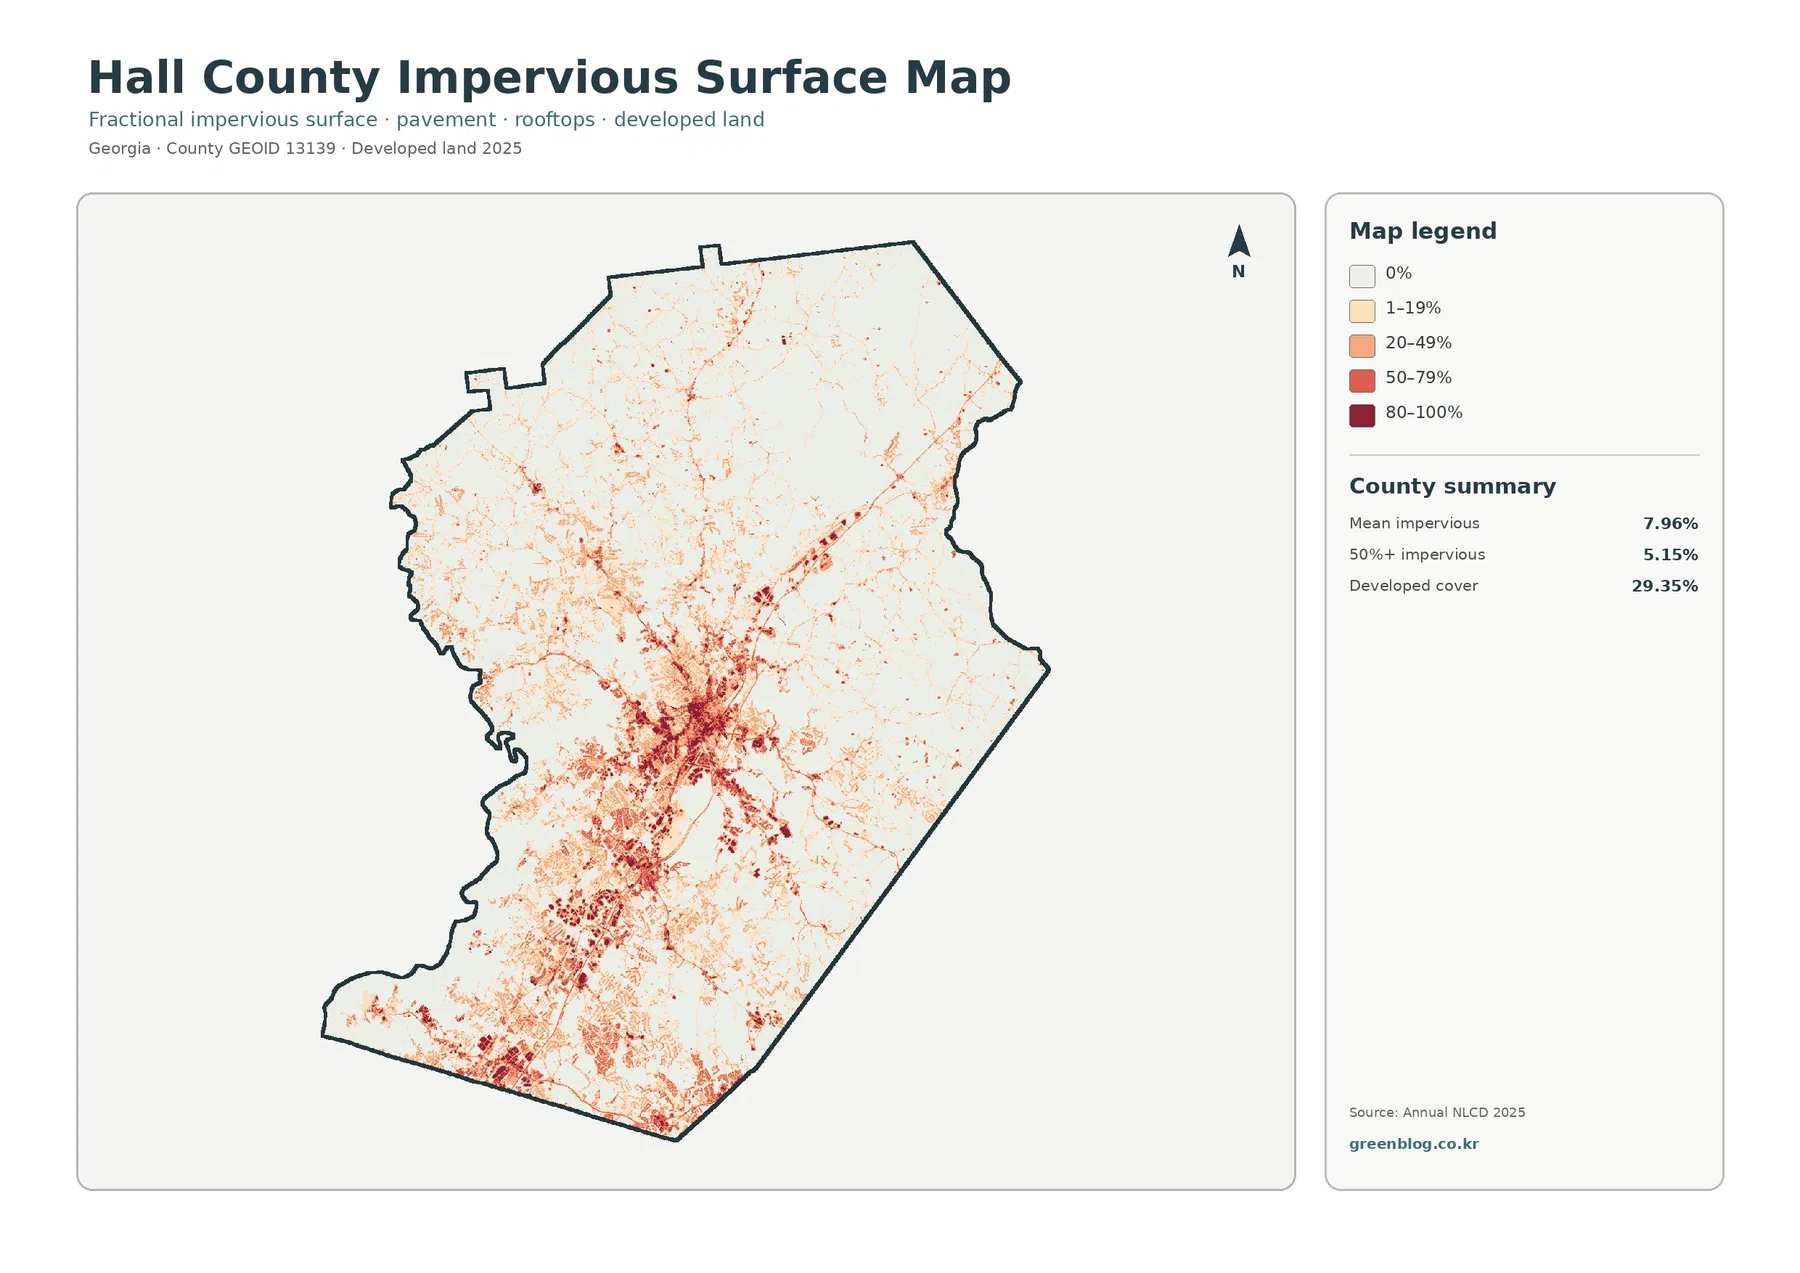
An impervious surface is pavement, a rooftop, or another surface that does not readily absorb rainfall. Hall County’s 2025 impervious map reports a mean impervious value of 7.96%, while 5.15% of the mapped area is in cells that are at least 50% impervious. These figures are much lower than the 29.35% developed-cover share because developed land can include lawns, trees, and other vegetation mixed with roads and buildings.
The darkest tones are tightly concentrated in the central part of the county and continue south in several connected clusters. When local place locations are used as context, this pattern corresponds broadly with the Gainesville area and the corridor toward Oakwood and Flowery Branch. Smaller lines and spots extend outward from the core, but the north and northeast remain much lighter overall.
This map is especially useful around Lake Lanier because the full land-cover map labels many shoreline areas as developed, while the impervious view shows how much hard surface is actually present within those developed areas. A neighborhood with trees and lawns may appear developed without being highly impervious. A compact commercial or transportation area can occupy less land yet show a much stronger impervious signal.
Impervious cover can be relevant to stormwater questions, but the image should not be used as a flood-risk map. Slope, soils, drainage infrastructure, rainfall, stream position, and lake levels also matter. Hall County’s GIS lists separate layers for flood zones, contours, streams and lakes, parcels, streets, and municipal boundaries. Those official layers are better suited to a site-specific question after the land-cover map has been used to identify a broader area of interest.
The 1985–2025 comparison highlights development change most strongly in the south
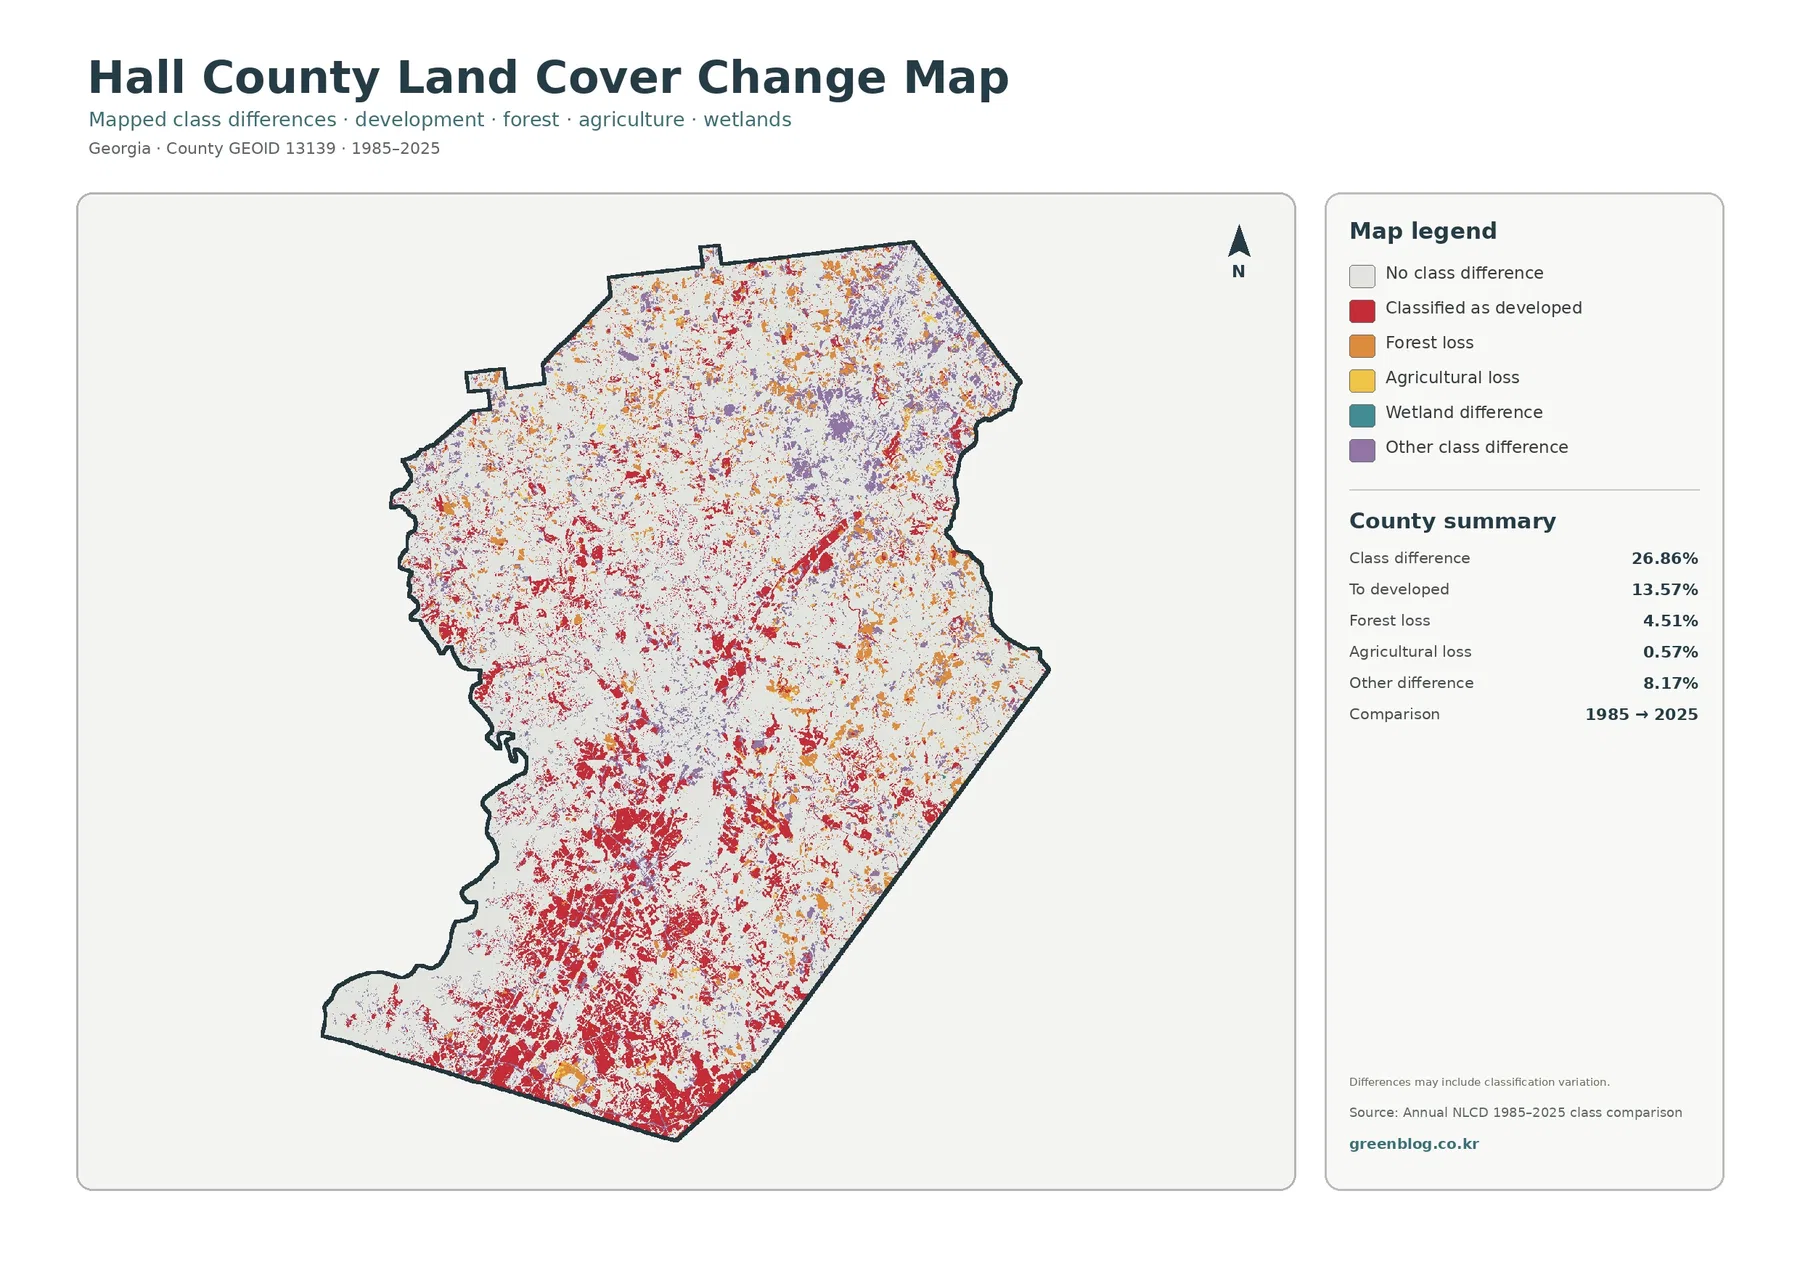
The change map reports a 26.86% class difference between 1985 and 2025. Within that total, 13.57% is classified as change to developed, 4.51% as forest loss, 0.57% as agricultural loss, and 8.17% as other class difference. The most extensive red areas occur in the southern part of Hall County, with additional clusters around the central developed area. Northern changes are more scattered and mixed with forest-related and other class differences.
Comparing this image with the 2025 impervious map is useful because many of the areas that now carry stronger hard-surface values also sit within broader zones of mapped change to developed. That is a spatial association, not proof of a specific cause. The maps do not establish which road project, subdivision, business, or population change produced any particular patch. Historical permits, aerial photographs, transportation records, and planning documents would be needed for that level of explanation.
The word “difference” also deserves attention. A colored cell does not automatically mean that the ground changed in a simple, one-to-one way. The map itself warns that differences may include classification variation. Image conditions, classification methods, and mixed 30-meter cells can cause small patches to change class between years. Large connected patterns are more useful for regional comparison than a single isolated pixel.
Hall County’s map makes that distinction easy to demonstrate. The broad southern red zones can be discussed as a major mapped pattern, while the fine speckling around the lake and in the north should be treated more cautiously. For classroom or presentation use, showing the current land-cover image first and the change image second helps keep “what is there now” separate from “where the classification differs from 1985.”
Why Lake Lanier matters when reading the county as a whole
Hall County’s official history explains that Buford Dam was built in the 1950s and created Lake Lanier. In the current land-cover map, the lake is not a minor background feature; it strongly shapes the visible county pattern. The water surface covers 8.14% in the map summary, and the branching shoreline separates neighborhoods, forest patches, and open land into many narrow landforms.
That makes the lake a practical reference point for orientation. East of the largest central water body lies the strongest developed and impervious cluster. Moving northeast, forest becomes visually more dominant. South of the main lake area, developed cover and mapped development change become more continuous. Around the western and northwestern coves, water repeatedly interrupts forest and other land cover, creating a more fragmented pattern than the large inland blocks to the northeast.
The county’s official GIS is useful for taking the next step because it includes streams and lakes, contours, streets, parcels, city limits, flood zones, and other layers. A reader can use the four land-cover maps to identify a pattern first, then open the local GIS to check the administrative or physical context. This avoids confusing surface cover with zoning, ownership, or municipal boundaries.
Choosing the right map and using the JPG set
For a quick overview, start with the full 2025 land-cover map because it places forest, developed land, agriculture, water, and smaller classes on the same image. Use the forest-and-farmland view when the main question is how vegetation and agricultural cover are distributed outside the densest built areas. The impervious map is better for separating hard-surface concentrations from lower-density development, and the 1985–2025 image is the appropriate choice when the subject is mapped change through time.
At small display sizes, Lake Lanier and the main developed core remain easy to see, but narrow wetlands, small agricultural patches, and fine impervious lines can disappear visually. The original JPG files are more useful when the legend must stay readable or when a section of the county needs to be enlarged for a report or slide. Even at larger display sizes, the maps should be treated as county-scale reference products rather than parcel surveys.
Scale, classification, and other limits to keep in mind
Annual NLCD is a raster product, meaning the landscape is represented in a grid rather than as exact parcel polygons. USGS describes the land-cover product at 30-meter spatial resolution. A single grid cell can contain several real-world features, such as trees, lawn, pavement, and part of a building. The classification therefore summarizes the surface within that cell instead of drawing every object separately.
This is especially important along Lake Lanier’s complicated shoreline. Narrow coves, small islands, docks, roads, and shoreline vegetation may fall within the same or neighboring 30-meter cells. The county-scale lake pattern is clear, but the map is not designed to decide the exact edge of water, a property boundary, or the condition of a particular shoreline lot. Current aerial imagery and official local mapping are better sources for those questions.
The 1985–2025 map needs an additional layer of caution because its colored areas represent class differences. The reported 26.86% difference should not be restated as “26.86% of Hall County was physically converted to a new legal land use.” Some of the mapped difference may come from classification variation. Broad repeated patterns can guide further research, while small isolated patches should be checked against historical imagery or local records before drawing a conclusion.
When comparing this page with older NLCD statistics found elsewhere, check that the product generation and classification basis are the same. MRLC provides the Annual NLCD data and documentation needed for that check. The percentages in this article come from the supplied Hall County map package, so mixing them with values calculated from a different NLCD generation may create differences that are methodological rather than geographic.
Frequently Asked Questions
Why does water account for 8.14% of Hall County on the 2025 map?
Lake Lanier occupies a large part of the central and western county on the map. Hall County’s official budget guide likewise describes nearly 40 square miles of the county as water and says the lake extends from the center along the western border. The official area figure and the Annual NLCD percentage are not necessarily calculated in exactly the same way, but both make clear that a major reservoir is a defining part of Hall County’s mapped surface.
Why is developed cover 29.35% while mean impervious surface is only 7.96%?
Developed land can include low-density areas where buildings and pavement are mixed with lawns and trees. Impervious surface measures the share of hard surfaces such as rooftops and pavement more directly. As a result, a broad area may be classified as developed without being mostly impervious. Hall County’s highest impervious values are concentrated much more tightly around the central built core and the southward urban corridor.
Does every red area on the 1985–2025 change map represent confirmed new development?
No. The map labels 13.57% as change to developed, but it also warns that mapped differences may include classification variation. Large connected red areas are useful for seeing the strongest countywide pattern, especially in the south, but a specific parcel should be checked with historical aerial imagery, Hall County GIS, and planning or permit records before treating the mapped class change as a confirmed development event.
Map File Information
The ZIP contains the four original JPG maps for Hall County: land cover, forest and farmland, impervious surface, and 1985–2025 land-cover change.
- Included Files: Use only the versions confirmed in the article and supplied images
- File Type: Use the confirmed download contents
- Intended Use: Printing, education, presentations, and map-based projects
Related Maps
- Appling County Georgia Land Cover Map
- Atkinson County Georgia Land Cover Map
- Bacon County Georgia Land Cover Map
Sources and References
- MRLC Annual NLCD Data – Annual NLCD data access and product information.
- USGS Annual NLCD Land Cover Classification – land-cover classes and Annual NLCD documentation.
- Hall County – About Hall County – local background on Lake Lanier and Buford Dam.
- Hall County GIS – official local mapping layers including streams, lakes, contours, streets, city limits, and flood zones.
- UGA Extension Hall County – Agriculture & Natural Resources – local agriculture and natural-resource services.
Green Map creates custom-edited map images using open geographic data sources such as geoBoundaries, Natural Earth, OpenStreetMap, and government open data.
These maps are edited visual materials, not raw data files, and are provided for education, documents, presentations, and graphic reference.